“Science is the Belief in the Ignorance of Experts”
— Richard Feynman
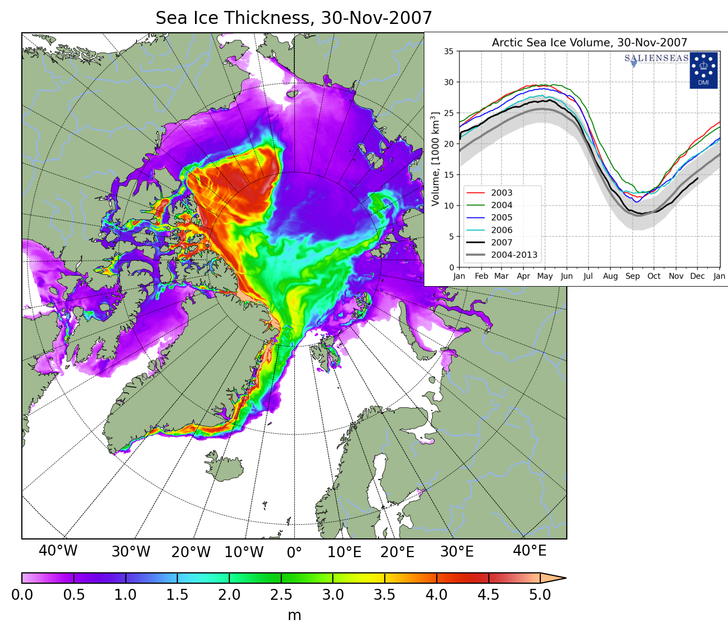
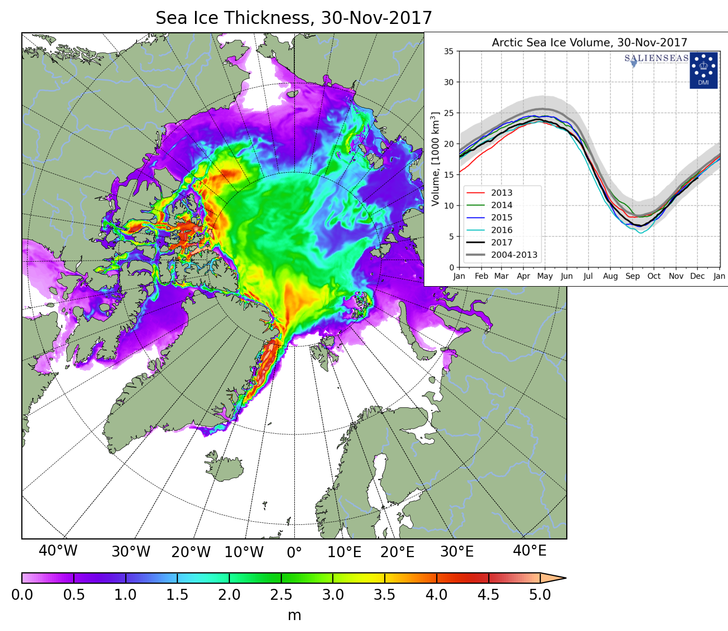
Since the end of November 2007, Arctic sea ice volume is up 15% from 13,000 km³ to 15,000 km³. There has been a huge expansion of thick ice into the East Siberian Sea.
Arctic sea ice extent is normal, rapidly increasing, and close to the 1981-2010 average.
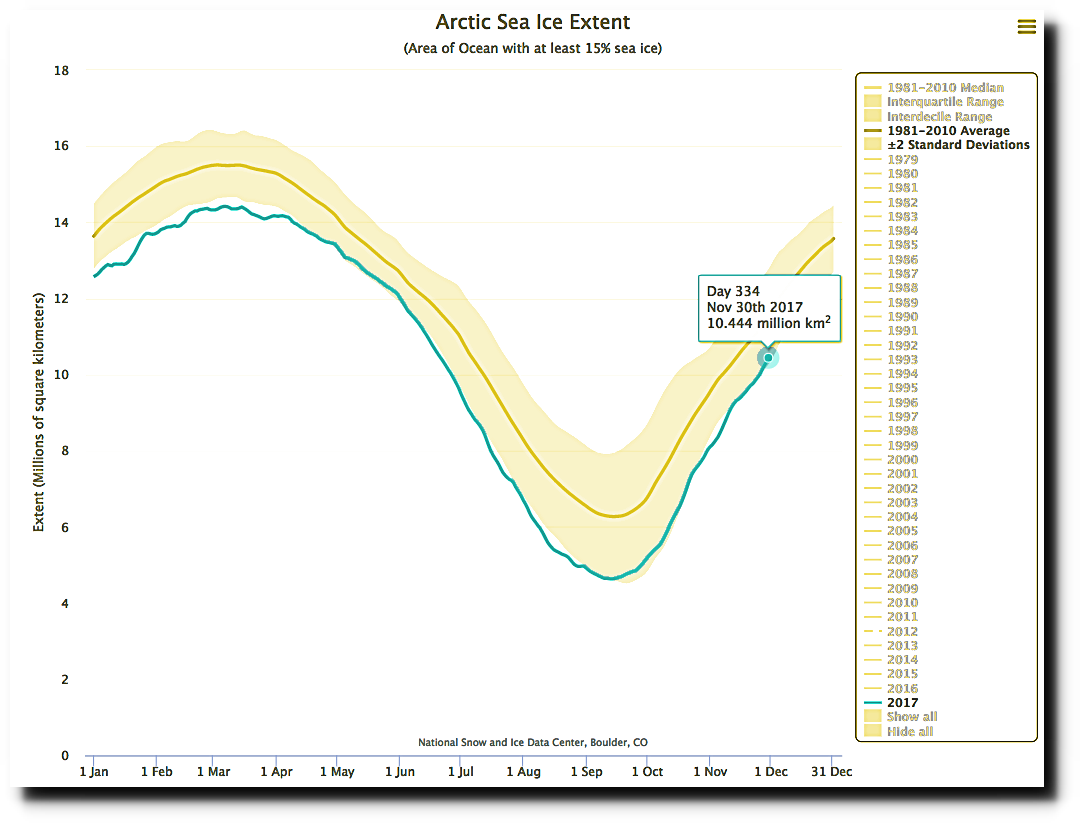
Charctic Interactive Sea Ice Graph | Arctic Sea Ice News and Analysis
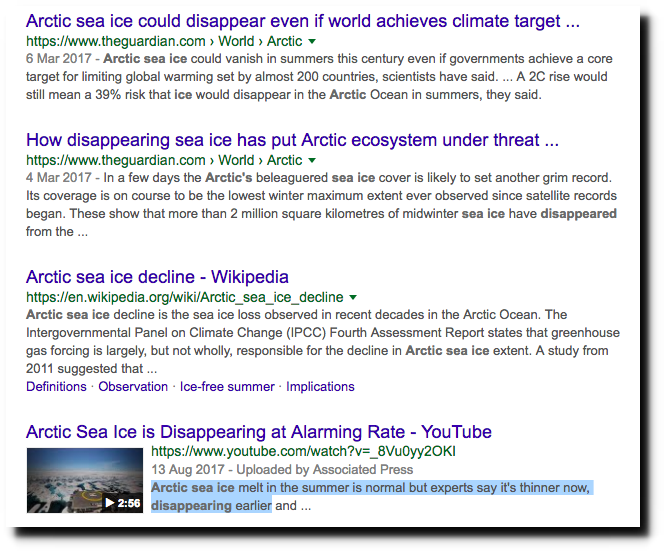
Meanwhile, climate experts and their partners in crime in the press continue to claim the exact opposite – because their funding and global warming religion depends on lying about the climate.
Oh where, oh where has our Griffi-poo gone? Oh where, oh where can she be?
Please stop insulting poo.
Insults drove her away. She wanted rational arguments.
Hard to be rational with someone that denies reality even when you shove it under her nose.
She got dozens,maybe even hundreds of
global cooling articles from her very own mainstream scientists to read.
She got a lot info about data manipulation,erasing heat waves from the past,
non existing ‘increased’ sea level rise(she lives for decades on an island to see it on her own)
She knows about climate gate 1&2 and that the number
of polar bears is not shrinking but rising.
And so much more,and she denied to learn a single thing or come to conclusions a 5 year old would.
Instead some senseless nitpicking about wether polar ice has a gallon more volume than the year before.
Insults drove her away. She wanted rational arguments.
Now that’s funny!
In the beginning I tried to reason with her but I soon found she wouldn’t have any of it. I’m old enough to recognize the pattern. It’s a waste of time to take seriously people who are not interested in serious arguments because they already have all the answers.
What rational contributions the discussion do you believe she made, GW?
“Insults drove her away. “
Oh .. diddums. !!
She/it never had any rational arguments, and never was prepared to listen when we offered them..
Unsurprisingly Arctic sea-ice is influenced mainly by the AMO. The AMO is on a downward path now:-
https://en.wikipedia.org/wiki/Atlantic_multidecadal_oscillation
My prediction is that Arctic Sea-ice will increase for the next 20 to 30 years then decrease as the AMO turns again. The cycle length being 60-70 years.
So the bottom line is so called “death spiral” predicted by the global warming alarmists will be replaced by another “Ice age scare” as their cloud cuckoo land theories shift.
I think you’re correct that grantologists (and their political backers) may try to switch again to another ice age scare.
But I think you may be a decade premature on what the AMO is going to do. Yes, it is a very long cycle, and I think there is more time to go. With its expected vicissitudes, the AMO could remain in positive territory another 15 years or more before the trend line goes below 0.0 – perhaps around 2035 if history is a guide . So, I think we may be bouncing around close to the top of the slide for awhile.
http://www.climate4you.com/images/AMO%20DetrendedGlobalAnnualIndexSince1856%20With11yearRunningAverage.gif
By then, the shorter PDO will likely have gone through another whole cycle and both cycles may be going negative at the same time. With both AMO and PDO in negative territory, and if the Sun has remained quiet, that could bode for a frosty time, perhaps cooler than the 1970s.
Throw in some wild cards – an increase in volcanism, or blocks of cosmic matter entering Earth’s atmosphere large enough to make it all the way to the ground – and we could see Dalton or even Maunder-like conditions that would make the cool 1970s look downright cozy.
But again, I think you’re right that they will probably try to scapegoat industrialization for the coming drop in temperatures, just as we saw in the 1960s and ’70s.
IMHO
Thanks for the link Disillusioned. You could be right, but the AMO will definitely go cold, and the sea-ice will go up. One thing is for sure it has nothing to do with CO2, but it will get blamed. As always, follow the money.
You’re welcome John. From where that link came:
http://www.climate4you.com/
It is a huge repository of climate data.
Even your wiki link shows the AMO likely has some more time in positive phase.
https://en.wikipedia.org/wiki/Atlantic_multidecadal_oscillation#/media/File:Amo_timeseries_1856-present.svg
Arctic sea ice obviously dissappears the same way polar bears seem to disaapear.
The more there is the bigger the threat to go extinct-at least for the usual suspects of presstitutes,scientists and their followers.
It seems some people have reached a new level of perfection in Churchills:”Never waste a good crisis”
They go so far to invent and pretend things that don’t exist(be it AGW,WMD”s in iraq,tonkin)
to get what they want and push their agenda by pretending to help and save.
Here are the MASIE and SII results for November:
https://rclutz.wordpress.com/2017/12/01/november-arctic-refreezing/
https://rclutz.files.wordpress.com/2017/12/finnov306to334.gif?w=1000&h=563
I wonder if the following statement from the first link you provided gives some insight into the apparent difference between DMI’s sea ice thickness reports and what’s reported at MAISE.
“The Arctic is on thin ice.” They are basing that notion on PIOMAS, a model-based estimate of ice volumes, combining extents with estimated thickness. That technology is not mature, with only a decade or so of remote sensing.
The Mackenzie River crossing just opened on November 30, just in time for me to drive over it on the Dempster Highway. If it hadn’t, I would have to pay a taxi $350 to give me a ride from Inuvik 127 km down to the Mackenzie, where they would bring me across on a snowmobile.
I’m in Whitehorse waiting for my flight to Inuvik. It was a brisk walk from the Airport Chalet to the airport in -17 C weather. There’s about six inches of snow on the ground. Sunrise here is about 9:47 am, so I’ll be departing in the dark.
Godspeed, Norilsk. I’m sure your daughter is looking forward to see you. Keep up your reporting.
If it wasn’t for all the GLO-BULL warming it would be -18C ;-)
Seriously though the Canadian north has been cold this fall and likely in the range of historical norms. The Hudson Bay ice coverage shows that as well as anything http://ice-glaces.ec.gc.ca/prods/CVCSWCTHB/20171120180000_CVCSWCTHB_0009748591.pdf
Here is the home site for the Canuck Ice Services http://www.ec.gc.ca/glaces-ice/default.asp?lang=En&n=D32C361E-1&grp=Guest&mn=&lang=en
“The party told you to reject the evidence of your eyes and ears. It was their final, most essential command. ”
– Orwell, “1984”
This is the first commendement for progressives
and the secret of their success to keep their lies alive which only exist in theory.
Sea ice levels are increasing because land ice (IE glaciers) are not. When land ice melts, it decreases the salinity of the ocean when it mixes. The reason more ice has been forming is because the ice is less salty, and that increases its freezing temperature, proven in multiple studies. Newspapers do not like to cover these things because its misleading upon first glance. But that’s beside the fact that sea ice does not contribute to rising sea levels, the main interest in stopping global warming. Sea ice does not contribute to sea levels because the same amount of volume it would take in water is underwater while the remaining is floating above. But if we look at the much more significant land ice, we see that glaciers all around the world have been dramatically decreasing. Worm your way around that one if you please.
I added my email if you please
Gibberish
First off ice is not “salty”. Secondly the salinity of the sea water does effect the temp and rate at which the water freezes but is a minor factor in determining ice extent and volume compared to wind and wave action.
Finally the terrestrial ice at both polar regions is increasing, not decreasing.
The SMB of the Greenland ice sheet is increasing since last year: http://www.dmi.dk/en/groenland/maalinger/greenland-ice-sheet-surface-mass-budget/
Even NASA declares that the Antarctic continent is gaining ice over all:
https://www.nasa.gov/feature/goddard/nasa-study-mass-gains-of-antarctic-ice-sheet-greater-than-losses
Sorry, I meant water when I said ice. My mistake. Water salinity does affect how it freezes. https://www.nature.com/articles/nature19101
The abstract of that paper is simple enough. There are other supporting papers for that as well.
My main point was that the level of sea ice being “normal” as the author pointed out did not matter (aside from the fact that I disagree with being in quartile 3 of mere 3 decades of data is “normal”), and that there were other reasons for it being normal.
But putting sea ice aside, let’s talk about continental ice.
You directed me to the nasa article about increasing Antarctic ice. If we were only to discuss that article that you sent me, my response is the following:
The article says that over the past 10,000 years the western region of Antarctica has been gaining ice at more or less the same rate because of increased moisture in the area. The article continues in stating that those gains of ice are able to offset losses of ice in eastern and other portions of Antarctica.
However, the article states that the loss of ice in those areas is rapidly increasing and that in 20-30 years the increase of ice in the western areas may no longer be able to keep up with the decreases in other areas. That inherently is a result of global warming. The increase of ice has not happened recently, but has been occurring for thousands of years. Unfortunately, that trend is going to be reversed in the near future as the scientist in the article admits.
The ice increase you cited in Greenland occurred only in the past year from the previous –
“The Greenland Ice Sheet is the second largest mass of ice on Earth, containing enough water that if it all melted, ocean levels would rise by about 20 feet. Greenland has shed on average 303 gigatons of ice per year since 2004, and with every successive year the loss has increased by 31 gigatons”
https://www.nasa.gov/feature/goddard/land-facing-southwest-greenland-ice-sheet-movement-decreasing
– note that movement decreases have nothing to do with ice loss overall, I merely cited the article for its statement on ice loss
What is happening is happening and as we have seen time and again climate scientists cannot forecast future climate, or ice, or sea levels, or tropical storms, or tornadoes, or temperatures, etc. Remember now, the Greenland ice sheet is supposed to be losing mass according to everyone from the IPCC to James Hanson, etc, etc, etc. But it is gaining ice. And that is the fact!
When it comes to sea ice the Arctic was supposed to be virtually ice free during the summer months by now according to many “experts” and academics. But the fact is that ice volume is higher than it was 10 years ago!
The Antarctic ice sheet is not supposed to be gaining ice but it is! And that’s the fact!
The physics of the models the IPCC uses demand that there be a persistent hot spot in the upper troposphere somewhere in the tropics. It has never been found.
Sea levels are supposed to be rising at a much higher rate than they did 30 years ago. For years we have been bombarded with warnings of catastrophic sea level rise. According the Jim Hanson the West Side hwy in Manhattan will be underwater by next year. Not even close. In fact right now global sea level is stable with no increase and actually a little decline.
The Great barrier reef was supposed to continue to bleach but in fact the bleached areas are recovering.
Tropical storms were supposed to get more intense. We had an active hurricane season in the Atlantic this year but and the Northern Indian ocean had an active season but everywhere else had well below average seasons and the southern hemisphere had near record low ACE. So the Global Accumulated Cyclone Energy for 2017 was only 81% of the average as of Nov. 30 which was the end of the Atlantic hurricane season.
I have not provided links to what I have said are the facts. You can look them up for yourself. Too many links in a post at this site causes a rejection. But here is the ACE data I mentioned.
I’m going to assume you won’t dispute me on the fact that global temperatures have risen by a few centigrade over the past century (regardless of the cause). It’s a simple average of temperature measurements over the past century. These trends are also obvious within the past few decades alone if you would argue that old measurements are inaccurate for some reason.
So given that the temperatures are rising (as a whole), how could you argue that all of its related effects aren’t apparent?
The gain in ice in Greenland is a bit cherrypicked and that’s not your fault. I did have to read into that quite a bit to find the caveat in that one. It was to the point where I was almost convinced. But I found that the study did not take into consideration the calving of the glaciers into the ocean. That is why that map is grayed out at the peripheries, where the surface mass balance is negative instead of positive. It only considered the more central areas which is the source of every glaciers flow. Other maps of SMB will show that difference. According to that very article itself;
“Over the year, it snows more than it melts, but calving of icebergs also adds to the total mass budget of the ice sheet. Satellite observations over the last decade show that the ice sheet is not in balance. The calving loss is greater than the gain from surface mass balance, and Greenland is losing mass at about 200 Gt/yr.”
I think the other troubles of that article is the poor translation… that alone made it very difficult for me.
As I said about antarctic ice, it is gaining mass as it has been over the past 10,000 years specifically in the western region as stated in the other article you provided. But as that article also states, the LOSS in the OTHER areas of the antarctic is what’s increasing, and what will continue to do so and soon outpace the gains leading to rises in sea level.
Sea levels are steadily rising already.
The “slowing decline” over the past year or two is a natural variation as with someone steadily losing weight who eats meals in between. Zooming out on the graph shows there is a clearer linear trend. After all, the west side WAS under water with a good portion of the rest of Manhattan during Sandy. Maybe it won’t be permanently next year. But definitely by 2050. I don’t know who the guy who claimed it would be by now is, but the measurements, both satellite and on ground showing the clear increasing trend is hard to deny.
I don’t want to get involved discussing coral reef bleaching as I don’t think that’s within the scope of our particular discussion nor of my particular concern at the moment.
I don’t want to have to get into a superficial discussion on models taking what you say as the truth, but here we go:
The models the IPCC use are industry standard. There may be flaws in the model but you’re not explaining to me how that affects the results and how significantly it does so to the point where it makes them wrong… models for anything on the face of this earth are “wrong” in some way but I don’t think you can discredit the works of tens of hundreds of thousands of scientist over a century who collectively worked on those things.
I am not in agreement nor disagreement with you on storm intensity, besides the fact that it is also a bit out of the scope of our discussion. What I will say is that scientists themselves are merely hypothesizing intensity increases and we can only work with around 50 years of data. Storm intensity is a bit harder to extrapolate throughout history than temperature lol.
Overall, ice levels are decreasing and sea levels are increasing. These are directly related to temperature increases (which are also definitive). The final step is the link the fact that these temperature increases are as a result of human CO2 emission. And to that I would direct you to the thousands of other graphs that show such a drastic CO2 increase without a known cause (such as a volcano explosion) that can only be attributed to human emissions. And to link the fact that those CO2 increases increase the temperature, I would direct you to the thousands of other “hockey stick” graphs that show the ridiculous warming of the earth within a single century, a rate of change that is unprecedented in the history of earth’s climate (save for the meteor strike).
If you do not know who James Hansen is that is all the proof anyone needs that you are a ignoramus or a child.
I have great news for you, child: The end of the world has been cancelled, everything will be fine, climate alarmism is a huge scam meant to extract money from people and wrest control of energy usage and place it in the hands of a small group of elitists.
Nothing unusual is happening with the weather. Climates vary all the time, and nothing will ever change that.
There has been nothing like two degrees C of warming in a century, even the lying jackasses at the IPCC say it is only o.8 degrees since 1880 or so.
But the truth is that there has likely been zero overall warming in the northern hemisphere. It used to be far hotter in the US, that is a fact. And there is no reason to think that the US is somehow having the opposite trend as the rest of the world.
It is probably impossible for an entire continent to have a different trend over such a long period of time as the rest of the planet.
Emergency cancelled, goodnight, drive safely.
“have risen by a few centigrade over the past century”
RUBBISH….Barely a degree or so out of the COLDEST period in 10,000 years
“These trends are also obvious within the past few decades “
MORE RUBBISH. The ONLY warming in the satellite temperature series has come from El Nino events, which are nothing to do with human causes what so ever.
“The gain in ice in Greenland “
Yes, Greenland ice area is very close to its maximum in 8000 year.
https://s19.postimg.org/ceo16fi7n/Greenland-_Ice-_Sheet-_Briner.jpg
“surface mass balance is negative instead of positive”
Another unproven piece of nonsense.
“The calving loss is greater than the gain from surface mass balance, and Greenland is losing mass at about 200 Gt/yr.”
Unproven generic statement, based on basically no data…
Just for you education, here is the Actual Greenland total Ice mass since 1900
https://s19.postimg.org/9i1vx9lv7/Greenland_ice_mass2.png
The Western Antarctic Peninsular lies over a massive series of volcanic activity..
There has been no warming in the Antarctic for 40 years at least, and most recent study shows it has been cooling for hundreds of years
Every little thing that you think you know, is PROVABLE WRONG
You really are proving that you are NOTHING but a gullible little child.
“Sea levels are steadily rising already.”
Yep, same trend for over 100 year..
….no anthropogenic signal whatsoever.
You really are a SIMPLE-MINDED little child, aren’t you.
Another TRUTH is that atmospheric CO2 levels are currently not that far above plant subsistence level.
The Planet DESPERATELY needs more atmospheric CO2 to feed its increasing population.
There is ZERO empirical evidence of any warming or any other downside to enhance atmospheric CO2
There is ZERO CO2 warming signature in either satellite data set,
There is ZERO CO2 warming signature in sea level rise
There is ZERO CO2 warming signature ANYWHERE
Its just one big plus for ALL LIFE ON EARTH, because..
CO2 is the Fundamental Building Block of life on this planet..
“The final step is the link the fact that these temperature increases are as a result of human CO2 emission.”
TOTAL and UTTER BULLCRAP.
There is no empirical evidence that CO2 causes any warming in our convectively controlled atmosphere.
The only warming in the satellite era is from El Nino events, which are absolutely NOTHING to do with human or any other source of CO2
No warming from 1980 – 1997
https://s19.postimg.org/iwoqwlg1f/UAH_before_El_nino..png
No warming from 2001 – 2015
https://s19.postimg.org/b9yx58cxf/UAH_after_El_nino..png
Yes, MisTruth you are sadly NIL-INFORMED.
“The models the IPCC use are industry standard. ”
ROFLMAO
Which is why they are so incredibly WRONG
Range a mile wide, and they STILL miss reality by the proverbial mile.
Even the El Nino spike in the much manipulated and tortured GISS data just touched the model mean.
Reality of UAH, shows just how quickly and horrendously wide of the mark the climate models really are. They are a FARCE.
https://s19.postimg.org/vju0f7neb/biggerfail.png
“And to link the fact that those CO2 increases increase the temperature”
UNPROVEN ANTI-SCIENCE. NOT A FACT.
There is NO CO2 warming signature in the satellite temperature record.
You have been SUCKED-IN to one of the biggest scams in a century, because you are either very IGNORANT.. or very GULLIBLE.
Longer term, New study shows that Antarctic has been COOLING since about 400AD
https://s3.amazonaws.com/jo.nova/graph/polar/antarctic/antarcticacooling.gif
And as wee all know, Satellite date shows zero warming in the region.
https://s19.postimg.org/mar5i83sj/UAH_SoPol_All.png
I responded to most of your arguments above in other areas of this thread considering how often you repeat them.
Rubbish, you haven’t put one piece of science forward 2 link only, both irrelevant
You have NOT responded to any of these points.
STOP LYING.
It makes you look extremely PATHETIC.
NSIDC: “…the change in saltiness is too small to significantly affect the freezing temperature…”
http://nsidc.org/arcticseaicenews/2014/ , “Antarctic extent patterns” … applies to the Arctic as well. It isn’t about the freezing point; it is about insulating the warm water, below.
NSIDC: ”… [below the surface,] ice shelf … meltwater is creating a cool layer near the surface of the ocean that promotes sea ice production. In addition, the meltwater is fresh, or much less salty and [less] dense, than surrounding saline ocean layers. So fresher meltwater floats upward, mixing with the cold surface layer, lowering [the surface layer’s] density. As this fresh layer expands, it forms a stable puddle on top of the ocean that makes it easier to produce and retain sea ice.” http://nsidc.org/icelights/2014/01/31/why-is-there-so-much-antarctic-sea-ice/
Bintanja, R., et al. 2013:”Specifically, we present observations indicating that melt water from Antarctica’s [sub-surface] ice shelves accumulates in a cool and fresh surface layer that shields the surface ocean from the warmer deeper waters that are melting the ice shelves.”
”As a consequence, the overlying cold atmosphere cools the upper 100 m more effectively (Fig. 3c), especially in autumn and winter when the atmosphere–ocean temperature contrast peaks. These relatively cold and fresh surface waters can then freeze over more easily, which probably explains why observed Antarctic sea-ice trends peak in autumn and early winter (1) in regions where the surface waters have become fresher (Fig. 2). The Southern Ocean thus exhibits a remarkable signature, with warming in the deeper layers being accompanied by a cooling trend in the upper 100 m. This is consistent with our hypothesis that increased subsurface melt of ice shelves (23) contributes significantly to Southern Ocean surface cooling.”
Bintanja, R., et al. 2013 “Important role for ocean warming and increased ice-shelf melt in Antarctic sea-ice expansion.” Nature Geoscience
http://www.atmos.albany.edu/daes/atmclasses/atm305/2013/27Aug/ngeo1767.pdf
SMB is NOT an INDICATOR for mass gain / loss of the Greenland ice sheet. It is onöy one (major) part of the Ice mass balance.
Just go back to the DMI web site you cited and read all of it.
Helpful could be this DMI link as well.
http://polarportal.dk/en/nyheder/arkiv/nyheder/end-of-the-smb-season-summary-2017/
As soon as someone names themselves “The Truth”….
… you KNOW they are naïve and gullible…
… and have nothing to back their baseless ego.
Not so fast, Andy. The Truth thought about it long and hard. He’s using his head, the best way he knows how.
The sad part is we’re the ones that will have to pay for that morons disability. Though I do have to say it is a good illustration of what it is like to try and explain reality to climate alarmists.
Sorry I used a dumb name. Didn’t know what else to put. But if you would like to have a discussion about global warming I would prefer that over my name choice.
WTF do you think this site is about?
I’m talking about you and I personally in this comment section.
Conversation, OK.
Every assertion you have made on this thread is false, made of nonsense, out of date talking points that are long since debunked.
Years old textbooks are a bad source of factual information.
Everything you have been spoonfed about what to think has been a load of horseshit.
A john cook climate 101 candidate.. who failed.
Or maybe one of Big Al’s propaganda monkeys.
Maybe if you’d like to stop using ad hominem we can talk…
Maybe if you stop posting mindless anti-0science propaganda pap……
but you won’t will you.. because it all you have
Seems I was correct……
Your every post shows….
… you are naïve and gullible…
… and have nothing to back your baseless ego.
The Truth is out !!
I am not… I have legitimately been considering facts that have been presented to me. I was almost convinced by your Greenland article until I found its caveat, made hard by the fact that it was poorly translated and that that extremely significant detail was saved for a small footnote in the middle of the article.
No you are totally ignoring everything in front of you.
You have made that very clear.
“Sea ice does not contribute to sea levels because the same amount of volume it would take in water is underwater while the remaining is floating above. ”
Poor little chump thinks people don’t know about Archimedes Principle
…. but explains it like he’s just out of junior high.
The most significant land ice regions, ie Antarctica and Greenland are both gaining mass
Seems Mr Truth is either Mr IGNORANT or Mr LIAR.
See my replies to other people or try to give me your own evidence on how both Greenland and Antarctica are gaining mass…
How about you forget about everyone having their own evidence and just go with reality.
Here is some more truth for you: You are completely misinformed as to the actual facts because the people you get your information from and then parrot back to others is a pack of lies.
The sooner you realize that the less stupid you will seem.
I’ve cited studies for my side and even refuted people with the very studies they’ve given me for their side. I don’t see how that’s misinformed. Studies are the closest things you can get to the facts without become a scientist and analyzing them yourself, and I don’t see you doing that. You’re the one that’s attacking me personally instead of bringing out your own facts.
Because you are spouting a pack of lies.
I have been studying the sciences since long before you were a glimmer.
You do not see me becoming a scientist?
Did you really say that?
“refuted people with the very studies they’ve given me for their side.”
Only in your feeble brain-washed little mind.
There are arguments as to what percentage CO2 humans have contributed, compared to the CO2 coming naturally from the beneficial warming out of the LIA.
I personally hope that humans are making a reasonable contribution of CO2 to feeding the plants that feed us all….
… especially when you consider the 1600 or so new coal fired power stations being built around the world, giving a CO2 emission increase of some 40%..
Great news because it ensures increasing atmospheric CO2 for many decades, even centuries to come. :-)
Coal plants aren’t bad just because of CO2 emissions… they’re plain dirty and bad for the environment and lead to acid rain, but if that’s what you think the precious plants need…
menicholas I meant I don’t see you doing that as in having already produced your own study in what we are talking about. I didn’t say you wouldn’t become a scientist. By all means, do so…
“they’re plain dirty and bad for the environment and lead to acid rain”
Again, what load of outdated moronic claptrap.
Modern coal fired power stations are very clean, all real pollutants are removed to small insignificant traces.
….. Leaving only CO2 , highly beneficial for all life on Earth, and H2O.
Your child-minded ignorance is bizarre to say the least.
The data is obvious that the last few year Greenland has been gaining mass.
Show us data for calving for the last few years , instead of that generic statement that has been on their site for 10-15 years, and is in fact totally baseless.
In any event, the mass changes in Greenland are totally meaningless because they are so small in either direction, and any losses are a RECOVERY from the HIGHEST AREA in 8000 years.
https://s19.postimg.org/ceo16fi7n/Greenland-_Ice-_Sheet-_Briner.jpg
You really have to get some actual REALITY into your brain-washed religion…..
….and realise that the Earth has just gone through a degree or so of HIGHLY BENEFICIAL WARMING out of the COLDEST PERIOD in 10000 years.
Hopefully there is a bit more warming to come, because the very last thing we need is for the temperatures to start dropping back down even slightly toward LIA levels.
https://www.nasa.gov/feature/goddard/nasa-study-mass-gains-of-antarctic-ice-sheet-greater-than-losses
Also, apart from volcanic activity, there is no reason for Antarctica to lose mass.
There has been no change in temperature over the whole satellite data period.
https://s19.postimg.org/84ben30o3/UAH_SoPol_All2.png
Now to Greenland
http://www.dmi.dk/en/groenland/maalinger/greenland-ice-sheet-surface-mass-budget/
In second link go to ACC SMB chart.. Lat year SMB was +550 GT
Now you say 200Gt calving, with zero evidence,
+550 – 200 = + 350Gt
Greenland has gained mass this yrea.
And you will see the average SMB was around +370
Well, +370 minus your mythical 20.. gives +170Gt on average
You completely ignore my previous response. That very article you hold so dear as your evidence states “Over the year, it snows more than it melts, but calving of icebergs also adds to the total mass budget of the ice sheet. Satellite observations over the last decade show that the ice sheet is not in balance. The calving loss is greater than the gain from surface mass balance, and Greenland is losing mass at about 200 Gt/yr.”
It does not take into account glacial calving. That is THE MAIN cause for mass loss.
I also responded to that other nasa article further up. Funny that you chose the same two sources as someone else (both of which I refuted earlier)
You completely ignored the fact that that statement is a generic statement with ZERO data to back it up. Its been there for several years.
You think there is data… bring it or STFU.
Then let’s look at what is really happening with ARctioc sea ice.
The late 1970’s was up there with the extreme extents of the LIA, as shown by the Icelandic sea ice index.
https://s19.postimg.org/bkgbf2prn/Icelandic_sea_ice_index_2.png
Thankfully there has been a slight but beneficial drop since the 1979 extreme. Travel, commerce, fishing etc.. for just a bit longer, and with marginally less need for massive ice-breakers.
Lets look at the Holocene Arctic sea ice extents
Many studies now show that for the first 7000-8000 years of the Holocene, Arctic sea ice was often “summer ice free” Around 3000 years ago, “Neoglaciation” started , and the world cooled , with a couple of bumps at the RWP and MWP, until it reached it COLDEST Period during the Little Ice Age
That LIA gave the world a taste of what a real ice age might be like, with the whole Arctic closely packed with sea ice for a large proportion of the year.
https://s19.postimg.org/vgdnb299v/Arctic-_Sea-_Ice-_Holocene-_Stein-17.jpg
https://s19.postimg.org/loqxfbppf/Holocene-_Sea-_Ice-_Greenland-_Sha-17.jpg
It is that HUGE EXTREME of Arctic sea ice that we have recovered slightly from. Nowhere near back DOWN to the MWP or RWP.
Unfortunately, the AMO seems to be turning, and it looks like that highly beneficial recovery from extreme Arctic sea ice has stalled.
Average sea ice has had a zero trend for over 10 year now, and all signs are that it will soon start to climb again, mores the pity for those living up there.
https://s19.postimg.org/90mpuhc37/MASIE_Growth.png
Honestly if all you can share with me are random jpgs, pngs and gifs without sources I can’t take any of your arguments seriously. Why don’t you reference actual scientific sources like I have.
That’s beside the fact that I said sea ice wasn’t really of my concern that much in comparison to land ice.
Sorry you are TOO DUMB to interpret basic graphs..
You are the one that needs to fix that problem.
You are a JOKE.
you have posted 2 nonsense irrelevant links.
NADA, NOTHING..
You are EMPTY.
“Coal plants aren’t bad just because of CO2 emissions…
CO2 emissions aren’t bad at all.
I LOVE Co2. It is a harmless gas, that is not only beneficial – it is NECESSARY to life on this planet.
STOP LYING about CO2 and claiming it is bad!
Ok well even if CO2 isn’t bad coal pollutants are. That was the whole point of that statement of mine. Claiming CO2 was bad wasn’t the intent of that statement, though it is in other parts of this comment section if you would like to reply there.
“bad coal pollutants are. ”
Modern coal power stations control real pollutants to a very low level.
Unlike the manufacture of magnets for wind turbines and the toxic chemicals of solar panels.
“Ok well even if CO2 isn’t bad …. Claiming CO2 was bad wasn’t the intent of that statement, though it is in other parts of this comment section if you would like to reply there.”
I like replying right here, where you posited that LIE.
You’re still hedging that it *may* be bad. Please produce “the science” that it is. Or stop with that anti-science LIE.
” The Truth?” Pfft.
I think China as a whole can serve as evidence for me that burning coal like that is terrible.
Basically NONE of China’s actual pollution comes from modern coal fired power plants.
But let your IGNORANCE run free.. It all you have.
Pockets of EXTREME pollution where China are making hugh rare earth magnets for wind turbines though.
http://www.digitaljournal.com/news/environment/baotou-a-toxic-lake-created-because-of-a-thirst-for-technology/article/430511
If it weren’t for the massive push for useless, unreliable wind turbines, this could have been controlled.
But if we look at the much more significant land ice, we see that glaciers all around the world have been dramatically decreasing.
Not anywhere near as dramatically as they have in the past, when humans were not appreciably adding CO2 to the atmopsphere, and the sky is not falling. That is The Truth.
It is not necessarily the rate of gain/loss at the moment, but how that rate is changing; we’re losing more and more every year.
As in the second derivative of the change in ice mass.
… we’re losing more and more every year.
It’s called an “interglacial”, and that’s The Truth.
Ok so explain to me how the temperature rises over two degrees celsius in the past century when that rate of change has never occurred in the history of this planet in such a small amount of time before without an equally drastic non-human cause (ie meteor strike). An “interglacial” has never occurred so quickly before and so it is simply not one.
You need a different handle if you are going to just make stuff up.
I will explain it to you in very simple terms even you ought to be able to comprehend: You do not know what the hell you are talking about!
Oh my goodness, bless your heart. A Holocene denier.
As I said to you before, menicholas, before you keep telling me I’m making stuff up and pulling facts out of my ass why don’t you take a look at the multiple reputable sources I’ve cited and then have the guts to make your own argument with actual evidence instead of calling me misinformed. I mean, come on! You’re not even actually considering my arguments for the facts that I put out! I am honored to have a discussion with people like RAH who actually come up with some facts instead of using pitiful ad hominem!
You are late to the party child.
No one here is going to rehash conversations that have been ongoing for many years, here and elsewhere, because you show up one night and want to start over at the beginning.
The end of the world is cancelled, that is all you need to know.
You can safely get back to your video games now.
Ok so explain to me how the temperature rises over two degrees celsius in the past century when that rate of change has never occurred in the history of this planet in such a small amount of time before without an equally drastic non-human cause (ie meteor strike). An “interglacial” has never occurred so quickly before and so it is simply not one.
What planet are you broadcasting from?
They washed his feeble mind with a high pressure hose.
NOTHING left, but green MUSH !!
More ad hominem…
An “interglacial” has never occurred so quickly before and so it is simply not one.
See those peaks, they are called an ‘interglacial’.
BTW, the last one, our current ‘interglacial’ has the lowest temperature, yet has the highest CO2 levels.
Please explain???
“More ad hominem…”
And ZERO science from you.
Stop whimpering like a childish little petal !!
“we’re losing more and more every year.”
What a load of RUBBISH !!
Ok then show me your evidence on how Greenland ice is showing gains, so that I can point out to you that that very same article you keep referencing actual admits that there is a net loss…
The SMB shows gains.
Now you produce DATA that shows losses.
and I don’t mean some generic statement that has been on the DMI site for many years.
And stop IGNORING the FACT that Greenland ice area is only just a small amount down from its greatest extent in 8000 years
You have to overcome your green sludge brainwashing and look at actual FACTS for a change.
https://s19.postimg.org/ceo16fi7n/Greenland-_Ice-_Sheet-_Briner.jpg
I don’t think you understand that it doesn’t matter what comparative levels the Greenland glaciers are at as of the moment… regardless of what levels they are at, we’re losing them! I used your own article to prove that. The SMB is positive in many areas, but that’s in the center, the source of glaciers. Your source does not take into account glacial calving and it admits that in a footnote you don’t seem to acknowledge me pointing out for the fourth time where it acknowledges a net loss of 200Gt/yr. When this danish article, the Goddard nasa article and thousands of others reference that same number I don’t think it’s a question that that’s a general truth.
Again, little LIAR..
Produce DATA for calving..
..or you could just blindingly accept a generic unsupported statement from 10 or more years ago.
“The Truth” claims Greenland is losing 200gt/year. Let’s say we accepted this figure just for the sake of argument. Please calculate how many years at that rate it would take for Greenland to lose even just one half of its ice sheet? I am confident that you will find that even if that rate of loss were true, it is truly nothing to be alarmed about.
Here is a graph of Total Greenland Ice Mass since 1900.
If The LIAR thinks it is wrong he should come up with his won graph of Total Greenland Ice mass with a zeroed vertical axis
Ball is in your court LIAR, put up or shut up.
“It is not necessarily the rate of gain/loss at the moment, but how that rate is changing; we’re losing more and more every year.”
Again, What a load of brain-washed propaganda RUBBISH
Antarctic ice, not going anywhere.
Greenland ice is close to it maximum in 8000 years.
Arctic sea ice is in the top 10% of extents of the last 10,000 years, Only time it has been higher is in the start and tale of the Little Ice Age.
If you think we should still be in the LIA, then get out of your inner city ghetto, built and powered by fossil fuel… and move to Siberia..
It is very apparent that you don’t have the slight clue of the actual TRUTH, and are just regurgitating propaganda LIES..
There hasn’t been a single scientific source you’ve referenced whatsoever for your claims. Please stop repeating the same baseless facts unless you have a source to back them up. And not another png, jpg or gif, please, a real science report.
If you can’t keep up with science.. don’t blame us
You are the one regurgitating bogus facts.
I’m, sorry you are INCAPABLE of understand basic graphs, maybe a third stint in junior high will cure that… or not.
Every one of those statements above are KNOWN facts from published papers.
I’m not about to do you homework for you.
Take you blinkers off and go and do some proper research instead of relying on AGW propaganda site for your lack of knowledge.
” we see that glaciers all around the world have been dramatically decreasing.”
Again the ignorance, most glaciers actually FORMED during the cooling towards the Little Ice Age.. Many current glaciers did not exist during the first 7000-8000 years of the Holocene
These glaciers have been retreating on and off as the Earth continues its slow climb out of that coldest period in 10,000 years
There is absolutely NO sign of any human effect in glacial melting
Swiss glaciers come and go with the AMO.
https://s19.postimg.org/xxtc8onhv/swiss_glaciers.png
As do Glaciers in the north of the USA
https://s19.postimg.org/j23ct07zn/mt_baker.png
There are many reports of glacial melting way before the beneficial CO2 rise that allows the world to feed itself (and which doesn’t cause any warming anyway)
https://realclimatescience.com/glacial-retreat-before-1950/
Try not to remain blinkered , naïve and very IGNORANT all your life..
You need to grow up at some stage.
Your graphs have no sources. Big “Nono”. Before I got upset at you sending me the pngs and not the articles. But now those pngs dont even have citations on them… super low quality too…
and “Swiss glaciers” and the single glacier you referenced on some mt baker are nowhere near as significant as Greenland as a whole.
Yawn
You have NOTHING, petal.
Just start doing your own research, NOT on SkS, and eventually you might catch up.. in about 10-15 years.
Also, where is Mr Truths evidence that polar seas are less salty?
I added an article in one of my earlier replies about that which was not uploaded at the time you wrote that comment.
You see, David, The Truth uploaded an article but the article didn’t upload. You better believe it because it’s The Truth.
I was referring to my other reply in which I cited this article:
“https://www.nature.com/articles/nature19101”.
The article is paywalled.
It is a year old, and uses models and some observations to speculate about a trend during the period that ended in 2008.
It is meaningless.
Speculations about deceases in salinity due to melting sea ice in the southern ocean says nothing about the salinity of the Arctic ocean.
Guess what?
Sea ice comes and goes.
Always has, always will.
If you want to frighten yourself because some guys that get paid to write stuff made some speculations, have at it.
Unfortunately, the article is paywalled. But the abstract isn’t. If you really would like me to find another article without one I don’t think it would take much time.
“Nature” did not pay anyone to write that. Independent scientists write their work beforehand and then choose to submit it to a number of journals, nature being the one in this case. If you want to discredit the reputability of one of the most renowned journals on this planet, go ahead.
They have already discredited themselves by their manic support of the AGW scam.
You have a twisted reply for everything… it honestly astonished me.
Your ignorance astonishes me.
Please repeat junior high……. you are an embarrassment to education.
Half of your pngs you use as proof cite articles in the nature journal
The host of this site has an extensive archive of similar stories about supposedly disastrous changes in sea ice going back well over 150 years!
I advise you to read them, so that you can see that making observations, calling them alarming, and then claiming disaster is imminent is the only thing these guys have ever known how to do.
The truth is that every bit of melting ice is great news…frozen polar wastelands are an ecological catastrophe for life.
The more ice that melts and the more CO2 there is in the air, the better it is for every living thing on Earth.
Frozen polar wastelands aren’t wastelands. Life finds its ways to adapt to the craziest of situations, and any NatGeo documentary will show you that. In fact, life in crazy wastelands is more important than those in other areas, because they’ve adapted to extreme situations that we have not. Those are the life forms capable of surviving on other planets. Genetic diversity is inarguably beneficial as a whole and destroying the habitats that facilitate it is not good…
More CO2 in the atmosphere generally wouldn’t make a difference —– IF it occurred gradually over millennia, allowing time for organisms to adapt. Unfortunately, it’s happening too quickly for many organisms. I wasn’t intending on discussing the coral reefs as I replied to RAH, but I think it’s appropriate here. Whether or not the reefs are recovering as of the moment, there’s no denying that they have been significantly damaged as a result of CO2 bleaching.
It is not better for the world at all..
“been significantly damaged as a result of CO2 bleaching.”
Again, the IGNORANCE oozes from you.
Bleaching is a regular occurrence on many reefs.
Has been and will continue to be
The last one had absolutely NOTHING to do with CO2.
“Unfortunately, it’s happening too quickly for many organisms.”
More baseless anti-science BS.
Do you want to give me an article saying that bleaches are a regular occurrence? I’ll give you one saying they’re not and that they’re caused by global warming. Do you want to find an article telling me CO2 levels aren’t changing too fast for many ecosystems around this planet? I’ll find you one that does.
FFS, why do I have to fill in the ENORMOUS gaps in you basic knowledge.
Go and do some research , fool !
And not one of your articles will be based on facts….. just assumption driven models.
CO2 has been dangerously LOW for many thousands of years.
Be very thankful that there is now at least some small amount of usable CO2 for plant life to feed the world’s population.
And how do you know that CO2 levels have been dangerously low for many thousands of year? From one of those “assumption driven” models?
You really don’t know what caused most of the GR bleaching do you.. !!
Some quick points in a vain attempt to fix your ignorance
1. because of El Nino, sea water was warm and slow moving, with few nutrients
2. sea level also dropped meaning that the coral was exposed to shallow water sunlight for a lot longer than normal.
Combined effect was bleaching on corals near the surface, but not at greater depths.
Those areas have recovered extremely quickly, like they always do.
Fix your knowledge gap…. its HUGE.
Get some wood putty or something !!
“And how do you know that CO2 levels have been dangerously low for many thousands of year?”
OMG.. STOP displaying your ignorance about basically EVERYTHING.
Base level for plant growth is about 250 for C3 and 200 for C4 plants
Levels have been below that for a long time.
Whatever is causing the HIGHLY BENEFICIAL atmospheric CO2 enhancement, it is what is feeding the world.
And with 1600 or so new coal fired power plants being built around the world, THANKFULLY, the level of atmospheric CO2 should continue to climb for several decades at least.
http://www.pnas.org/content/102/3/690.full
I did not question the validity of the fact that CO2 levels have been low. I was questioning your source as being from the same models you discredit me for using to explain to you that the current growth in temperature is unprecedented. Coral bleaching is as a result of increased water acidity as a result of increased CO2 in the atmosphere and thus the water. I really don’t know how you keep coming up with all of these crazy narratives without scientific evidence to support it…….
The CO2 starvation of select prehistoric species of trees in California does not support your argument that every planet and ecosystem on this earth is starved of CO2
Again displaying your absolute NIL-education about basic plant growth and CO2 requirements
You are seriously a low-end embarrassment as an AGW troll.
“Coral bleaching is as a result of increased water acidity as a result of increased CO2 in the atmosphere and thus the water”
You really are a GULLIBLE moron aren’t you.
You would believe any anti-science propaganda that they feed you. That is because you haven’t even the most basic understanding of any part of science, biology, chemistry or ANYTHING.
“current growth in temperature is unprecedented”
Another piece of fabricated idiocy.
There is NO warming in the satellite record except from El Nino events
They are driven by built up solar energy..
NOTHING to do with human anything
Your LIES and baseless PROPAGANDA regurgitation are an embarrassment to even your limited intelligence.
“I did not question the validity of the fact that CO2 levels have been low”
Now you are just a LIAR.
you wrote
“And how do you know that CO2 levels have been dangerously low for many thousands of year”
You are a LIAR even about what you yourself wrote…. PATHETIC !!
The Truth
Concerning Arctic Ice
A Shrinking Anthropogenic Signal
Continues To Emerge In The Arctic
http://notrickszone.com/2017/11/30/2-more-new-papers-affirm-there-is-more-arctic-ice-coverage-today-than-during-the-1400s/
According to the article which cites a scientist:
“Internal variability dominates the Arctic summer circulation trend and may be responsible for about 30–50% of the overall decline in September sea ice since 1979.”
30-50% isn’t all of the change… 50-70% is left unaccounted for and that is significant.
Another study referenced in that article:
“The study region, the Chukchi Sea, was deemed representative of most of the Arctic, as the authors asserted that…”
The article states that the study was relying on a small portion of the arctic in their model, which substantiates the claim that ice levels have been pretty normal. If you average this model with all of the other ones though, the story is quite different –
https://www.skepticalscience.com/past-Arctic-sea-ice-extent.htm
“Perhaps the authoritative paper on Arctic sea ice extent over the past 1,450 years is Kinnard et al. (2011), which used a combination of Arctic ice core, tree ring, and lake sediment data to reconstruct past Arctic conditions.”
Given a local time of 11, I have limited time, but there are more models on that site which say the same thing and even compile multiple models into one.
And which consider a longer period of time than 1450 years.
If you keep getting JUNK from SkS no wonder you have nothing but base-level propaganda to put forward.
They use erroneous tree rings to create an erroneous temperature series, (ala Mann), then use it to lie about Arctic sea ice. Then they do the total mathematical idiocy of splicing faked NASA data onto a fabricated
And scientifically illiterate fools like you are GULLIBLE enough to fall for it.
Let me guess, you have never done any reasonable level of science or maths , have you.
There are many studies that show that sea ice extent during the first 7000 years of the Holocene were often summer ice free, and then a period called Neoglaciation leading to the extreme high sea ice levels of the LIA.
Those same reports , based on real ocean proxies, have been summarised in this graph from Stein 2017
See if you can read a basic graph this time,.
https://s19.postimg.org/vgdnb299v/Arctic-_Sea-_Ice-_Holocene-_Stein-17.jpg
Also from Sha 2017
https://s19.postimg.org/loqxfbppf/Holocene-Sea-Ice-Greenland-Sha-17.jpg
Stop sending me bogus graphs. I checked your graph on the Greenland ice sheets and it was found nowhere in the paper it referenced and did not match at all what that particular article said. Give me the papers themselves instead of random jpgs please.
Poor little petal is unable to do basic research
And unable to read simple graphs.. Oh Dear.
Failed maths and science at high school did you.?
You want bogus.. go to SkS.
and stop sprouting your moronic nonsense here.
“which used a combination of Arctic ice core, tree ring, and lake sediment data ”
Tree rings for Arctic sea ice.. really ?
Lake sediment, for Arctic sea ice… roflmao?
Do you even bother to engage your feeble brain before typing !!!
That was the source of just one of many of the other studies on that site. What authority do you have in saying that lake sediment, tree rings and sea ice samples aren’t good sources of information?
WOW.. if you think tree rings and lake sediments are good proxies for Arctic sea ice, you are even more of an IDIOTIC FOOL than even I thought you were.
The Truth
Concerning Snow Cover in the Northern Hemisphere:
“Northern Hemisphere snow and ice cover for the month of October finished 20% above the mean. In fact the mean of the past 5 years for October has been the highest for any 5-year period since measurements began 50 years ago.”
https://www.ncdc.noaa.gov/snow-and-ice/extent/snow-cover/nhland/10
Change that plot to “all months” from just October and the trend line is downwards, especially drastic the summer months.
“Drastic summer months”? ???
I don’t give a damn how you change the graph it will show more snow cover in the NH. It’s up to you to produce your graphs and not me to produce them for you.
Just like it is up to alarmists to provide the UNADJUSTED field observations to support their hypothesis. Catastrophic global warming is an extraordinary claim which runs counter to all prior data. Never ever before in the paleo record or modern records can it shown that increasing CO2 reaches a “tipping point” where by climate feedbacks run wild causing super warming. NOWHERE!
Extraordinary claims require extraordinary evidence and models are NOT evidence. Nor is a consensus evidence. Papers from scientists lacking verifiable field data or reproducible experimental results are not evidence.
You, ‘The Truth” would do well to learn about the history of science and the development of the scientific method and then start making your judgments based on what falls within the bounds of the process and disregarding the rest as the politically and financially agenda driven crap it is.
Here is your first lesson:
Ibn al-Haytham is recognized as probably being the earliest father of the modern scientific method. You would do well to take his advise:
Ibn al-Haytham > Quotes
Ibn al-Haytham quotes (showing 1-1 of 1)
“The seeker after truth is not one who studies the writings of the ancients and, following his natural disposition, puts his trust in them,” the first scientist wrote, “but rather the one who suspects his faith in them and questions what he gathers from them, the one who submits to argument and demonstration and not the sayings of human beings whose nature is fraught with all kinds of imperfection and deficiency. Thus the duty of the man who investigates the writings of scientists, if learning the truth is his goal, is to make himself an enemy of all that he reads, and, applying his mind to the core and margins of of its content, attack it from every side. he should also suspect himself as he performs his critical examination of it, so that he may avoid falling into either prejudice or leniency.”
― Ibn al-Haytham
Another founder of the Scientific Method had this to say about proper scientific inquiry…
Before we come to class and Range the Sciences, ’tis proper we should sift the merits of Knowledge, or clear it of the Disgrace brought upon it by Ignorance, wether disguised as (1.) the Zeal of the Divines, (2.) the Arrogance of Politicians, or (3.) the Errors of Men of Letters.
-Sir Francis Bacon, “Advancement of Learning”, 1605 (Father of the Scientific Method)
Skepticism is the foundation of science, anything else is simply a belief system akin to religion.
I totally agree with you. Skepticism is the foundation of science. It is necessary that people like you exist out you. I’m just having a good discussion about the issue on hand.
I’m just having a good discussion about the issue on hand.
No, you are parroting nonsense.
Thank you for the history lesson. There were good points in it.
But they were largely irrelevant.
Your only rebuttal to me was
“I don’t give a damn how you change the graph it will show more snow cover in the NH. It’s up to you to produce your graphs and not me to produce them for you.”
Explain to me how looking at just the snow cover in October is more accurate than that of the whole year from the same data set. I did produce my graphs. I told you to set the month to “all” from “October”, the setting which you sent me. It’s the same exact site and data.
Oh well. I tried. Time to move on to other things involving people that can actually open their mind since we are getting nowhere.
Years ago I was a ski instructor in the US Army. I found there were two ways that novices learned.
The quick learners listened to the instructor and observed and soon were staying up over their skies and advancing. The slow learners continued to lean back and fall on the butts. Some time during the third day the slow learners, their butts so bruised they didn’t want to fall on them anymore, started to learn. It is unfortunate that there isn’t some form of reinforcement of that nature for the slow learners when it comes to this issue and the science involved.
I’m still waiting for you to produce the graph.
Our ski club, when I lived in Germany, was called the Sitzmarkers.
Needs a “H” in it :-)
No “H”, our skidmarks were clean. :-)
Yeah .. and your SITZ smells like roses. :-)
Well, they were planted.
Concerning Calving.
Calving increases as more snow and ice is added to an elevated ice sheet. It is nothing more than glaciers advancing into a terminus at the shore of a body of water. The more snow and ice that is added at the peak, the more calving there will be eventually. But it takes time. It can take years and sometimes decades for new fallen snow to change to névé, then to firn, then to solid ice. The more snow added on top of a the strata the faster the process will occur due to the pressure of the ice from above.
Calving is more active when mass has been added to an ice sheet as snow that then turns to ice because that mass of ice causes the glacier to advance quicker. But that takes time and is effected by many variables. A flake of snow at the apex does not instantly result in an equal advance or loss at the terminus. But the point is that calving is a natural process and increases in calving are NOT an indication of warming. And that mass gained at near record levels, as in Greenland for the last couple years, will not instantly result in more calving and thus the ice sheet gains mass.
I agree with your analysis, but that simply cannot be the whole explanation the magnitude of loss that’s been observed over the past few decades. There’s no particular formula or study to go on with what you’ve said, but although it is plausible that that is a factor, it isn’t enough to explain how much ice we’ve been losing. When the overall mass has been decreasing for a few decades while the calving rate has also been increasing, your theory can only be a small part of that explanation.
” while the calving rate has also been increasing”
Unproven nonsense, yet again
Stop making CRAP up.
It was literally in that same Greenland article you keep sending me for your proof, and in thousands of other articles and studies if you want to look them up.
LOL,
still zero.. EMPTY
You poor petal !!
You won’t even read your own article…
You poor petal
I have read it many time
Sorry you don’t comprehend it.
It’s literally written in the article. Ctrl F the sentence I keep sending you for once and actually read your sources…
You are NOT listening.
It is a generic statement that has been there of ages. It has no actual data anywhere to back it
It seems that actual data is an enema to you.
If “The Truth” actually paid attention to the data and then disregarded conclusions or statements unsubstantiated or supported by any applicable data then the viel would be lifted from his/her eyes. But as we can see, he/values mere words to counter the data he has been provided.
What I told you, for the 10th time, was that your article acknowledges that the gains it presents do not represent the net change in ice in Greenland because the study did not take into account any calving.
Here is a compilation of 20 studies that show just how fast the ice is melting.
https://www.skepticalscience.com/greenland-cooling-gaining-ice.htm
Sks is a propaganda site.
You will remain IGNORANT while you look there.
Why are you quote stuff from 10 years ago ?
Are you just DUMB???
You do realise that every time you cite SkS you are proving yourself to be NOTHING but an brain-washed, NON-thinking, mindless parrot, don’t you !
And a new paper again shows the general downward temperature trend of Greenland for 7000 or so years, with current temperature LOWER than what they were for most of the mid Holocene. Matches well with the Briner charts showing Greenland Ice Extent is just marginally down from it highest in 8000 years.
https://s19.postimg.org/o74crkzs3/Greenland_Kobashi_2017.png
https://s19.postimg.org/ceo16fi7n/Greenland-_Ice-_Sheet-_Briner.jpg
Also agrees with the GISP data showing current temperature in Greenland is only somewhat above the COLDEST point in 1000 years
https://s19.postimg.org/juac2rmk3/holocene.png
Then we have the Greenland temperatures December temperatures since 1900, showing the strong link to the AMO.
https://s19.postimg.org/jftrrchtf/Greenland_Dec_temps.png
That AMO is just starting to head back down, so we can expect Arctic sea ice to start expanding over the next several years.
Your first graph points to this:
“Volcanic influence on centennial to millennial Holocene Greenland temperature change”
https://www.nature.com/articles/s41598-017-01451-7
From, you guessed it, the “paywall” science journal that pays its scientists to spout crap about global warming…
This also shows how your sources are not related to the topic at hand… the article analyzes volcanic influences on temperature and the graph you gave me construes that to something else altogether….
The Briner graph you keep showing me:
http://citeseerx.ist.psu.edu/viewdoc/download?doi=10.1.1.717.2707&rep=rep1&type=pdf
has a few paragraph or two before the header of the conclusion. There you’ll see he says himself that the reason glaciers were sustained so well during warm periods in the past was because of 200% precipitation or more compared to today. That moisture is gone and the temperature IS increasing according to other non-bogus models not about volcanic temperatures. So there is less moisture and more warmth…
I’m too tired to deal with the rest of your graphs today. Maybe tomorrow. Stop sending them to me, you’re making me work harder but embarrassing yourself.
PATHETIC
You are an embarrassment even to AGW trolls. !
Wrong paper, but I suggest you look at Figure 6 Jacobshavn Isfjord temperature.
Here I’ve extracted it for you so you and everyone else can see that current temperature is only just above the COLDEST in 10,000 years.
Thanks for the help, bozo. !!
It’s not the wrong paper unless you want to give me the link to the right one; still no links to actual papers. Thanks for extracting a graph about the “Jacobshavn Isfjord temperature” and not Greenland temperatures as a whole. Your other graph showcasing colder temperatures in Greenland is only for the month of December, let alone the fact that we don’t have any citation. Get an ARTICLE for the summer month temperatures (or the year as a whole!) where the temperature fluctuations matter much more and actually increase melting rates.
You poor petal.
You really are battling against your crass inability to put together a rational argument supported by actual data.
Massive FAILURE so far. !
RAH, you know that rational explanations will not work on the average naïve, blinkered, anti-science AGW cultists.. and this guy is well below average.
So you’re saying that you’re not giving rational explanations? Wow that was kind of what I’ve been illustrating this entire time.. I’m attempting to use facts, and kind people like RAH actually give a crap about them and direct me to others. He gives me faith in the democratic system and human capacity for thought. You do not…
You wouldn’t recognise a rational science explanation if it was right in front of you.
You give us no reason to believe you are capable of understanding rational thought. or science.
The Truth
The scientific process demands that it be possible to falsify any hypothesis. Please tells us what would falsify the hypothesis of human caused climate change?
“The Truth” lives in a post-scientific world where they put the word interglacial in parentheses. They don’t have any such things there anymore. When “The Truth” says it ain’t so they are done with it. “The Truth” can falsify anything before you can say “Dummkopf”.
We have all seen enough leftist “Truthers” here to drive Pinocchio’s nose right through the thermosphere, and we all but a few perfectly understand the gross misnomer.
You are correct in that manner. Proof that climate change is not human caused would require evidence showing that increases in temperature are not as a result of CO2 increases and that those CO2 increases have not been coming from humans.
What sort of ANTI-science crap did you get taught?
There is no empirical proof that CO2 causes warming in our comnvective atmosphere.
There is NO CO2 warming signal in the whole satellite data period
There is NO CO2 warming signal in the steady linear rise of sea levels
There is NO CO2 warming signal anywhere.
Take you low-end social science understanding of climate elsewhere. !!
Please give me a study or some evidence I can actually consider. Studies are science, not repeated mantras (second time you said practically the same thing in this thread with no evidence).
You are the one claiming CO2 causes warming
You are welcome to produce a paper proving empirically that CO2 cause warming in our convective atmosphere.
The very basis for the whole anti-CO2 scam.
WAITING
I have shown you very clearly that there is NO WARMING in the satellite temperature data apart form El Nino events.
If you can’t work with basic data and facts, no-one can help you .
You are welcome to show me where the CO2 warming is in the satellite data sets. (do not use lines across El Ninos, that only proves my point)
or in the sea level change.. and don’t go splicing manipulated satellite sets onto tide data.. that will only prove you are a mathematical inebriate.
So far you are EMPTY !!!
Ok I will come up with something soon but I do have other work I need to attend to as of the moment.
ooooo.. scary !!!
Get an education first, putz. !!
You watch , the little petal will put forward the Marty Feldman paper.. So easy to rip apart. !
I’m still in school and I can write better than you…
EMPTY. !! and DUMB
“I’m still in school …”
Yes.. that is very evident.
Good luck passing science…..
…. because you haven’t got even the most basic understanding.
I’m the one that’s still furthering their education. I didn’t know the process of getting one was something to be ashamed of. And go ahead and rip apart the so-called “Marty Feldman” paper while I find 100s of others to take its place when your done with it. I ripped apart your articles and evidence (which you’ve been ignoring) with little replacement. None of my evidence has seen much of a rebuke.
EMPTY , yet again !!
“I ripped apart your articles and evidence :”
NOWHERE can your hallucination of this be seen.
You have not ripped apart a wet paper bag !!
You have made ZERO rational scientific argument.
You obviously have a fetid imagination.
” I’m the one that’s still furthering their education. I didn’t know the process of getting one was something to be ashamed of.”
Wow , full of yourself aren’t you.
What you should be ashamed of is for falling for the blatant propaganda pap from sites like SkS.
You obviously DO NOT have the scientific ability to tell the difference yet, so you should probably just shut up and learn instead of thinking you can argue coherently,. Learn to comprehend data when its put in front of you etc etc.
Your knowledge base is extraordinarily SMALL, and you need to take your brain-washed blinkers off and listen for a change.
You have a LONG way to go. !!!
“Proof that climate change is not human caused ”
You immediately PROVE that you have ZERO understanding of science.
The NULL hypothesis is that humans HAVE NOT contributed to so-called climate change.
Now, come up with empirical evidence to counter the null hypothesis, or remain for ever empty.
First step would be to list every single natural warming force..
and quantify them.
Come on little child-mind.. WAITING.
The FACT that all the current highly beneficial warming can be explained by solar and ocean effects, leaves you with pretty much NOTHING !!
https://s19.postimg.org/ccnf2bhk3/AMO_PDO.png
https://s19.postimg.org/wws90t50z/AMOSSI_etc.png
PS.. and let’s see some stuff you have understood by yourself,
NO MORE propaganda pap from SKS, which only highlights your ignorant gullibility.
“Proof that climate change is not human caused ”
“humans HAVE NOT contributed to so-called climate change.”
are close enough for a casual discussion. I don’t think that you criticizing my scientific ability is going to get you anywhere in the face of denying facts that your very own sources present against you.
You still have NOTHING except your mindless yapping.
You are EMPTY and keep showing your lack of scientific education.
“First step would be to list every single natural warming force..
and quantify them.”
Your avoidance of answering is noted by everyone
You are embarrassing yourself, just like all AGW trollups do.
The Truth
We have been told that warming will increase wildfires. We have been told we’re seeing that increase in the last few years. The record does not support that fantasy.
Mr “Truth” apparently cannot handle the truth.
No, to be more accurate, I never said a single thing about wildfires. I have no opinion on an increase in their intensity. That is actually something with little scientific evidence and I agree with you on that.
*frequency and intensity
Carbon dioxide extinguishers are used to snuff out Class B & C fires.
How about the CO2 alarmists’ claim of desertification?
How did that work out?
Substitute “claim” with ‘prediction.’
The one thing we can count on with climate alarmists’ predictions – they’re always wrong.
Just thinking while looking at the 2007 vs 2017 sea ice thickness gif. Just imagine that it were mirror opposite, and the press got hold of the graphic; yep – they’d all be drooling all over it (causing a flood – a man-made flood, mind you).
I think The Truth is one of them robosexuals
North Atlantic heat content dropping rapidly
https://s19.postimg.org/us7vztyab/North-_Atlantic-_OHC-_Duchez-16.jpg
Let’s take the ocean as a whole instead of just the North Atlantic.
https://www.climate.gov/news-features/understanding-climate/climate-change-ocean-heat-content
It’s global warming not Atlantic warming. Some places increase, some decrease. But the greater trend is a major increase.
And that site’s references (aside from the fact that its a government site) are the following:
G. C. Johnson, J. M. Lyman, J. Antonov, N. Bindoff, T. Boyer, C. M. Domingues, S. A. Good, M. Ishii, and J. K. Willis, 2015: [Global Oceans] Ocean Heat Content [in “State of the Climate in 2014”]. Bulletin of the American Meteorological Society (BAMS), 96 (7), S64-S66.
Rhein, M., S. R. Rintoul, S. Aoki, E. Campos, D. Chambers, R. A. Feely, S. Gulev, G. C. Johnson, S. A. Josey, A. Kostianoy, C. Mauritzen, D. Roemmich, L. D. Talley, and F. Wang,2013: Observations: Ocean. In: Climate Change 2013: The Physical Science Basis. Contribution of Working Group I to the Fifth Assessment Report of the Intergovernmental Panel on Climate Change [Stocker, T. F., D. Qin, G.-K. Plattner, M. Tignor, S. K. Allen, J. Boschung, A. Nauels, Y. Xia, V. Bex and P. M. Midgley (eds.)]. Cambridge University Press, Cambridge, United Kingdom and New York, NY, USA, doi:10.1017/CBO9781107415324.010.
S. Levitus, J. I. Antonov, T. P. Boyer, R. A. Locarnini, H. E. Garcia, and A. V. Mishonov. 2009. “Global ocean heat content 1955–2008 in light of recently revealed instrumentation problems” Geophysical Research Letters, 36, L07608, doi:10.1029/2008GL037155.
T. P. Boyer, J. I. Antonov , O. K. Baranova, H. E. Garcia, D. R. Johnson, R. A. Locarnini, A. V. Mishonov, T. D. O’Brien, D. Seidov, I. V. Smolyar, M. M. Zweng, 2009. World Ocean Database 2009. S. Levitus, Ed., NOAA Atlas NESDIS 66, U.S. Gov. Printing Office, Wash., D.C., 216 pp., DVDs.
Names and papers, not gifs, pngs or jpg…
Show us where OHC was measured before 2003.
These are model based.
Yes there has been some HIGHLY BENEFICIAL NATURAL warming out of the LIA, the COLDEST period in 10,000 years.
It started in about 1850, and warmed until 1940.. NOT CO2.. then it cooled to 1979, then warmed back up to 1940’s levels
Again, NOTHING to do with anything to do with human anything.
And copying lists of peoples names, is NOT science.
I bet you have never read anything except the heading.
Ok do you want to give me an article that tells me
“Yes there has been some HIGHLY BENEFICIAL NATURAL warming out of the LIA, the COLDEST period in 10,000 years.
It started in about 1850, and warmed until 1940.. NOT CO2.. then it cooled to 1979, then warmed back up to 1940’s levels”
instead of repeating what I cannot take for truth without evidence? I swear to god if you send me another png..
NOTHING to back up your IGNORANCE.
Go and to your OWN REASEARCH, ignorant little troll.
Southern Ocean cooling
And I bet you don’t know how little temperature it represents.
Again.. show us where OHC was measured before 2003.
You can’t and neither can anyone else…
Here comes another png file without its parent article. Once again, the southern ocean is not the whole ocean (and to be quite frank nowhere near).
You are EMPTY, STILL
Nothing but mindless ranting.
Strong La Nina forming.
https://s19.postimg.org/uxogo4epf/LaNina_Forming.png
image test
Ok. Great. Connect that to some sort of argument now with a scientific source.
Do some research of your own, petal.
I have and I’ve given you well-structured arguments with citations instead of random graphs and pngs.
Still ABSOLUTELY NOTHING
The LIE said: “I’ve given you well-structured arguments with citations instead of random graphs and pngs”
That is meaningless. Propagandists often have well-structured arguments with citations.
You claimed this interglacial is inexplicable by natural forcing, and that there’s never been one like this before. Vostok ice cores tell us that’s true, but it’s the OPPOSITE of your propaganda.
They tell us this interglacial is the coolest in the past 425,000 years. http://www.climate4you.com/images/VostokTemp0-420000%20BP.gif
(Present is at the bottom right corner of the red rectangular box on the right. That is NOT a random graph – those are the data.)
I don’t recall any data from you debunking this known science – well structured or otherwise.
You’re a train wreck.
A good example of how “The Truth” has been deceived.
They have adjusted the surface temperature record to the point where it is gibberish.
They have started adjusting the radiosonde data to try and make it agree more closely with the surface temperature record instead of it’s close agreement with the satellite temperature record which is so damaging to their warming claims.
Now they are adjusting the historical and current raw data records of tide gauges to try and make them agree more closely with their fantasy satellite “data”.
‘Adjustments’ To Create Spurious Sea Level Rise
Have Now Infected The PSMSL Tide Gauge Data
http://notrickszone.com/2017/12/04/whistleblower-scientists-psmsl-data-adjusters-are-manufacturing-sea-level-rise-where-none-exists/#sthash.bhmiHw5b.dpbs
Without fudged numbers and confirmation biased models, there would be no climate change alarm.
The fudged numbers of 100000s of scientists in agreement who are required to check over their work and reinvent models over and over again…
“100000s of scientists in agreement ”
BULLSHIT !!
Go and look up what a monumental FARCE of anti-science the 97% mantra is.
Its JOKE.
Just like you are !!
The fudged numbers of 100000s of scientists …
Your ridiculous claim requires a list of personnel.
Hundreds of thousands of scientists?
What a moron.
Fudged numbers.
The Truth just verified my earlier statement…
Without fudged numbers and confirmation biased models, there would be no climate change alarm.
In answer to this, TT reached around and dug numbers out of his arse in order to try and support his world view. This is exactly what I accused alarmists of doing, it is exactly what they do, and it was immediately demonstrated by TT.
And TT did not even realize he was doing it. These chicken littles are so brainwashed that even when they make up a new lie, all on their own, they still do not see it. It is a learned behavior, something they pick up from their deviant “role models”.
The Truth wouldn’t know the truth, or an interglacial, even if it calved a Manhattan sized glacier on his polluted head.
You do know that word “consensus” has NO MEANING is real science, don’t you.
You are NOTHING but an arrogant, brain-washed, little twerp. !!
Here you go “The Truth”
Here is your catastrophic warming which according to UAH is “Global climate trend since Nov. 16, 1978: +0.13 C per decade” :
“Global Temperature Report: November 2017”
https://wattsupwiththat.com/2017/12/04/global-temperature-report-november-2017/
“Conclusions
[excerpt]
The assessment of tropospheric climate sensitivity from the
calculation of the underlying trend above requires significant
assumptions. If we assume, among other things, that the
impact of the net of natural external and internal forcing
variations has not influenced the observed trend and that
anthropogenic forcing as depicted in the average of the IPCC
AR5 models is similar to that experienced by the Earth, then
observations suggest the tropospheric transient climate response
(TTCR) is 1.10 ± 0.26 K. This central estimate is likely less
than half that of the average of the 102 simulations of the
CMIP-5 RCP4.5 model runs also examined here (2.31 ± 0.20).”
Pay close attention to the last sentence there.
Another fact is that this limited warming is concentrated mostly as the poles during their winter months.