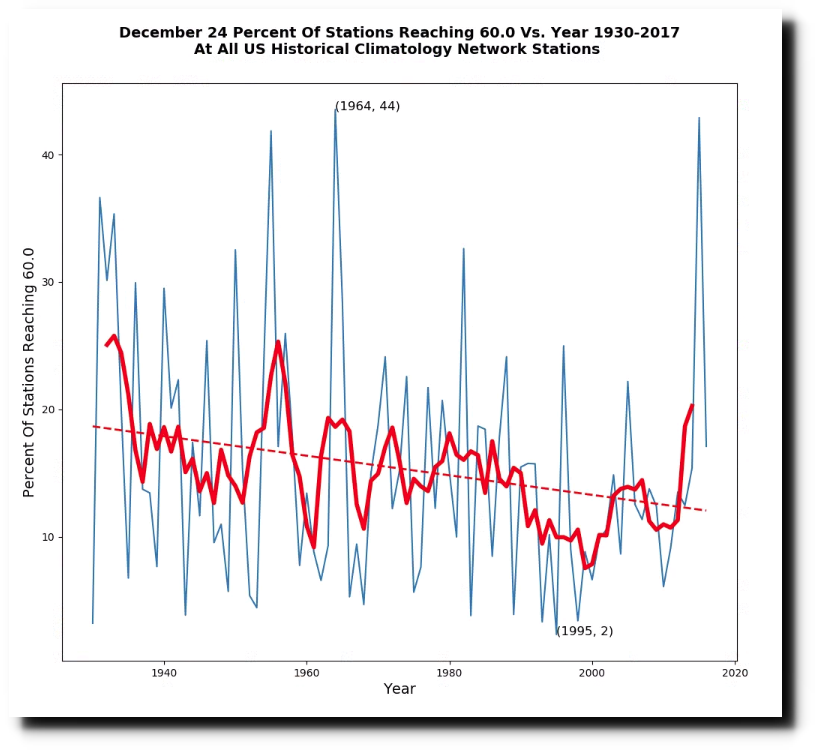
Christmas Eve temperatures have plummeted in the US since the 1920’s.
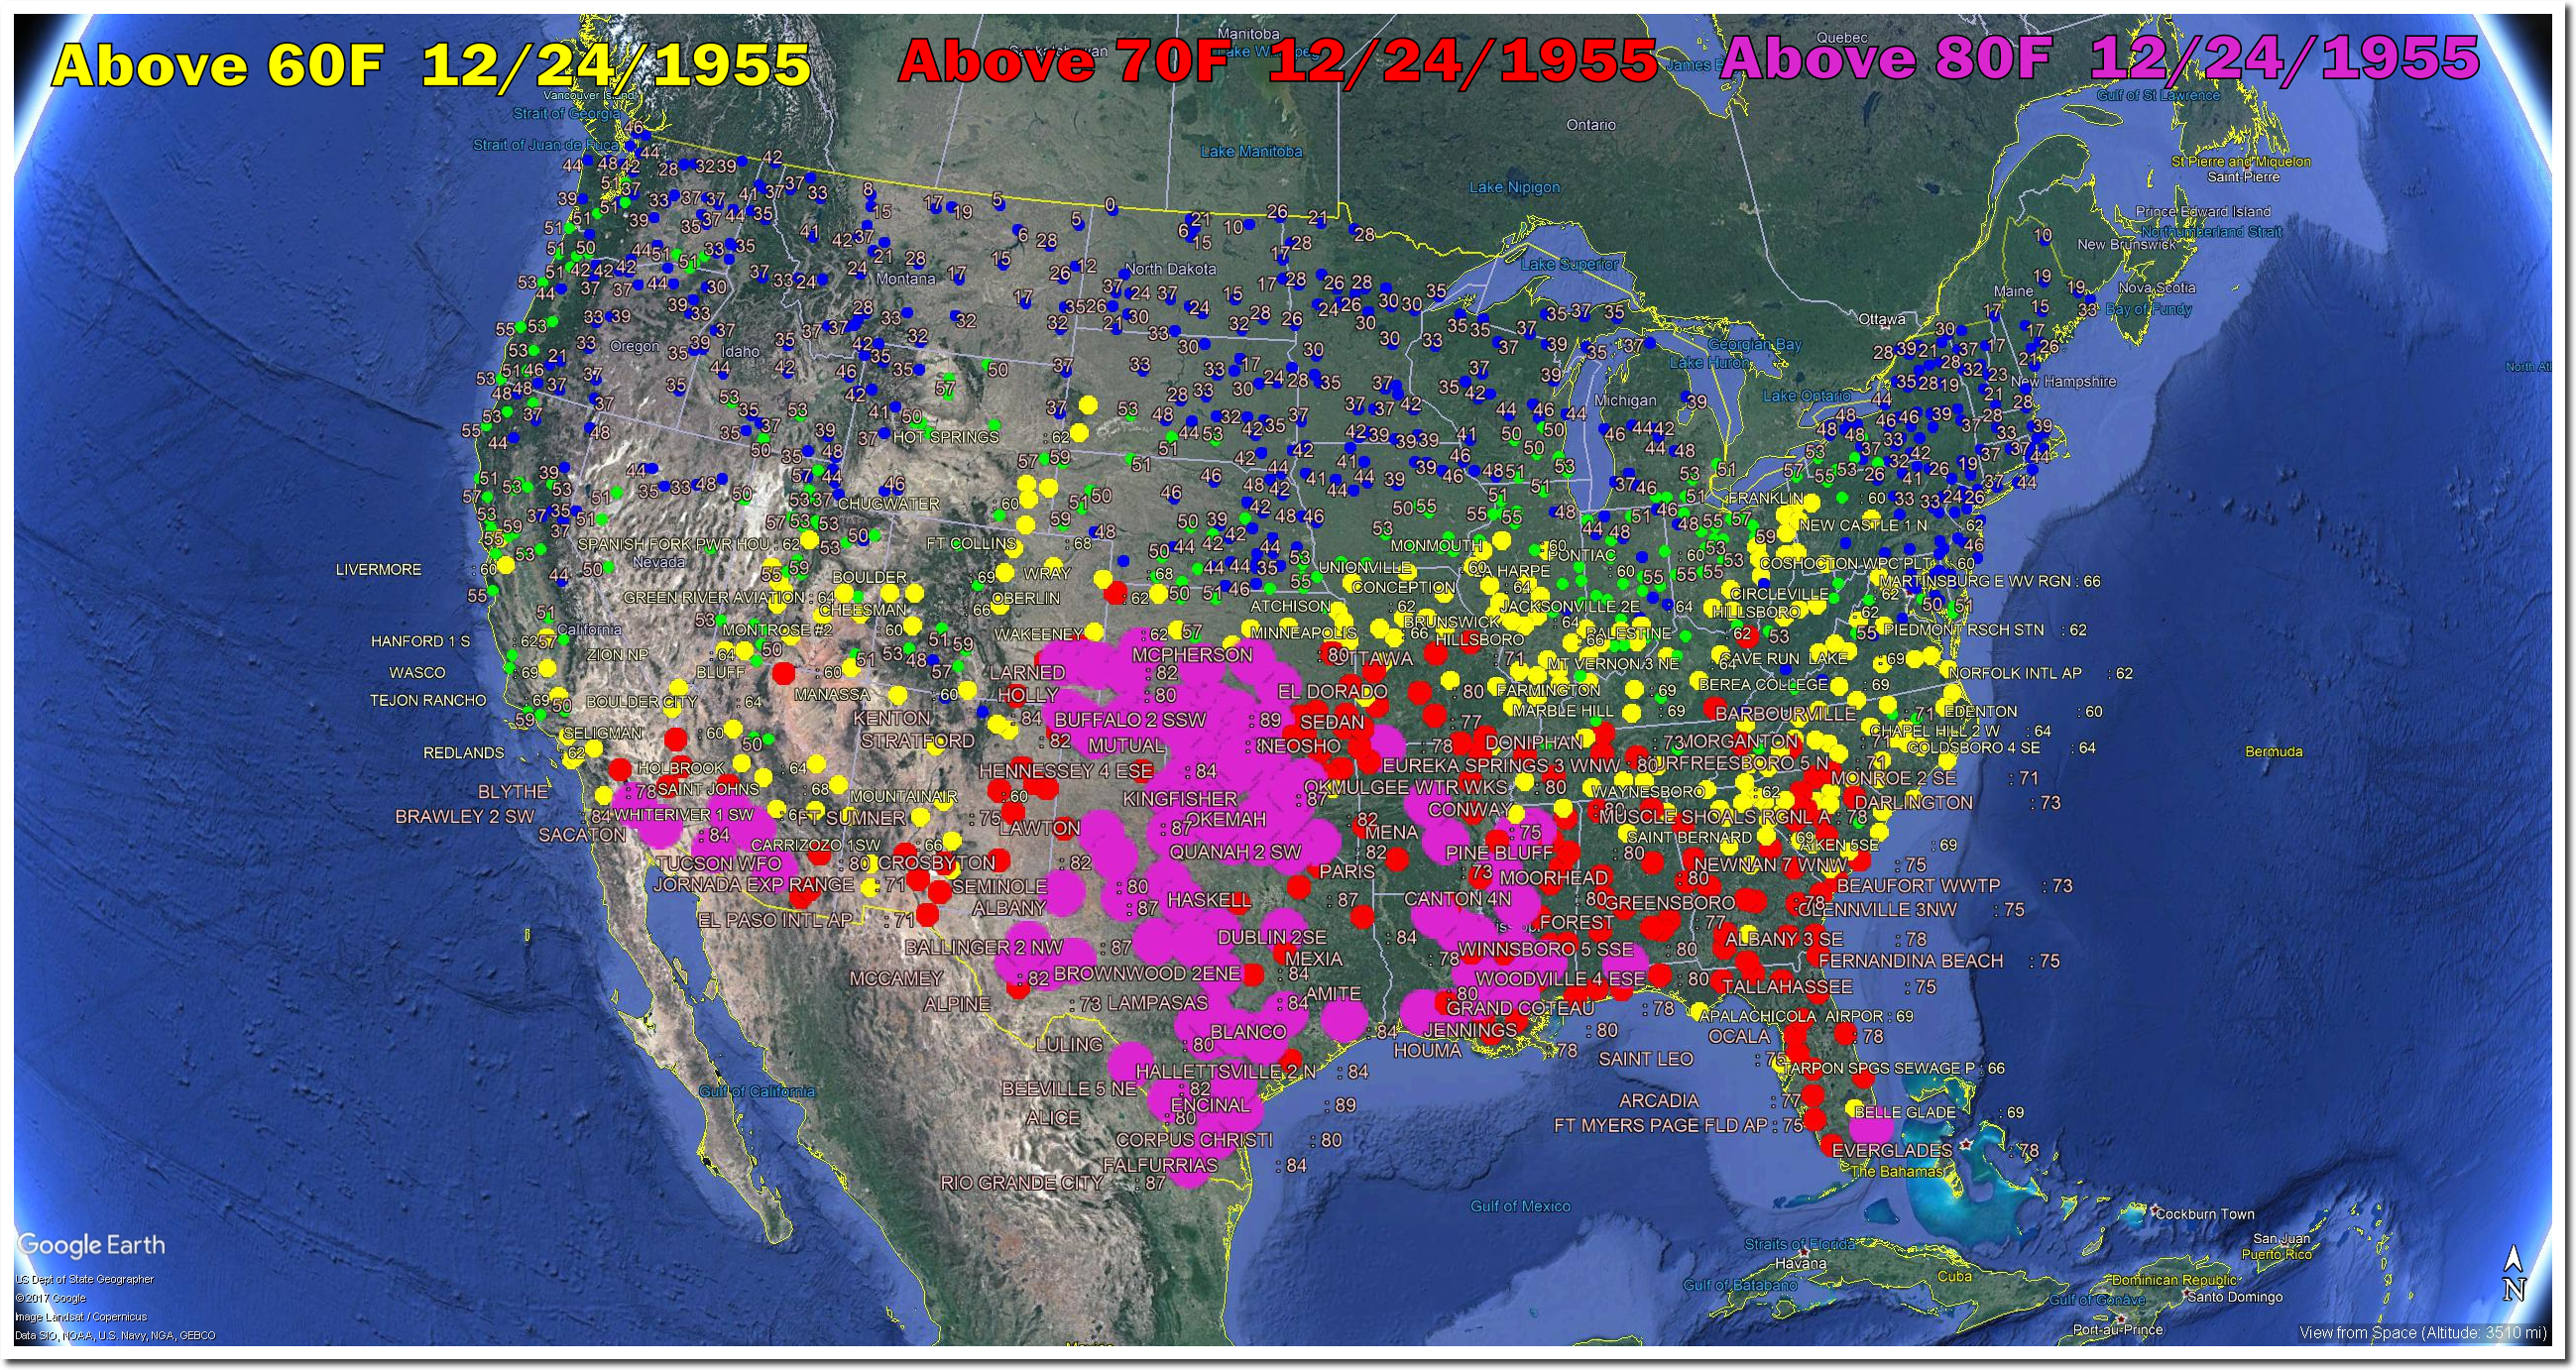
On Christmas Eve 1955, temperatures in Texas, Kansas and Oklahoma approached 90 degrees, and it was over 80 degrees in Colorado, California, Arizona, Arkansas, Louisiana, Mississippi, Alabama and Florida.
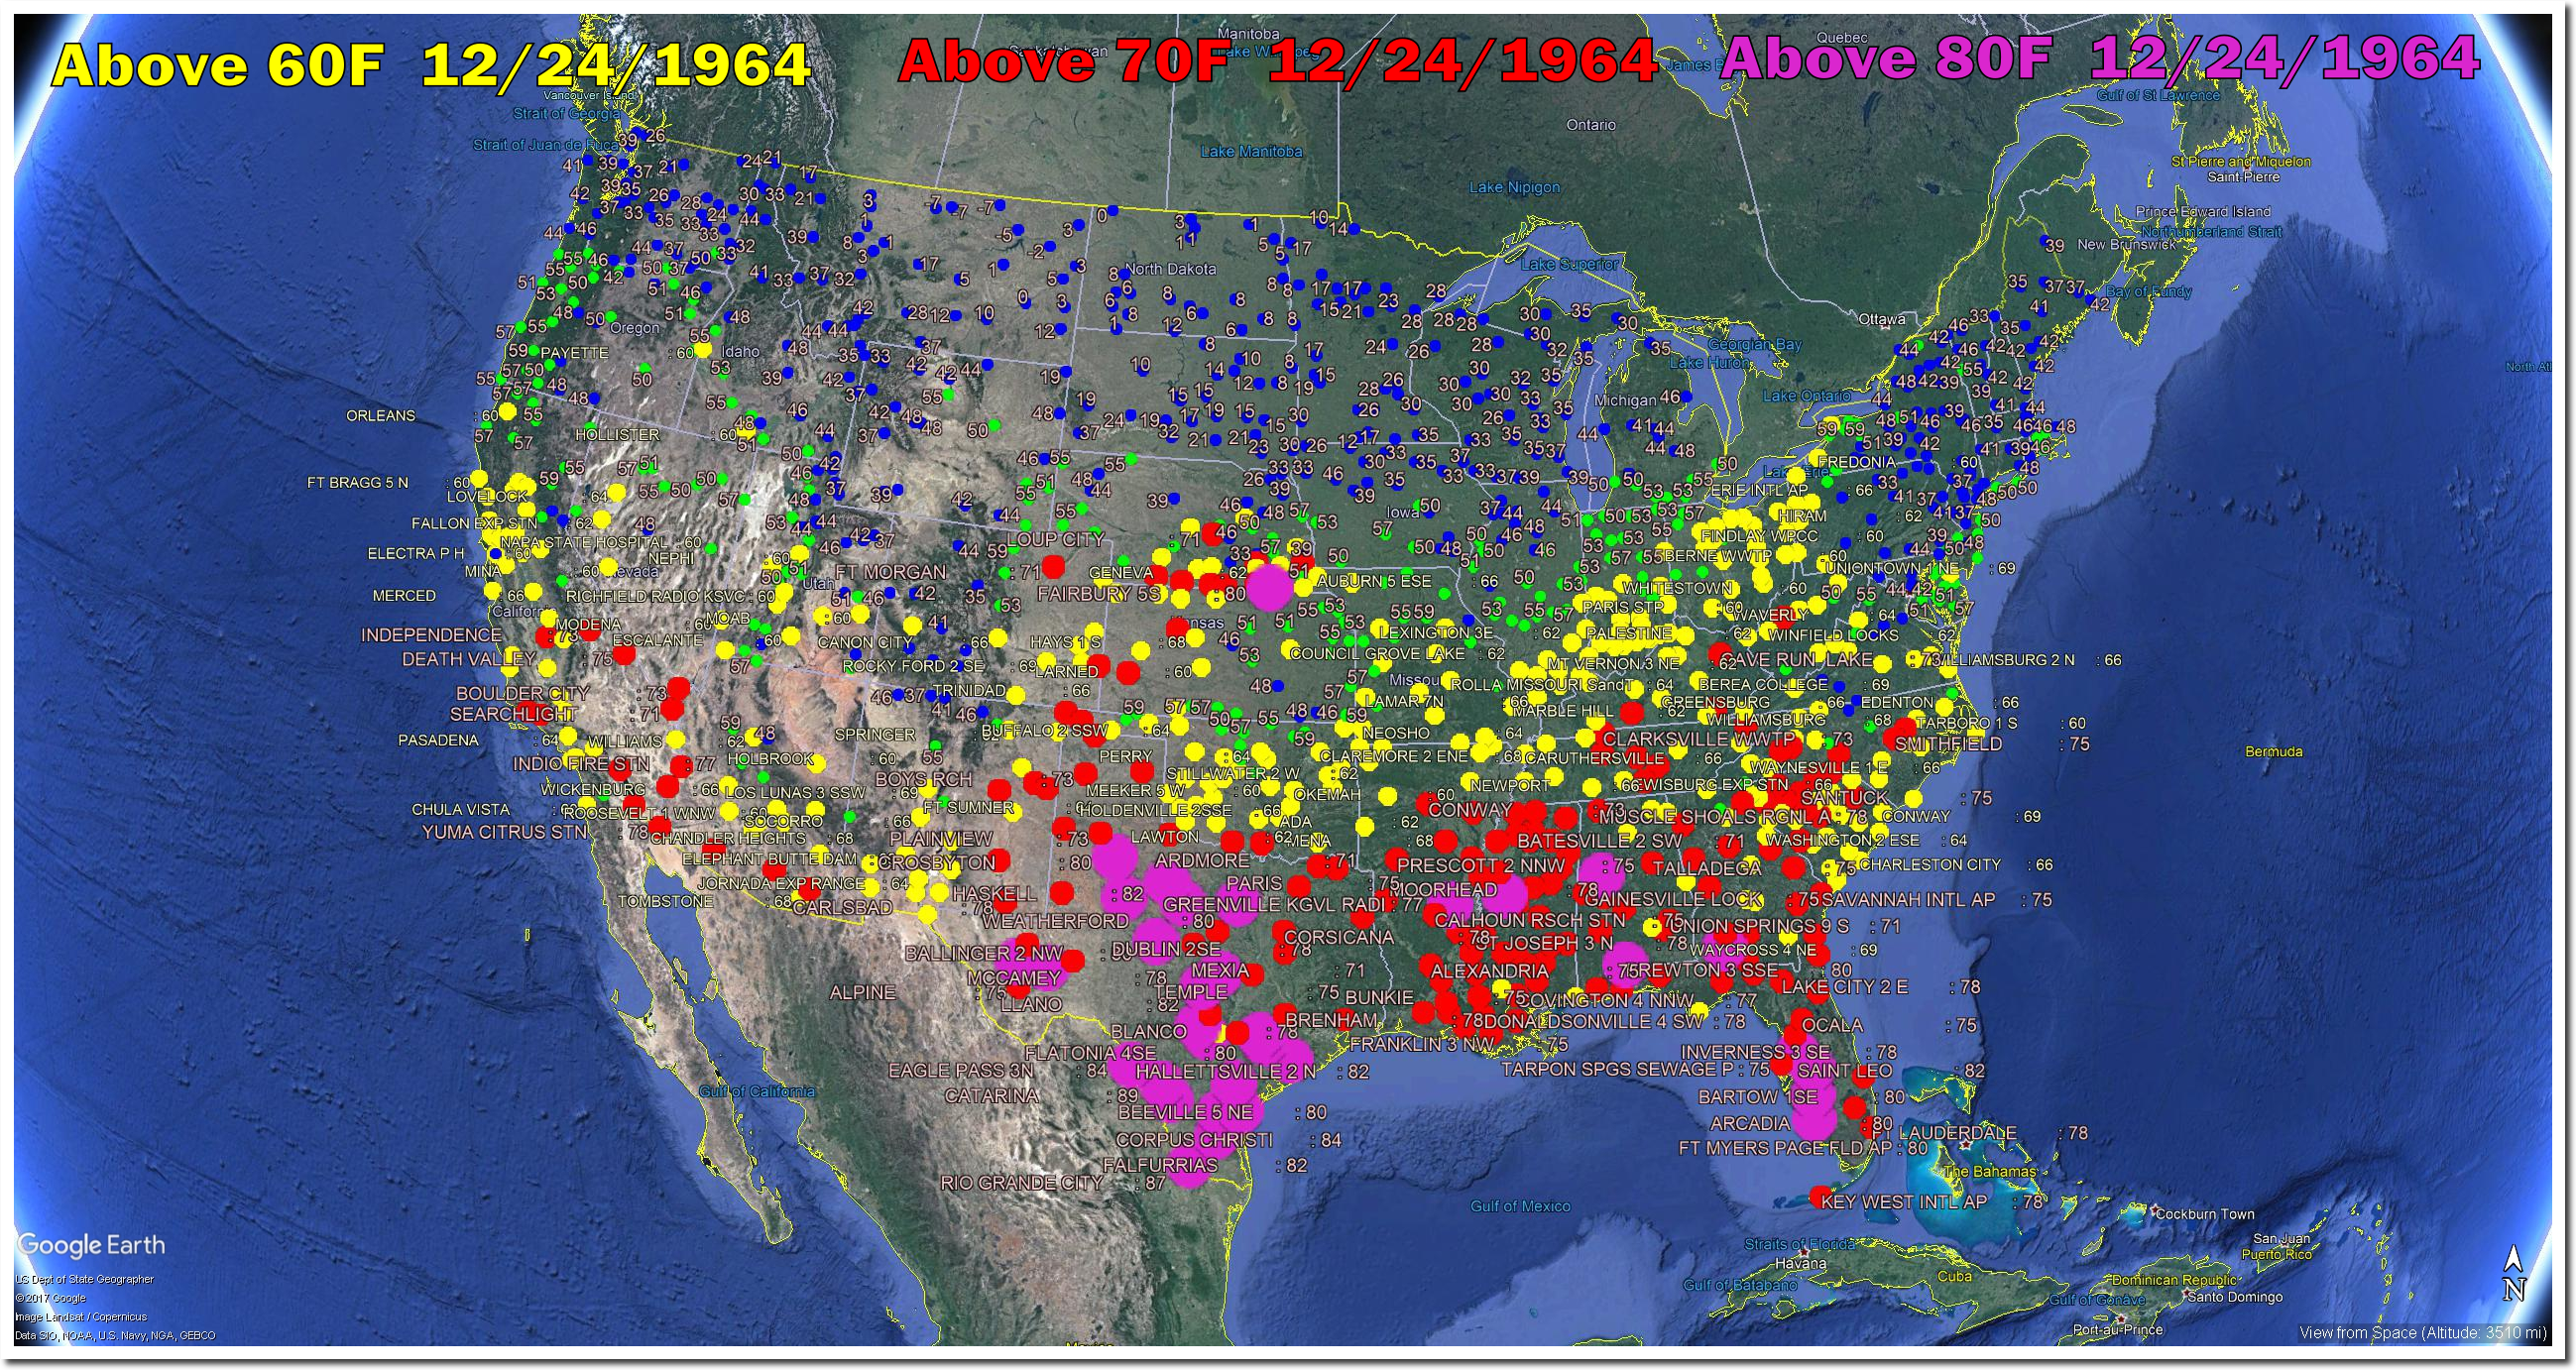
On Christmas Eve in 1964, it was 80 degrees in Nebraska, 69 degrees in Pennsylvania and Indiana, 62 degrees in New York, 71 degrees in West Virginia, 68 degrees in Ohio and Illinois, and 73 degrees in Kentucky.
Snow starting here in N. Central Indiana. Forecast is for 2-4″ just as Joe Bastardi has been forecasting for approx. the last two weeks. First White Christmas we’ve had for quite a few years. Low for Tuesday night is forecast to be -1 F and it is supposed to stay below freezing for the next 7 days, so this snow and a heavier snow forecast for a few days from now are going to stick for awhile.
I worked two days of overtime this week plus had a Canadian border crossing pay. And it looks like I’ll be having a lot more OT coming over the next few weeks. Not like it used to be when we would have a good break from Christmas until the end of January. That and the number of other trucks on the road that I’m seeing are great indicators of an economy in overdrive. I put in for three vacation days over New Years to get some stuff done around here and to be around if the blizzard that is forecast develops, but was told it would probably be denied.
My only real concern is trying to avoid the type A and B flu that is going around. Nasty stuff from what I’m hearing so I think I’m getting a flu shot for the first time in my life. I have had the flu before and managed to work through it. Never had to call off from work ever since I contracted some kind of nasty unidentified bug way back in 1982 when in the Army that had me delirious for two days, but from what I’m hearing from family that have had it, this is not the usual stuff.
It may be nasty to have but it doesn’t look like it’s that virulent. If you get it, antivirals seem to be effective against most strains in circulation. There is a lot of information here. https://www.cdc.gov/flu/weekly/index.htm#MS
“Based on National Center for Health Statistics (NCHS) mortality surveillance data available on December 21, 2017, 6.2% of the deaths occurring during the week ending December 2, 2017 (week 48) were due to P&I. This percentage is below the epidemic threshold of 7.4% for week 48.”
The thing is the docs are telling people that contract it to stay home for 7 days. For the first two days most people display no symptoms even though they’re contagious.
As for the stats? We’re just at the beginning of the usual flu season.
Tony, I hate to ask you to do any more work, but a similar plot of night time lows should have less of a downtrend due to increasing CO2 back radiation. If it is not readily evident then the significant CO2 warming hypothesis is in serious trouble.
Low temperatures are increasing due to Urban Heat Island effects.
The stations you use are as immune to UHI effect as one could get, which is good, but there is another effect, and that is the night time irrigation that goes on all across the country.
Just the same, there must be a noticeable warming trend that gives the alarmist industry its rising “average”. How one could separate out CO2 back radiation, UHI, and humidity change due to irrigation is a intractable problem.
Very few stations are immune to the wide ranging effects of suburban sprawl, snow removal, heat generated by burning fuels, central heating, air conditioning, irrigation, etc. It is not difficult to explain the few tenths of a degree rise in night time temperature over the past century.
If I remember correctly Tony you posted showing a trend for reporting stations whose data is used moving to the southern portion of the lower 48.
“there must be a noticeable warming trend that gives the alarmist industry its rising “average”. “
And if not, they will “adjust” until there is.
Maybe I should add that your work on daytime maximum temperatures has nicely destroyed the myth that our added CO2 has a strong warming effect. It may have SOME effect, but clearly the data you post proves that it is not enough to overcome the natural cooling since 1940. I recall K Briffa agonizing about the tree ring data going the ‘wrong way’, and the warmist solution in the Climategate emails was to truncate that ‘bad’ data and “hide the decline”. Excellent work Tony.
In 1955 in Boulder, the high was 70F and the low was 62F. Today, the high should be around 28F and the low 0F.
Looks like we might have a white Christmas here in Milwaukee’s northern burbs – very light snow started up about 9:00 AM and currently coming up on (11:30) it’s slowly turning white. Temperature is in the low 20s °F.
Christmas Day 1982 Milwaukee got to 60°F. Twas a record. I remember walking doggie in shirt sleeves.
We were forecast to get 2-4″. Then they lowered it to 1-3″. In the end we got about 1″. Just enough to cover the grass for the most part. But the winter cold has come to stay for awhile. All of this week no high forecast more than 28 deg. F and lows around below or near zero or low single digits. So the hard freeze is on. Looks like it will be awhile before I get out on the grill and do those USDA Prime bone in Ribeyes.
Merry Christmas Tony.
Would be cool (very cool this year) if you came back tomorrow and plotted the US map, for Christmas Eve for this year – under the 1955 and 1964 maps.