The National Climate Assessment has this graph, which shows how much hotter the US used to be.
Temperature Changes in the United States – Climate Science Special Report
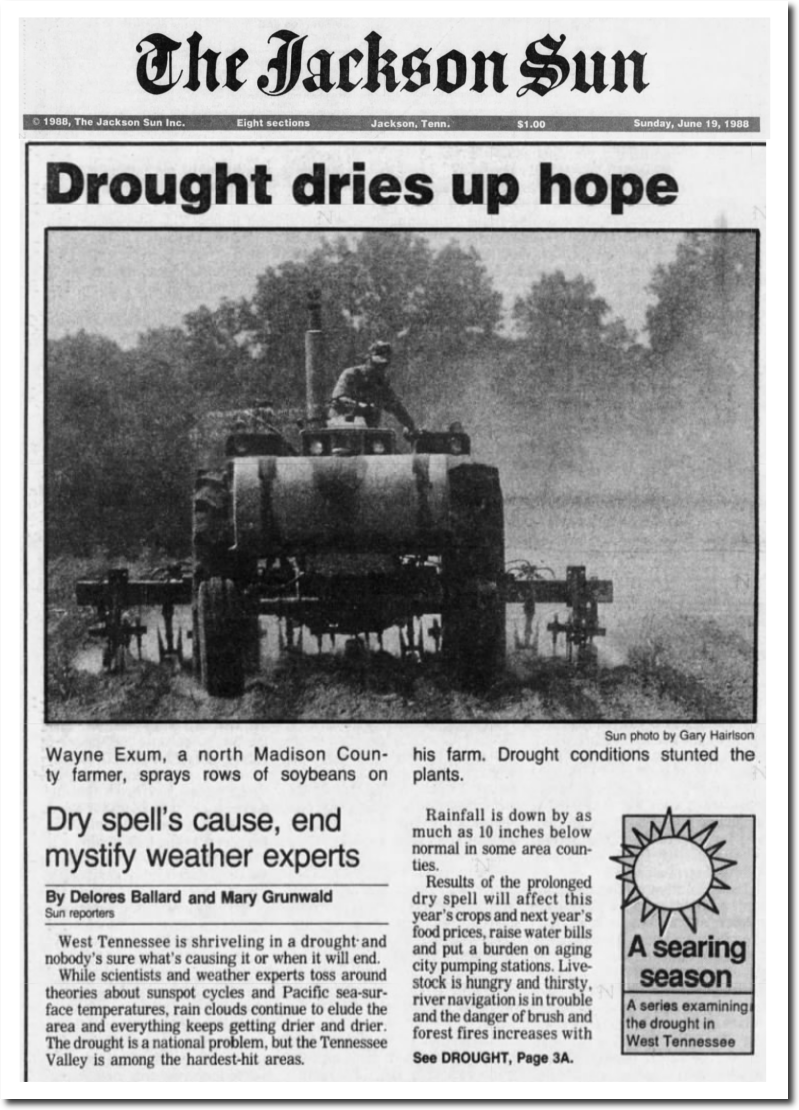
But somehow they lost the very hot summer of 1988, when James Hansen started the global warming scam, the Mississippi River nearly dried up, and Yellowstone burned.
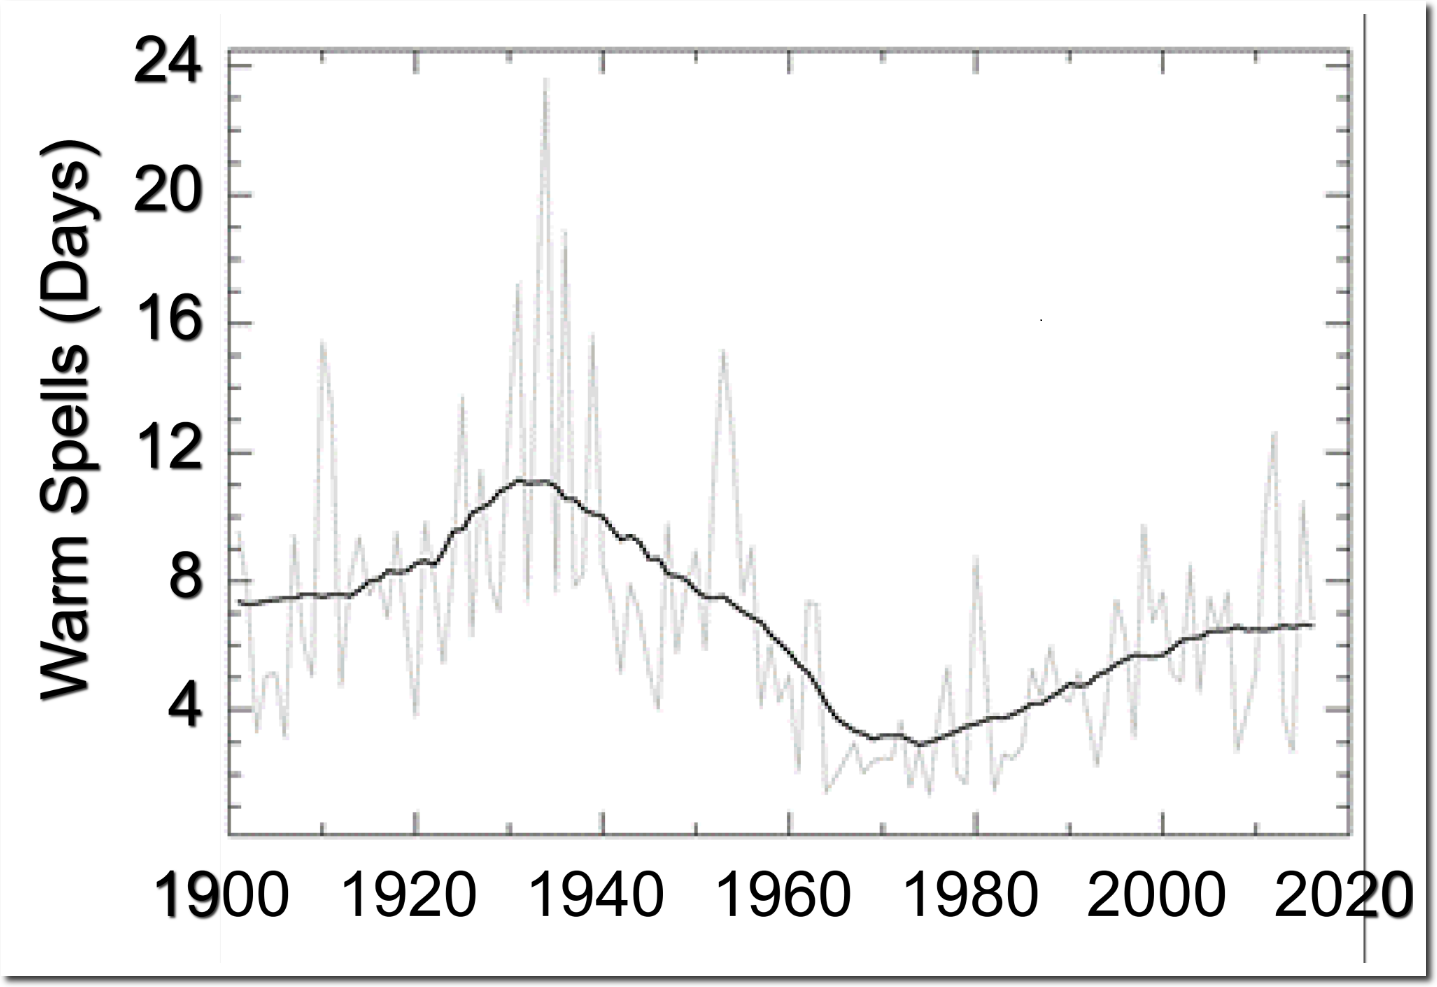
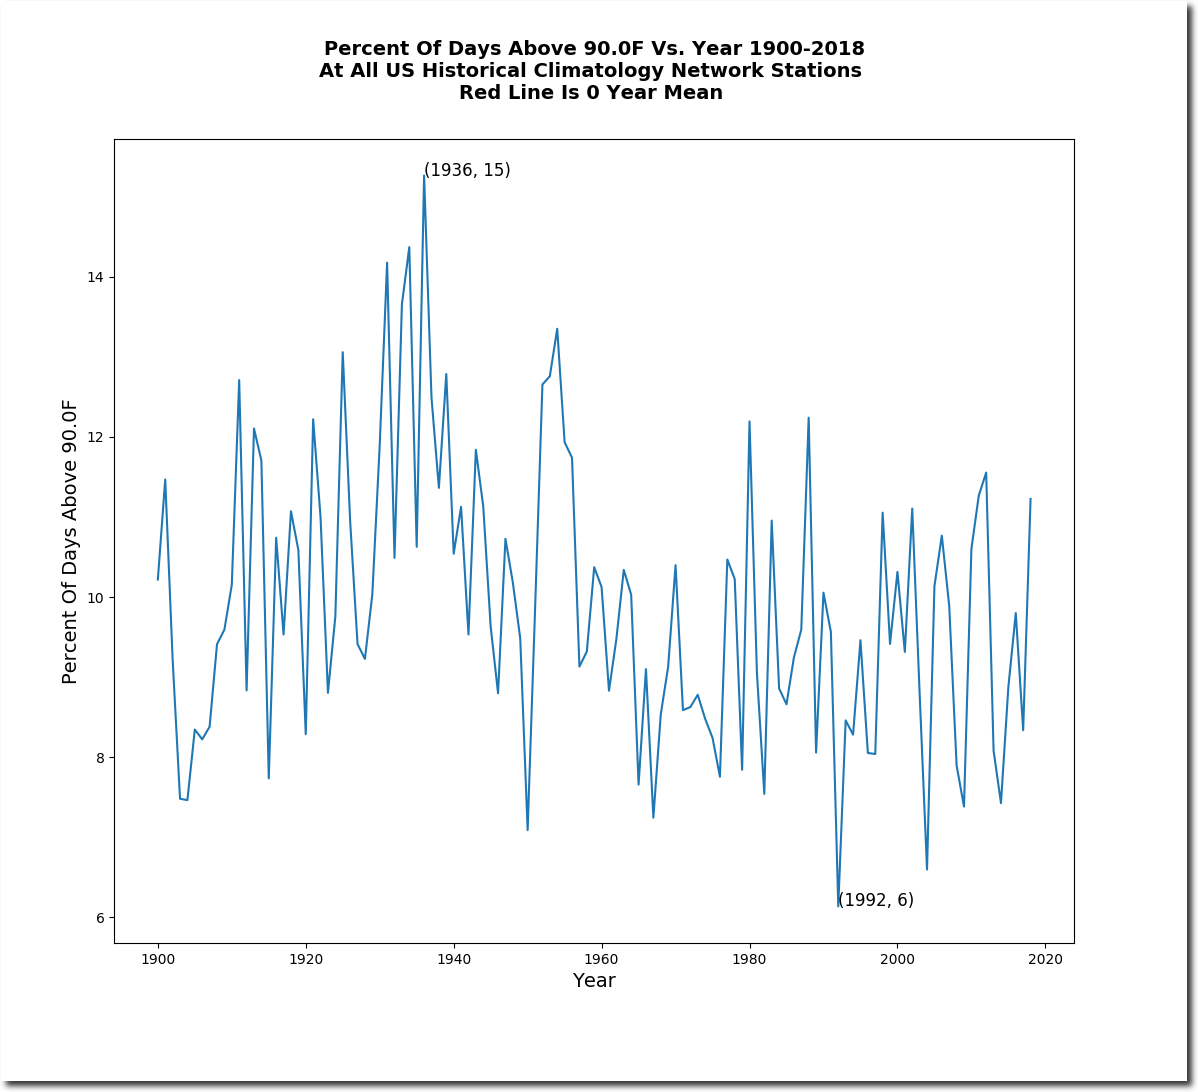
This is the actual data.
The next graph overlays the actual data above, on the government graph below. 1988 is gone – you really can’t make up incompetence like this.
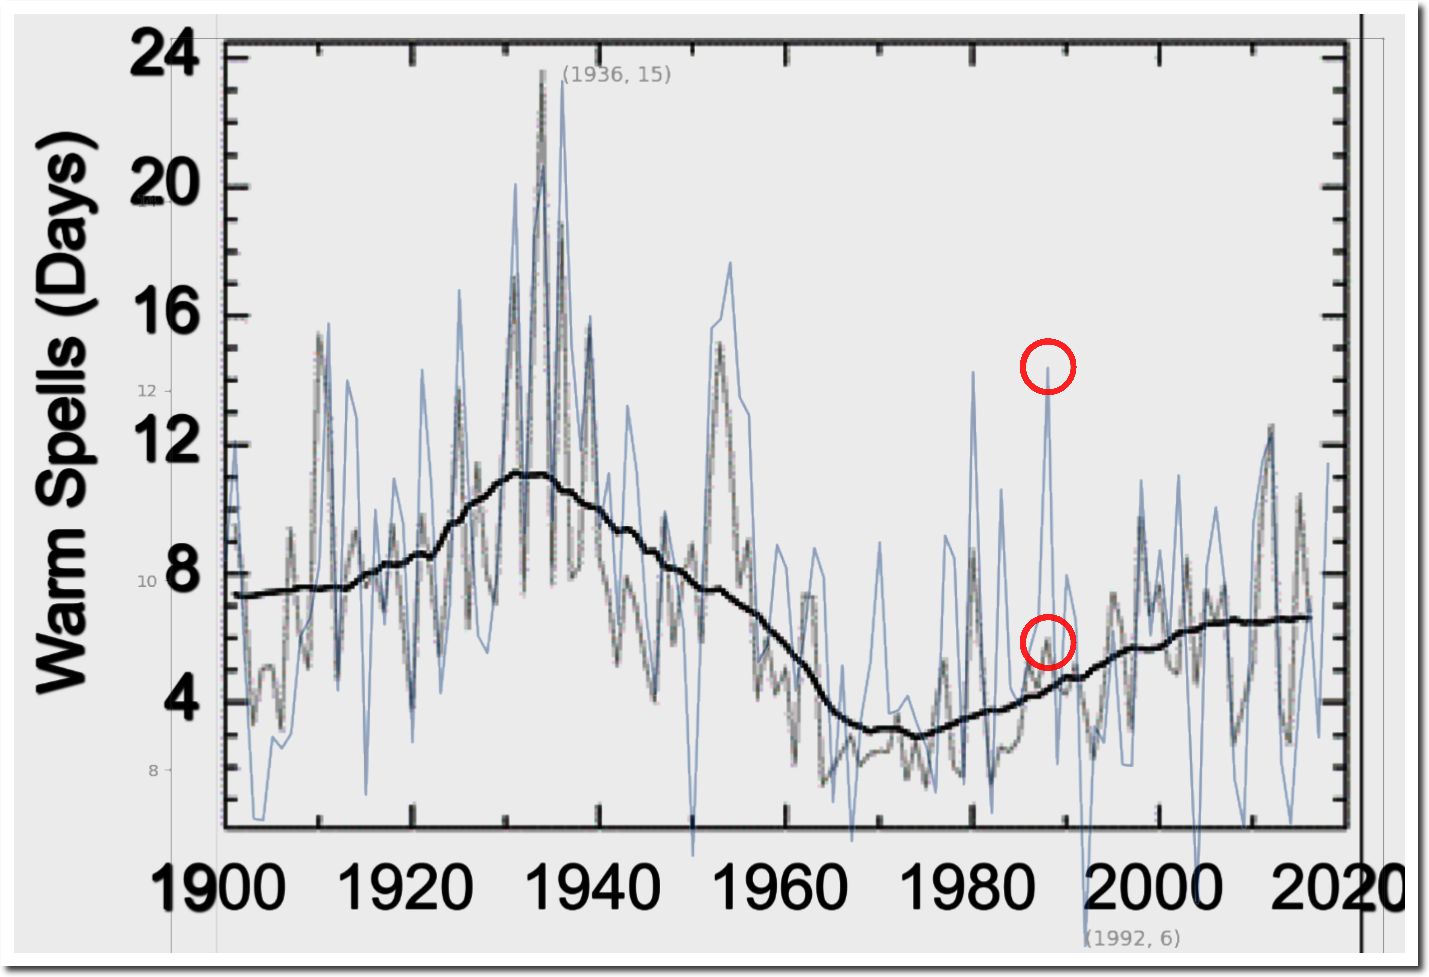
But then again ….