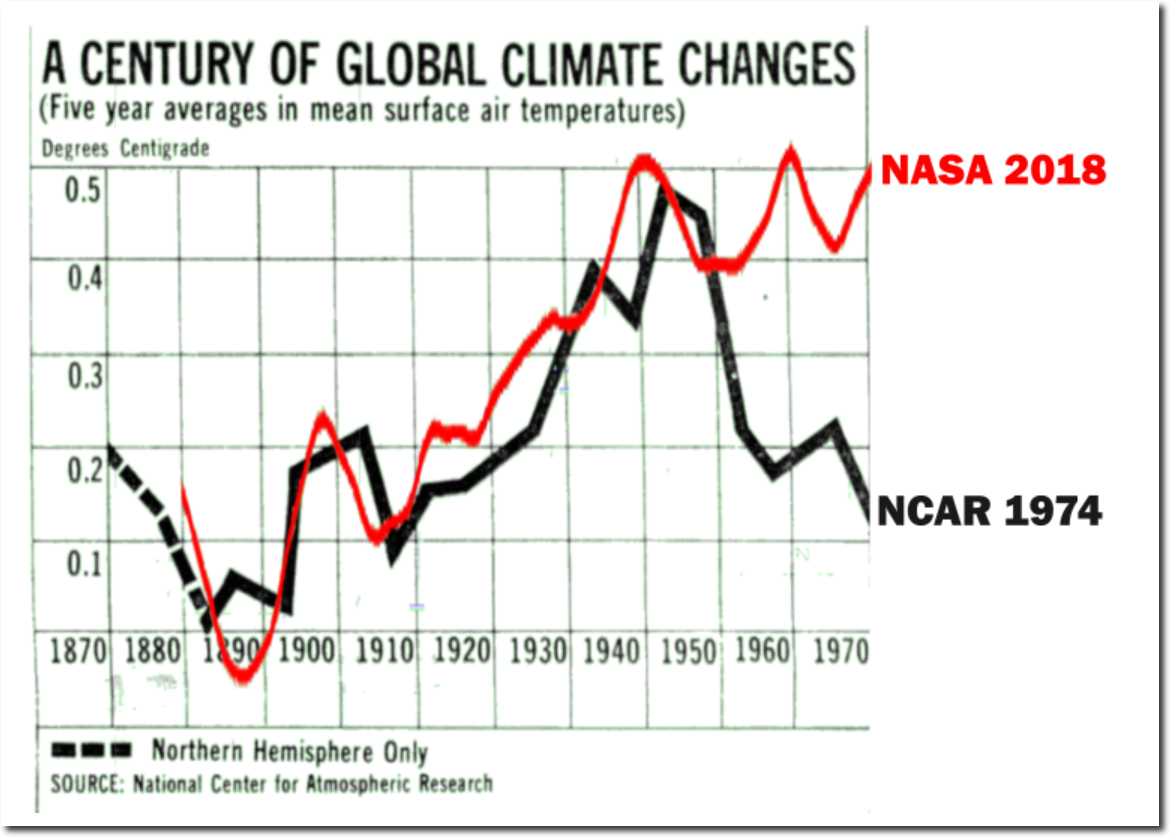
When government agencies tamper with data, they are guaranteed to get whatever result they want.
Email Subscribe
Disrupting the Borg is expensive and time consuming!
-
Recent Posts
Recent Comments
- Gordon Vigurs on Forecasting The Past
- Gamecock on Forecasting The Past
- Jeff L. on Media War On Science
- william on Wuhan Lujan’s War On Science
- Richard on CNN’s War On Science
Archives
- August 2022
- July 2022
- June 2022
- May 2022
- April 2022
- March 2022
- February 2022
- January 2022
- December 2021
- November 2021
- October 2021
- September 2021
- August 2021
- July 2021
- June 2021
- May 2021
- April 2021
- March 2021
- February 2021
- January 2021
- December 2020
- November 2020
- October 2020
- September 2020
- August 2020
- July 2020
- June 2020
- May 2020
- April 2020
- March 2020
- February 2020
- January 2020
- December 2019
- November 2019
- October 2019
- September 2019
- August 2019
- July 2019
- June 2019
- May 2019
- April 2019
- March 2019
- February 2019
- January 2019
- December 2018
- November 2018
- October 2018
- September 2018
- August 2018
- July 2018
- June 2018
- May 2018
- April 2018
- March 2018
- February 2018
- January 2018
- December 2017
- November 2017
- October 2017
- September 2017
- August 2017
- July 2017
- June 2017
- May 2017
- April 2017
- March 2017
- February 2017
- January 2017
- December 2016
- November 2016
- October 2016
- September 2016
- August 2016
- July 2016
- June 2016
- May 2016
- April 2016
- March 2016
- February 2016
- January 2016
- December 2015
- November 2015
- October 2015
- September 2015
- August 2015
- July 2015
- June 2015
- May 2015
- March 2015
- January 2015
Is the NASA line global or land based surface temperatures?
It is easy to conflate the two.
The NASA global is for sure made up for oceans, most likely by running models backwards.
Nothing is conflated. Why start out the thread with a comment like this?
No disrespect intended. I, like you, want to verify. I suppose a direct overlap on top of that bogus NASA graph would have made it immediately evident.
By the way, can you link me to a history of the USHCN data set? I do not understand the word “historical”. Does it mean only real measurements, and not infilled ones? Does it include UHI influenced readings, without UHI “adjustment”? I find it very difficult to know where the good quality(Anthony Watt’s 8% of class 1 and 2 stations) files are located and what they are called.
Id do think your work is providing a clear difference in the climate wars. The recent Danish paper which shows that the sheltered from ocean station temperatures of the 30’s and early 40’s are a little warmer corroborates your work. they may well have picked up on your insights.
OK, I digitized the NASA land only and it is a close match to the above. My bad.
i figured your adjustment would have been Colorado Rockies for LA Dodgers!
You know the science is fake and the fix is in when you see the “Ministry of Truth” constantly changing the past.
Coincidentally, in today’s LA Times sports writer Bill Plaschke prefaced his account of the World Series drubbing of the Dodgers with this bit of corny climate-influenced silliness:
“Winter came to Chavez Ravine Sunday night, swiftly, cruelly, blowing in from Boston and burying the Dodgers precisely where they stood. Clayton Kershaw, frozen on the mound, staring at his shoes. Dodgers batters, motionless at home plate, glaring into failure. Dave Roberts, stuck on the dugout rail, peering into his future….
Surrounding it all was a Dodger Stadium filled with October-bitten fans, frosty in their seats, glaring down at somebody else celebrating a championship for the second consecutive year…
It was all so cold. It was all so familiar”
THE DODGERS WON THE SERIES, THE DODGERS WON THE SERIES, THE DODGERS WON THE SERIES…….
I knew someone was holding back on something ?
You can’t even trust MLB these days ??? !
Go figure