Collapse Of The Arctic Sea Ice Scam Continues

I’ve been warning climate alarmists about this for a year. Their Arctic sea ice melting scam is dead.

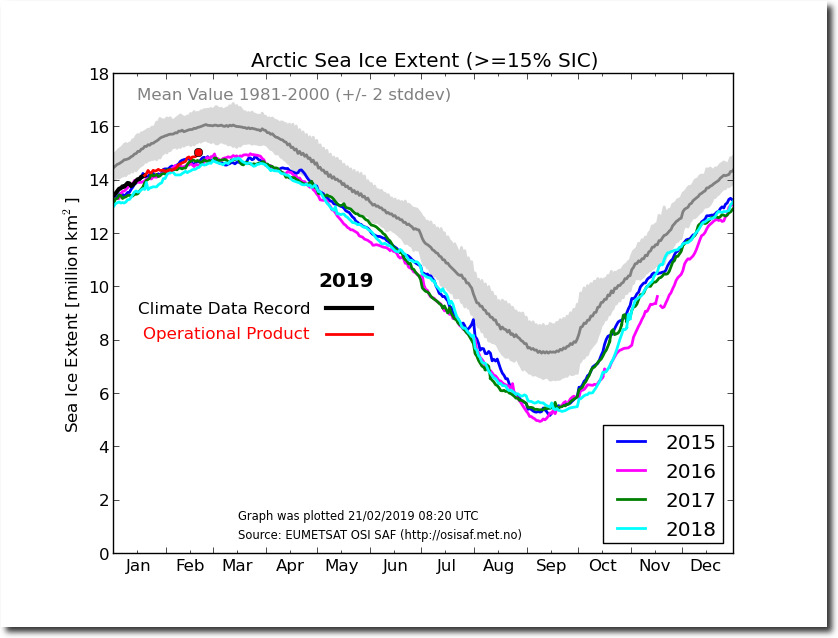
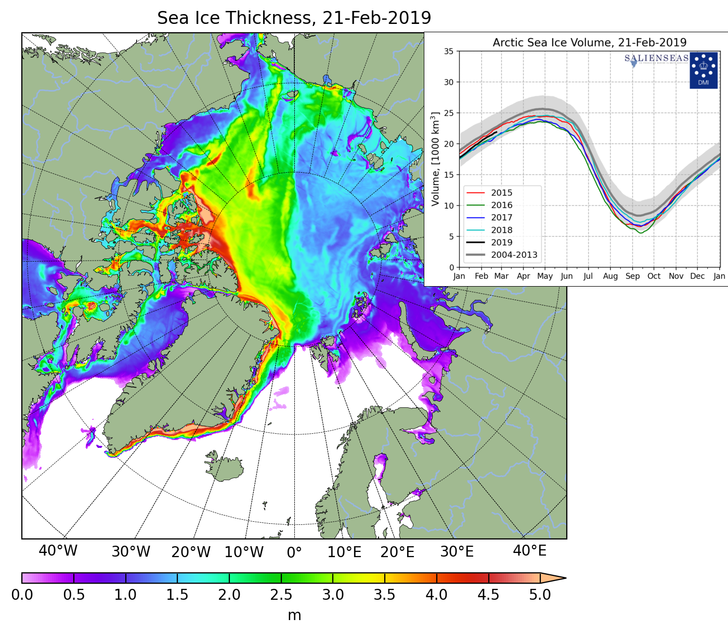
Ocean and Ice Services | Danmarks Meteorologiske Institut
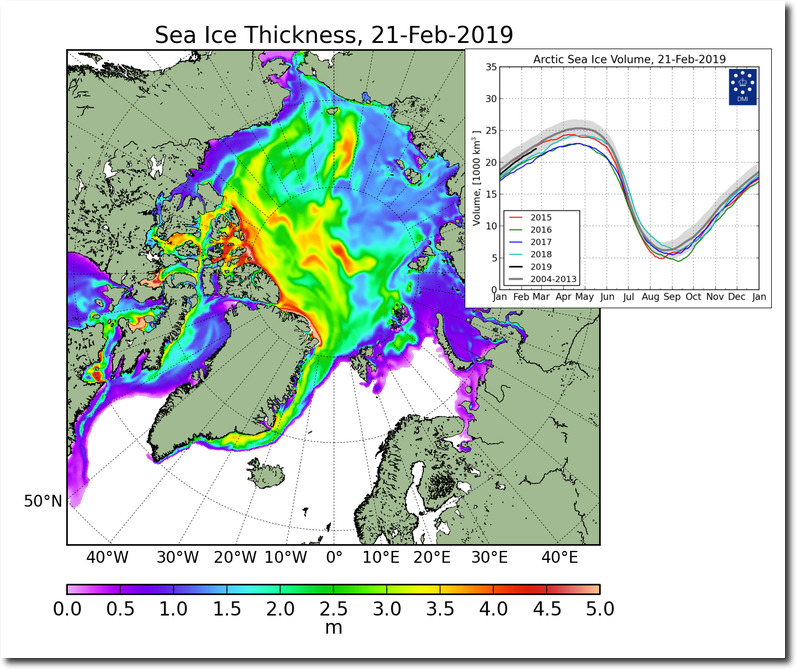
CICE_combine_thick_SM_EN_20190221.png (758×631)

This entry was posted in Uncategorized. Bookmark the permalink.

43 Responses to Collapse Of The Arctic Sea Ice Scam Continues

  1. Steve says:

    Sorry, I’m not following a couple things.
    What in the data is proving what here?
    What does “operational product” mean?

    • rah says:

      1. The data is proving that the sea ice extent in the Arctic is stable when so many “experts” on climate change and the Arctic are on record that ice would be gone in the summer and so many articles have declared the ice in the Arctic is melting. It is proving that the ice extent so far in 2019 is a bit above what it was at this time of year during the previous four years.

      2. The “operational product” is observation and calculation that has not yet gone through a validation process intended to reveal and correct errors. Once the observations and data are validated or adjusted as needed to eliminate any errors found it will then become part of the permanent record and the red line will be changed to black. Usually there is little or no change but on occasion the change can be significant.

      • Harry says:

        Yes, the last four years have indeed been stable in being significantly lower than the decade before (2.nd graph) and even worse compared to the two decades before that. (1st graph). I don’t like the tone of the alarmist but there’s no denying that the overall trend is negative when you look further back then only a few years. Not ice free in the summer of x doesn’t mean overall there’s nothing happening. Whether caused by humans or not if this trend continues we’re all in trouble whether you’re an alarmist, in denial or simply don’t give a ….

        • Disillusioned says:

          We’ll all be in trouble, eh? You revealed which side of the argument you’re on.

          • Colorado Wellington says:

            Interglacials bad.
            Warming world bad.
            Holocene bad.
            Eemian worse.
            Glacial Periods good.
            Snowball Earth best.

        • rah says:

          Harry.

          Did humans cause it to be low in the 1920s and early 30s? And exactly what were the negative effects then from that low. You do notice that during the late 70’s it was anomalously high?

          Chart by Alekseev et al, 2016. Comments and rough linear trendlines added by NTZ.

          • Jason Calley says:

            Hey rah! Yes, perhaps the main difference between alarmists and sceptics is this: Alarmists say “Look at the trend for the last X number of years! If this trend continues, disaster is certain!” Meanwhile sceptics say “Look at the cycles for the last multiple-X number of years! This has all happened before — nothing to see here!”

            It is unfortunate that the “official” definition of climate is that it is the combined weather events of the last 30 years. That 30 year period was chosen because at the time there was only 30 years of reliable data available. We know now that there are definite climate cycles, many of which are longer than 30 years. Basic observation will tell you that extending linear trends over a partial cycle will give you very bizarre and untrustworthy results.

          • Stanislav says:

            I’m not sure about this graph, here’s one by the Global climate change impacts in the US (2009)
            https://nca2009.globalchange.gov/arctic-sea-ice-extent-annual-average/index.html

            (Please note the last line, the same Alekseev et al, yet somehow your view is a little different)
            “According to the estimates made with a simple regression model, we can expect a seasonally ice‐free Arctic Ocean as early as in the mid‐2030s. An impact of the inflow of warm and salty Atlantic water (AW) on winter SIE was evaluated as an example for the Barents Sea. This evaluation reveals a coherent spatial pattern of the AW spreading, presented by surface salinity distribution, and the position of sea ice edge, and significant correlation between the inflow of the AW and maximal SIE. This publication presents a revised version of an ‘Arctic sea ice extent in changing climate’ report (Alekseev et al., 2015).”

            Link to above quote: https://rmets.onlinelibrary.wiley.com/doi/full/10.1002/joc.4550

        • spike55 says:

          Sorry, but by ignoring the longer term history oif the Arctic sea ice, you really can’t make a proper determination

          The FACTS are that current levels of Arctic sea ice are well still in the TOP 10% of Holocene extents.

          The ONLY time it has been higher was during the Little Ice Age and the late 1970s.

          The MWP and the preceding 9000 or so had distinctly LESS sea ice than now.

          On an interglacial basis, current levels are ANOMALOUSLY HIGH.

  2. Mr GrimNasty says:

    The near total sea ice melt at the other pole that looked so promising in January has massively failed to deliver for the alarmists too.

  3. R Shearer says:

    It’s well above 1974 levels (45 years ago).

  4. Louis Hooffstetter says:

    Cue ‘Global Cooling’ crisis in 5… 4… 3… 2… 1…
    Portray it as a horrific crisis, and make it due to… hmmm… let’s see,… methane!
    Yeah, that’s the ticket! And it’s all mankind’s fault.
    Too many cows, and too many beans.

  5. Steven Fraser says:

    DMI Sea Ice Volume report for Feb 22: Volume rose 80 cu km since yesterday, to 22,227 cu km, which is 99.26% of the day’s average value in the 17-year series, and 98.86% in the DMI-charted 10-year reference period 2004-2013.

    The day’s average growth in the 17-year series was 55 cu km, and for the reference period 52 cu km. Comparatively, the day’s growth this year was 144.67% and 151.78% of those values, respectively. 2019 is now 166 cu km below the 17-year average, and 921 cu km above last year on this date.

    The latent heat released in the formation of the new ice is 2.43606E+19 Joules, or 2.4361E+07 TeraJoules.

    DMI Sea Ice Volume growth just passed a milestone: Since last year’s September 10 minimum, the volume has now grown more than 16,000 cu km from the low stand value.

  6. Stuffnnonsense says:

    So I’m confused. The top chart shows sea ice extent below the historical mean over the last four years. Why would I not read from that that the ice extent is falling, as the climate change guys postulate ? What am I not seeing here ?

    • tonyheller says:

      I have been above my average height for the past 50 years, so I must be getting taller. (According to your logic)

    • Gator says:

      Historical mean? LOL

    • rah says:

      That “historical mean” is only from 1981 to 2000. A 19 year period. In 1979 after several years of cooling, the Arctic sea ice hit an anomalous high and so it would be expected to decline. All metrics of ice, temperature, sea levels, etc must always be viewed with the understanding we are in an interglacial period when temperatures are expected to rise, ice levels drop, and sea levels rise over the long term and 19 years is not even a blink in geologic time.

      Sea ice extent is about as lousy a proxy for global temperature as one could select since the dynamic short term changes result from storms, wind, and wave action that break up the ice so it flows out into the north Atlantic and not warm water or air temperatures. But the alarmist camp decided to make Arctic sea ice a primary indication of warming and to make the polar bear their climate change poster child. Neither has worked out for them.

      • Disillusioned says:

        Well said. Starting after the coldest period of the 20th century is a cherry pick.

        “….we are in an interglacial period when temperatures are expected to rise….

        This warm interglacial period (Holocene) is not only long in the tooth, but during the Holocene Optimum several thousand years ago, it never reached the warming of the prior four interglacial periods. Interglacials are about warmth, bounty and life. And they are fleeting. We should be happy we are living in one.

        For anyone seeing this Vostok graph for the first time, the 20th century is very close to the bottom right-hand corner of the red rectangle on the right.

      • rah says:

        If you don’t like that chart for some reason then here is another from (JAM) Japan Meteorology Agency:

          • R Shearer says:

            One is average, one is low. Each is probably correct.

          • Windsong says:

            The good old “…since 1979…” line. Would be nice to see a chart back 20 years more. (And, yes they have the data. USN submarines were measuring ice and thermocline layers in the Arctic long before 1979.) Why is NASA concentrating on just ice mins? A graph on ice max would be of interest as well.

          • rah says:

            From 202 years ago”
            “It will without doubt have come to your Lordship’s knowledge that a considerable change of climate, inexplicable at present to us, must have taken place in the Circumpolar Regions, by which the severity of the cold that has for centuries past enclosed the seas in the high northern latitudes in an impenetrable barrier of ice has been during the last two years, greatly abated.
            (This) affords ample proof that new sources of warmth have been opened and give us leave to hope that the Arctic Seas may at this time be more accessible than they have been for centuries past, and that discoveries may now be made in them not only interesting to the advancement of science but also to the future intercourse of mankind and the commerce of distant nations.”
            President of the Royal Society, London, to the Admiralty, 20th November, 1817 [13]
            *13 President of the Royal Society, Minutes of Council,
            Volume 8. pp.149-153, Royal Society, London.
            20th November, 1817.

            http://www.john-daly.com/polar/arctic.htm

          • spike55 says:

            Wharthog, are you an ignorant fool?

            Did you know that the current NSIDC Arctic data for this day is above:
            2005, 2006, 2011, 2014, 2015, 2016, 2017 and 2018, and above the 11 year average.

            Did you know that the late 1970s was a time of EXTREME Arctic sea ice, up there with the levels of the Little Ice Age?

            Did you know that current levels are in the top 5-10% of the last 10,000 years ?

            You really should LEARN more, other than just sucking up the AGW propaganda lies and non-truths.

            All you do with comments like that one of yours, is show just how NIL-educated you are.

    • rah says:

      Lets see if this helps with your confusion about Arctic Ice Extent.

      • Wharton says:

        This is a fake graph. Why don’t you have link to find the source of
        dubious data?
        https://www.carbonbrief.org/guest-post-piecing-together-arctic-sea-ice-history-1850

        • Louis Hooffstetter says:

          “We encountered no ice with the exception of a few narrow strips of old sound ice, carried by the wash. Of large Polar ice we saw absolutely nothing. Between the ice and the land, on either side, there were large and perfectly clear channels, through which we passed easily and unimpeded. The entire accumulation of ice was not very extensive. We were soon out again in open water.”

          “Outside the promontories, some pieces of ice had accumulated; otherwise the sea was free from ice. The water to the south was open, and the impenetrable wall of ice was not there. Captain Knowles reports the season the most open he has ever known. He entered the Arctic on the day we left Sari Francisco, May 22, and thinks the straits were open even earlier than that.”
          THE NORTH WEST PASSAGE BEING THE RECORD OF A VOYAGE OF EXPLORATION OF THE SHIP “GJOA” 1903 – 1907 BY ROALD AMUNDSEN http://docs.lib.noaa.gov/rescue/IPY/ipy_009_pdf/G6501903A71908v1.pdf

        • rah says:

          Why would anyone believe a person that can’t or won’t read? LOOK at the bottom of the graph Wharton!
          Alekseev et al, 2016 (reconstructed September Arctic sea ice extent, 1900-2013) as show in in Connolly et al., 2017.

          Here is another one for you. Data source (DMI)
          http://ocean.dmi.dk/arctic/icethickness/txt/IceVol.txt

        • spike55 says:

          The FAKE graphs are the ones from carbonbriefs.

          They don’t match the temperature profile of the Arctic since 1900, the one above does

        • spike55 says:

          Larson sailed the Prince of Wales Straight next to Banks Island in 1944 in a little wooden boat, the St Roch

          That strait has only be passable for 2 or 3 of the last several years, with modern satellite aids.

    • rah says:

      And here is one from the NISDC which show extent within 2 SD of the mean.

    • Jason Calley says:

      Stuffnnonsense says: “Why would I not read from that that the ice extent is falling, as the climate change guys postulate ? What am I not seeing here ?”

      That is a reasonable question. Ice looks lower, so what does that tell us about long term trends?

      There are two details we need to know before we can answer that. First, lower than what? Second, how long (and what shape) is “long term?”

      Imagine this. Suppose you want to know what the temperature trend of your back yard is. You measure the temperatures from January to March and decide to use that for your base line average. Sometime around July or August you will be in a panic. Temperatures are running 40 degrees above average! If that trend continues as a straight line, the oceans will be boiling in another couple of years! :)

      Of course the problem is obvious. We have a cyclic phenomenon (annual temperature swings) and we have taken only parts of the cycle, using some of the coldest parts for base line and some of the warmest parts for current trends. We have used linear extrapolation on something that is more correctly presented as a cyclic phenomenon.

      In the case of Arctic ice, we have started the base line averages at the point of maximum ice, and are now comparing it to the ice at the lower part of the cycle. It is true that we have better data starting in 1979 and that has been the justification for using that year as the start of the base line. We do, however, have data for other decades going quite a bit farther back in time, just with somewhat larger error bars. Looking at the more complete set of data, we see that Arctic ice really is cyclic and that the use of linear extrapolation is simply not correct. The current level of ice is pretty much normal based on what we have seen in the past, nothing catastrophic about it, and nothing that indicates any long term trend toward complete melting.

      • R Shearer says:

        The satellite data goes back to 1972. It undoubtedly got better over time, but 1979 is the high point of the satellite record. Why would they start there?

  7. Mr Sir says:

    “Their Arctic sea ice melting scam is dead.” Even though the 2019 sea ice extent is still below the 1981-2000 median.

    • rah says:

      60+ years cycles like the AMO (Atlantic Multidecadal Oscillation) are far beyond your understanding Mr. Sir.

    • gregole says:

      When will the Arctic be ice free?
      That ice extent in the Arctic is below some arbitrary mean is meaningless.
      Ice free Mr Sir. When?
      CO2 is at over 400 ppm. What will it take to melt the ice?

    • Gator says:

      Ahhh, the meaningless mean. Idiots adore it.

    • spike55 says:

      Still WAY above the average for the current interglacial

      Its actually in the top 5-10% of the last 10,000 years.

      There is one heck of a lot of sea ice up there compared to MOST of the last 10,000 years.

  8. Steven Fraser says:

    DMI Sea Ice Volume report for Feb 23: Volume rose 62 cu km since yesterday, to 22,289 cu km, which is 99.28% of the day’s average value in the 17-year series (highest for the year so-far), and 98.9% in the DMI-charted 10-year reference period 2004-2013.

    The day’s average growth in the 17-year series was 58 cu km, and for the reference period 55 cu km. Comparatively, the day’s growth this year was 107.90% and 113.84% of those values, respectively. 2019 is now 162 cu km below the 17-year average, and 902 cu km above last year on this date.

    The latent heat released in the formation of the new ice is 1.9038E+19 Joules, or 1.9038E+07 TeraJoules.

  9. Steven Fraser says:

    DMI Sea Ice Volume report for Feb 28:

    Since I skipped a few days, here is what happened during that time: From the 24th – 27th, the DMI Sea Ice volume increases were below the average increase of the 17-year series for each day, and as a result the % of the average has declined a bit. Now for the most recent report.

    Volume rose 91 cu km since yesterday, to 22,496 cu km, which is 98.65% of the day’s average value in the 17-year series, and 98.11% in the DMI-charted 10-year reference period 2004-2013.

    The day’s average growth in the 17-year series was 75 cu km, and for the reference period 90 cu km. Comparatively, the day’s growth this year was 121.37% and 101.41% of those values, respectively. 2019 is now 308 cu km below the 17-year average, and 1055 cu km above last year on this date.

    The latent heat released in the formation of the new ice is 2.79633E+19 Joules, or 2.7963E+07 TeraJoules.

Leave a Reply

Your email address will not be published. Required fields are marked *