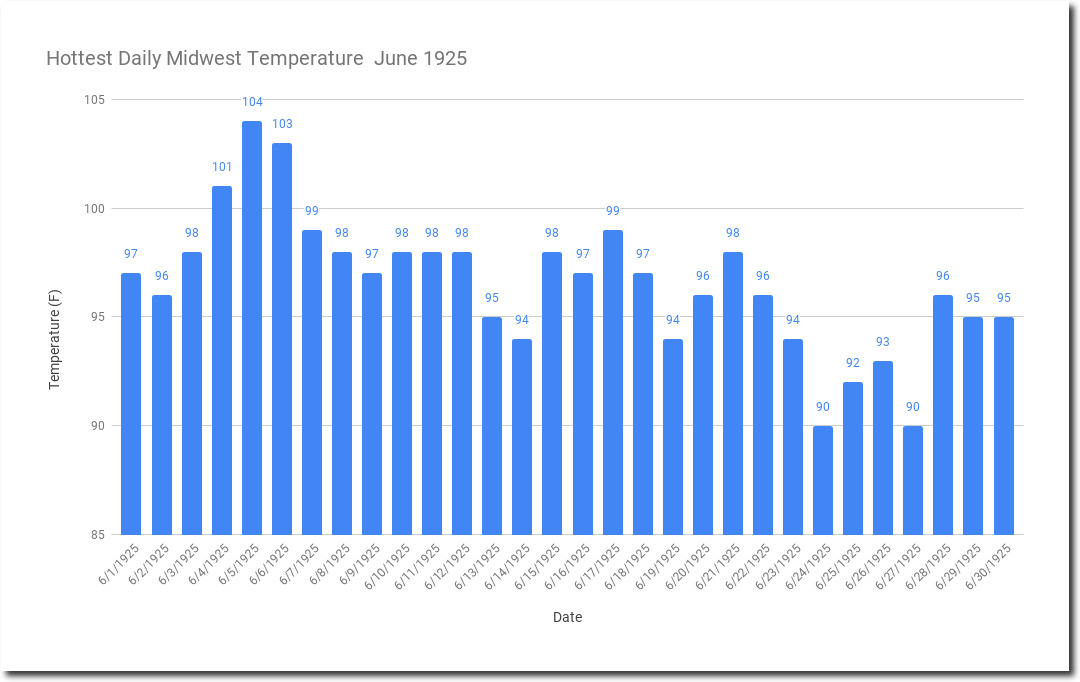
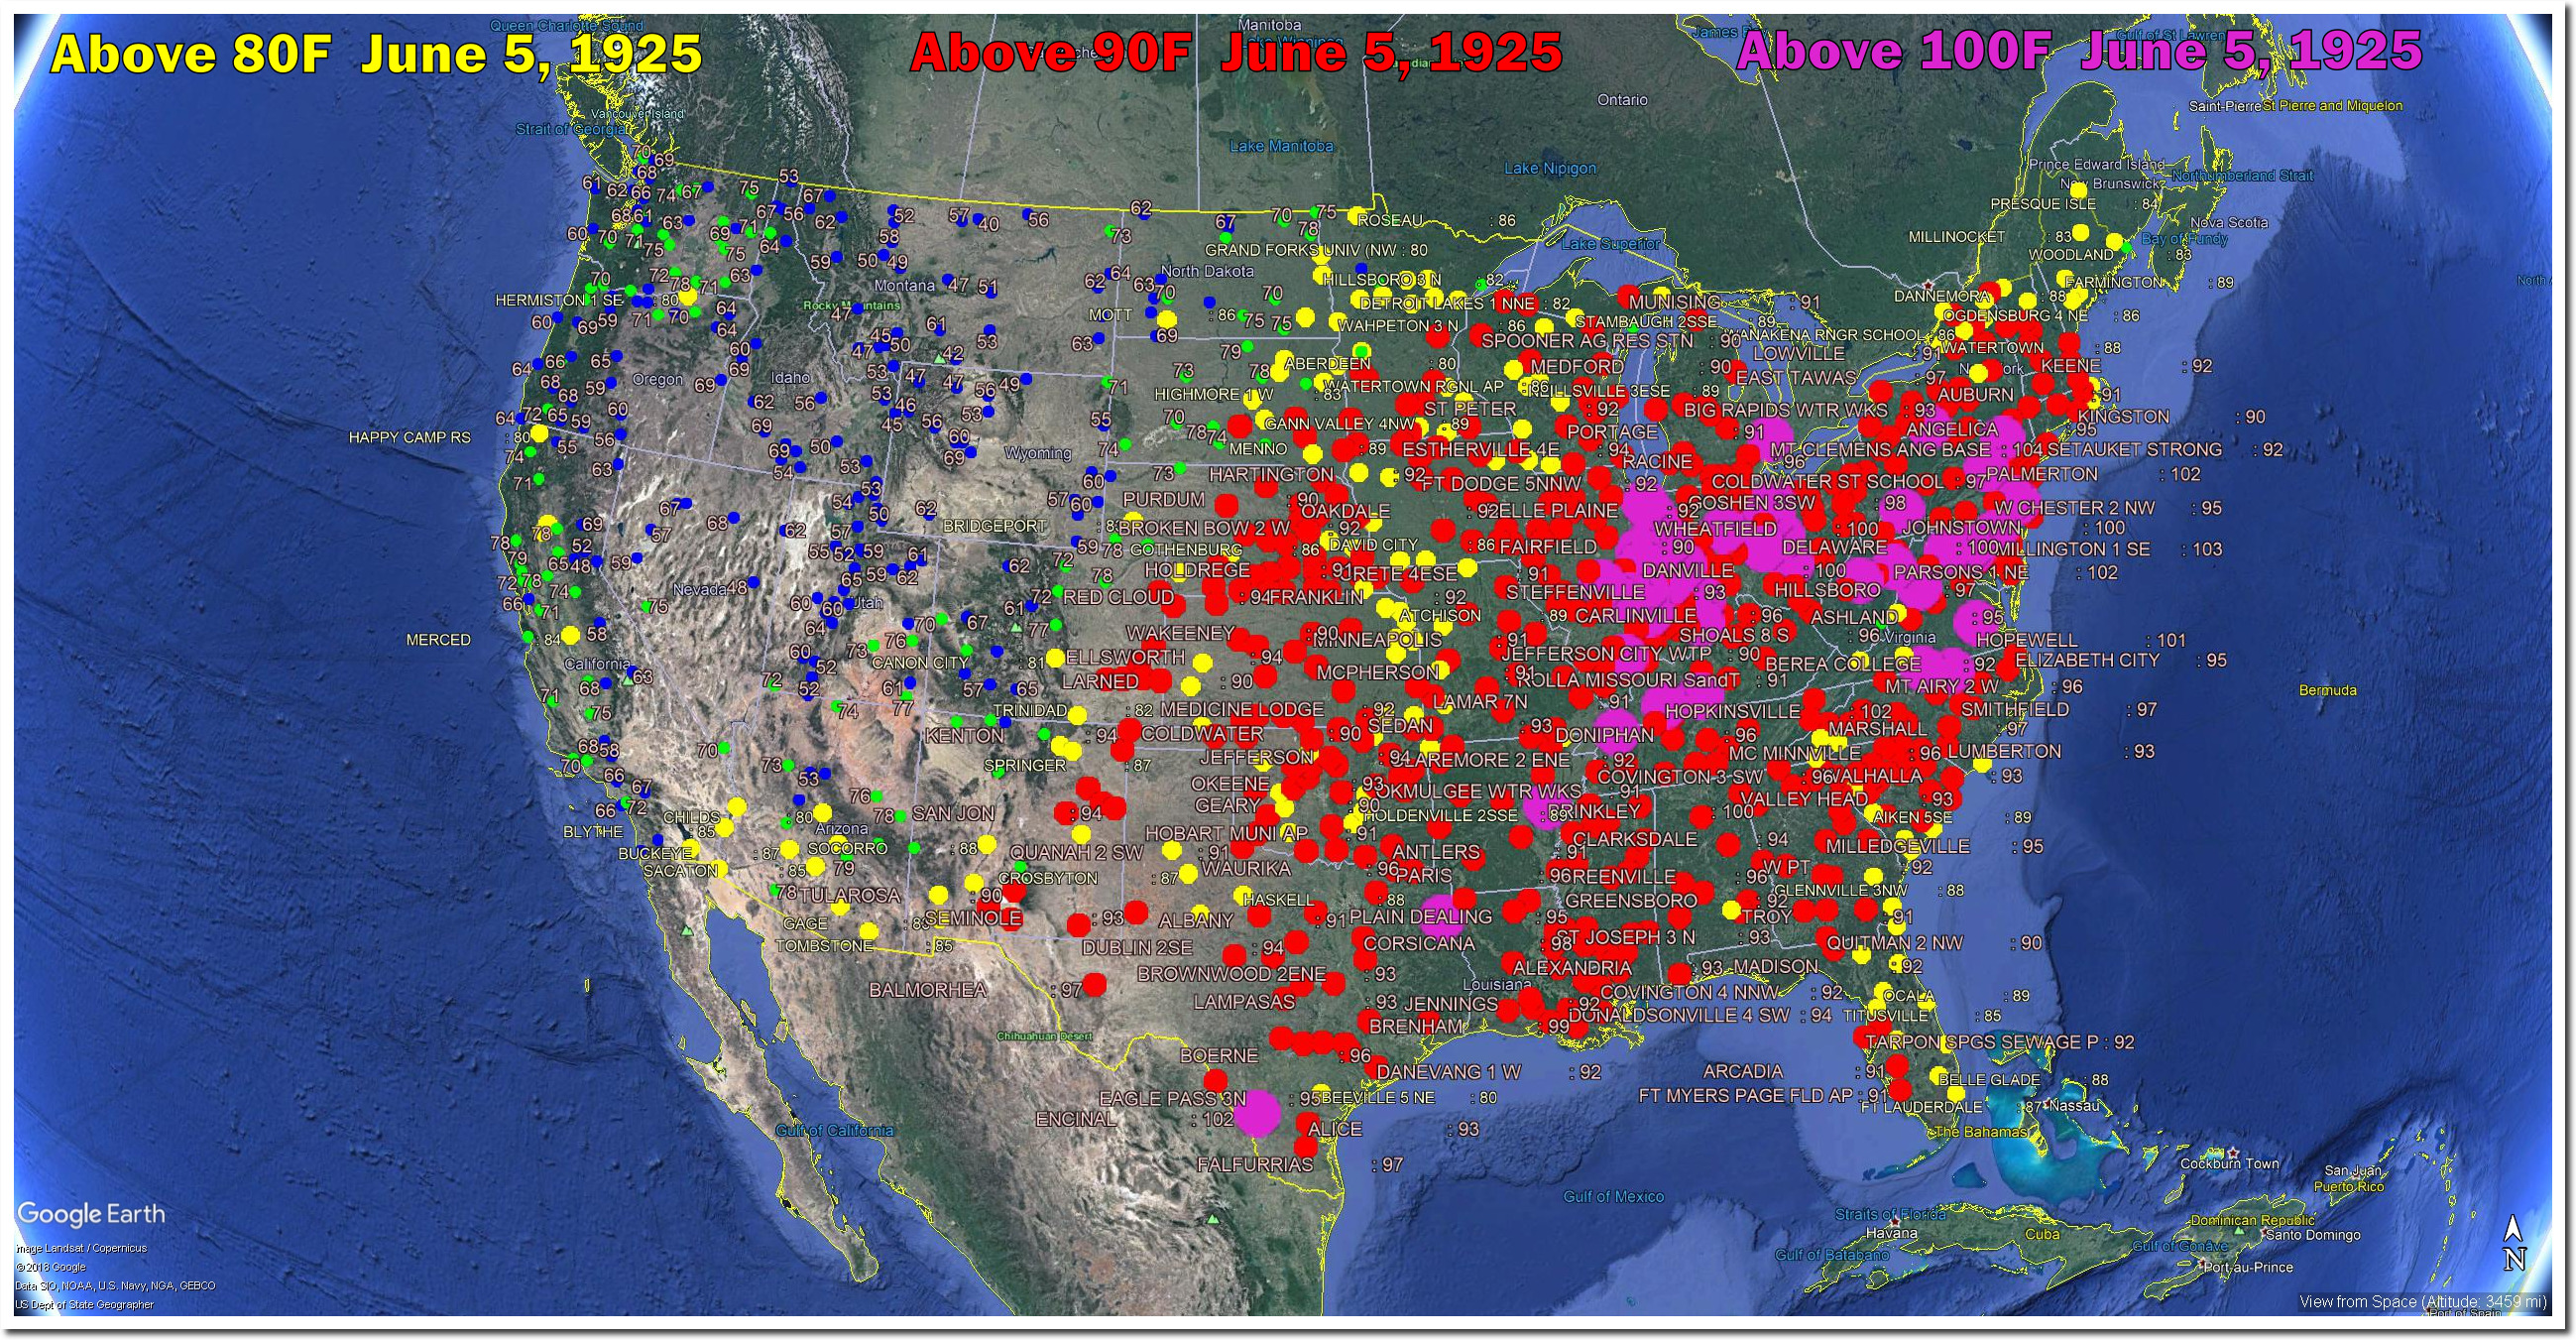
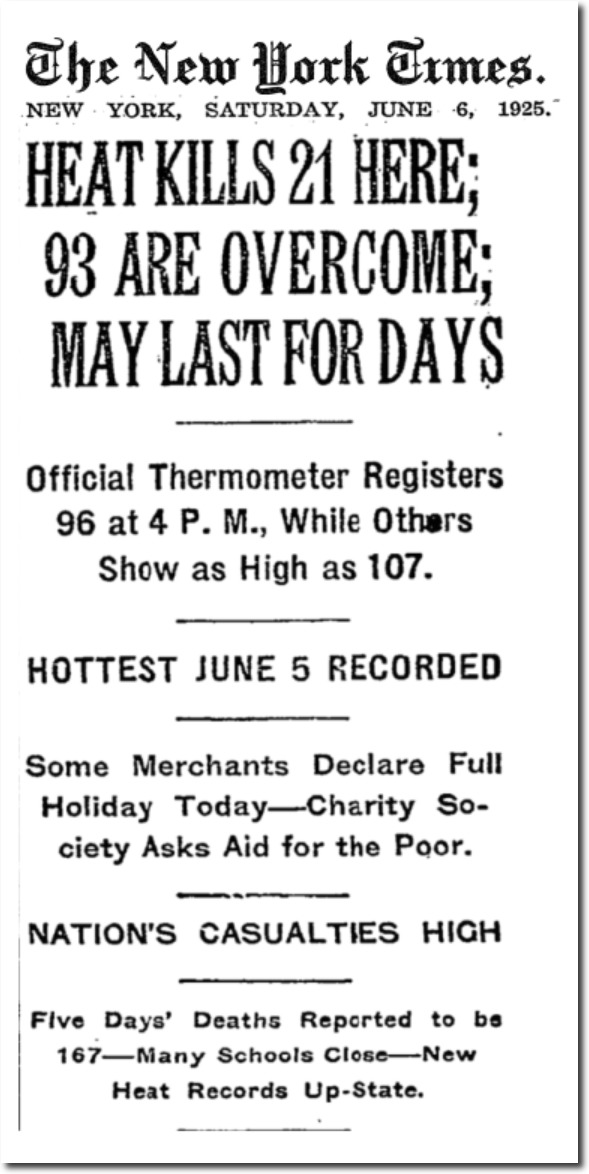
The eastern half of the US experienced a massive heatwave during the first week of June 1925, which peaked on June 5th. Every day that month was over 90 degrees in the Midwest.
On June 5, 1925 it was 104 degrees in Michigan and 100 degree temperatures were widespread from Texas to New York.
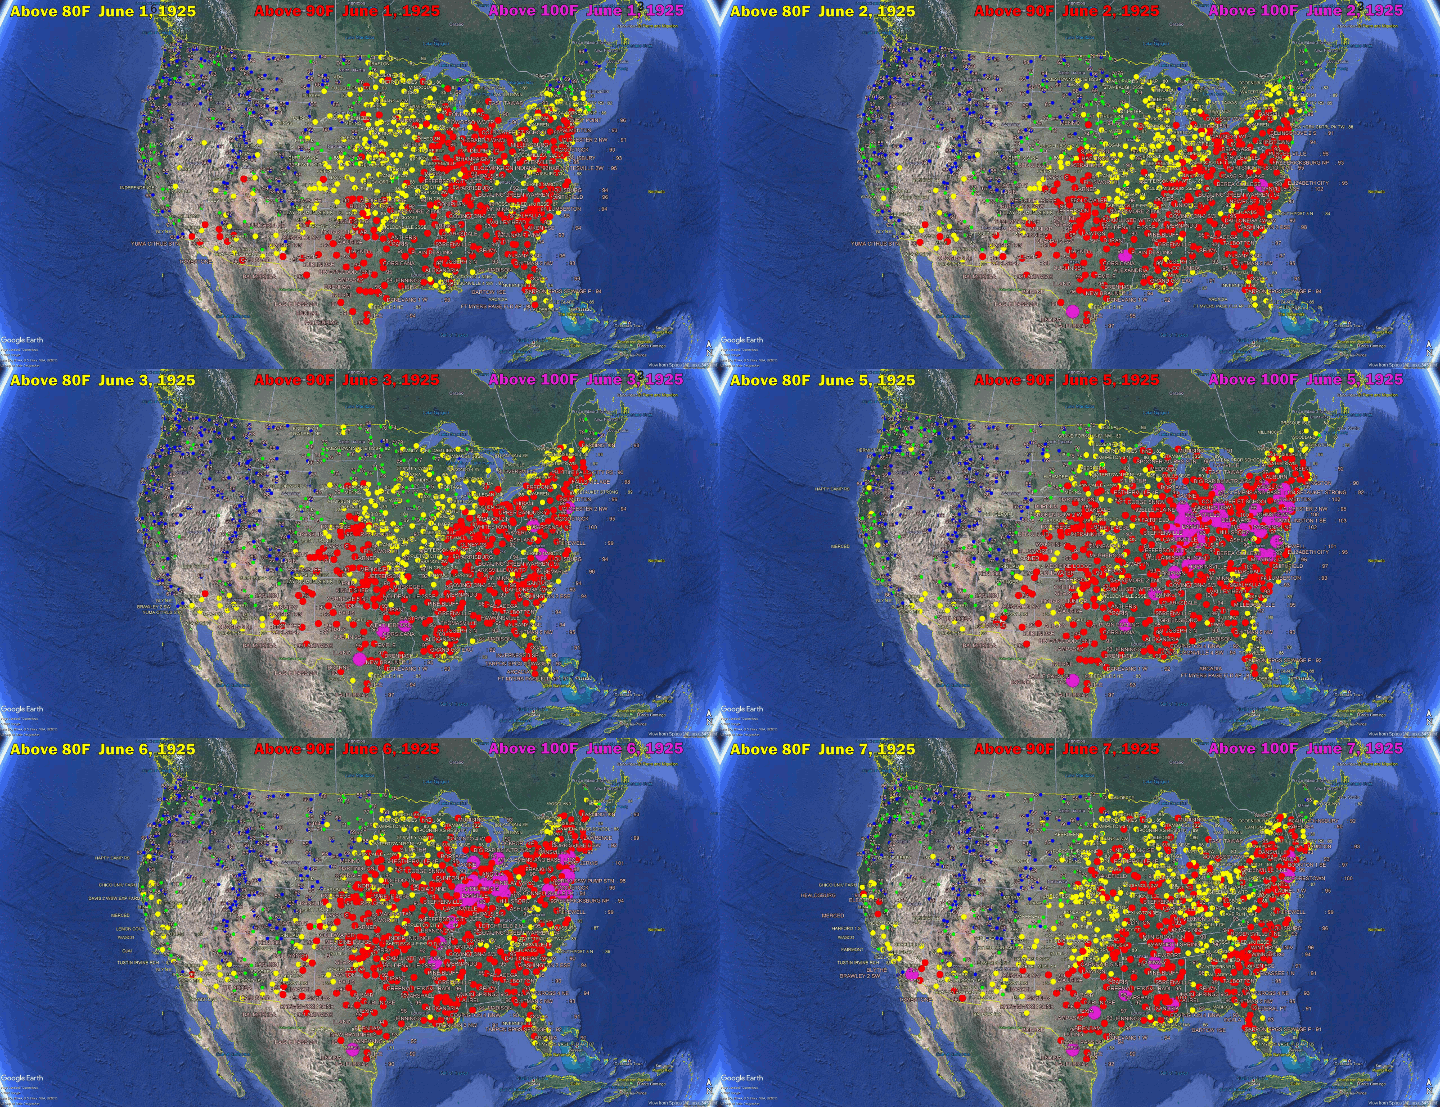
The animation below shows the progression of the heatwave from June 1-7, 1925.
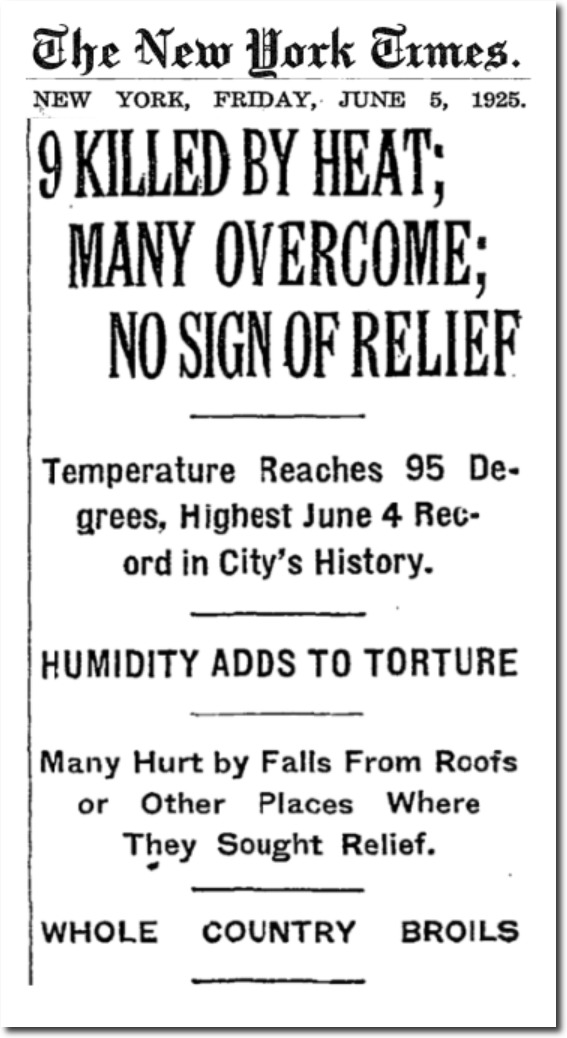
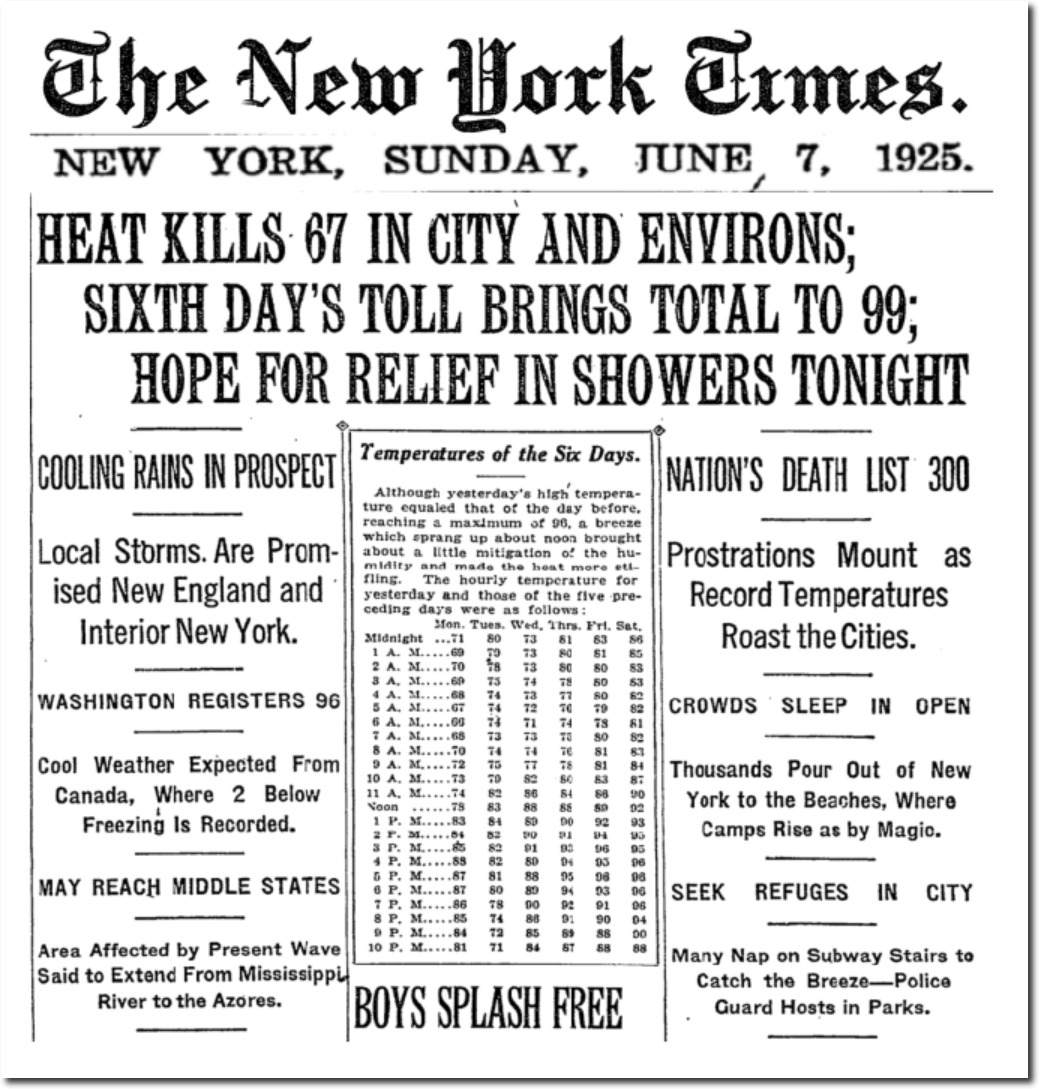
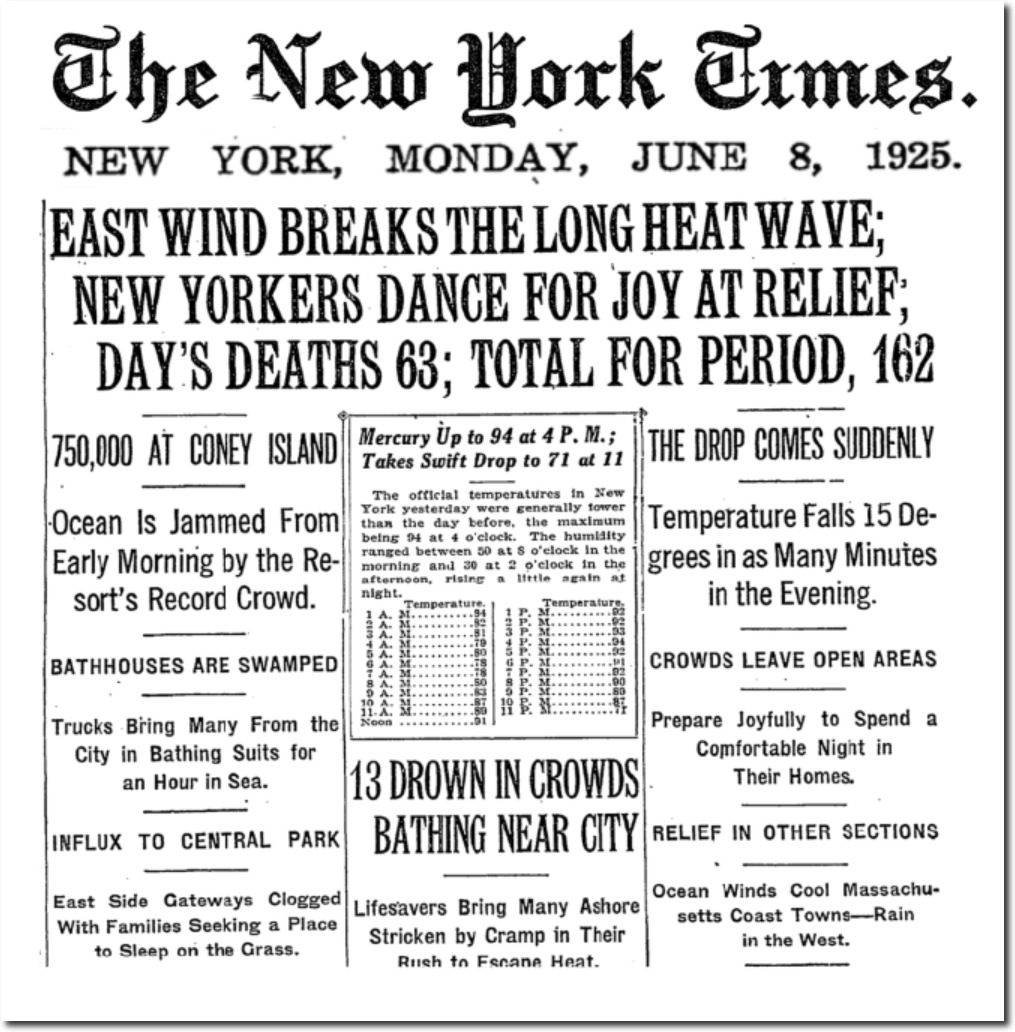
The heatwave killed hundreds of people, including 162 in New York City.
TimesMachine: Friday June 5, 1925 – NYTimes.com
TimesMachine: Saturday June 6, 1925 – NYTimes.com
TimesMachine: Sunday June 7, 1925 – NYTimes.com
TimesMachine: Monday June 8, 1925 – NYTimes.com
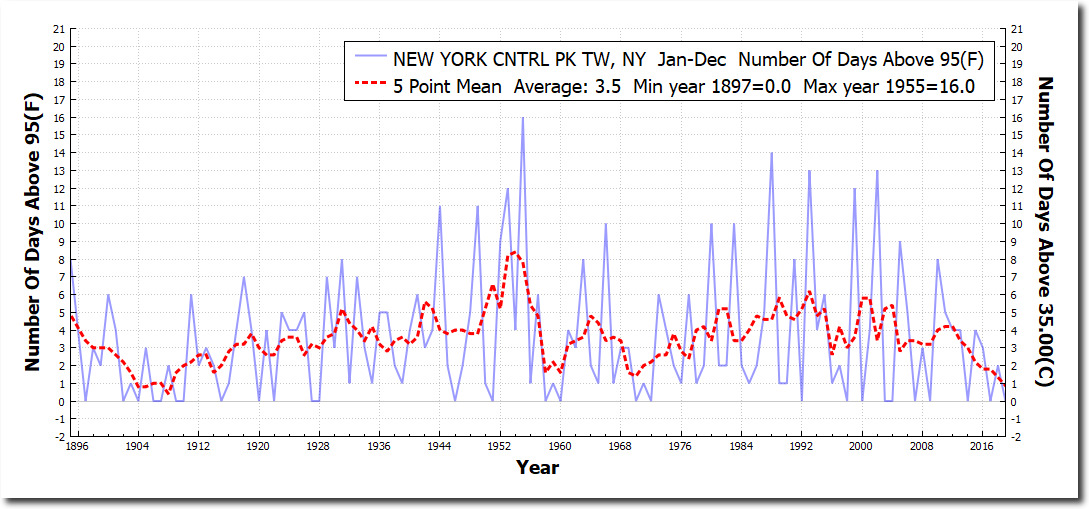
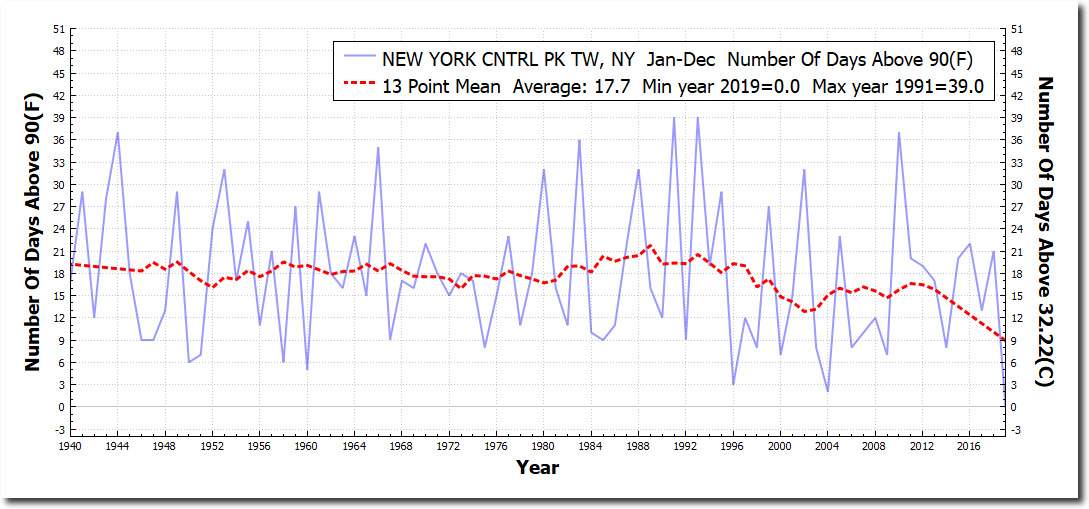
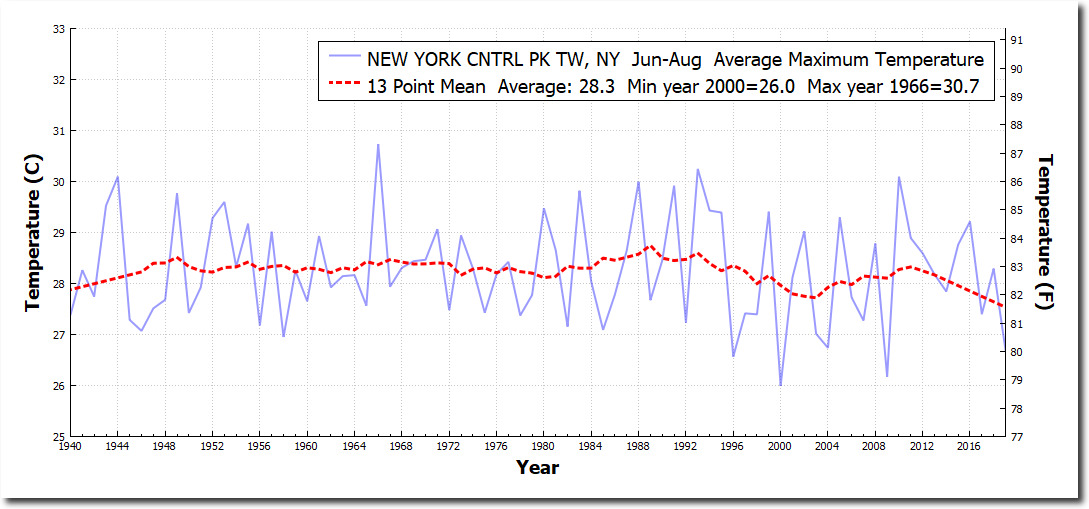
The frequency of 95 degree days in New York City peaked in the 1950s, and have been declining towards record lows over the past 30 years.
The pattern for the entire US also shows a big spike of hot days in the 1950s, with a larger spike in the 1930s, and sharp decline over the past century.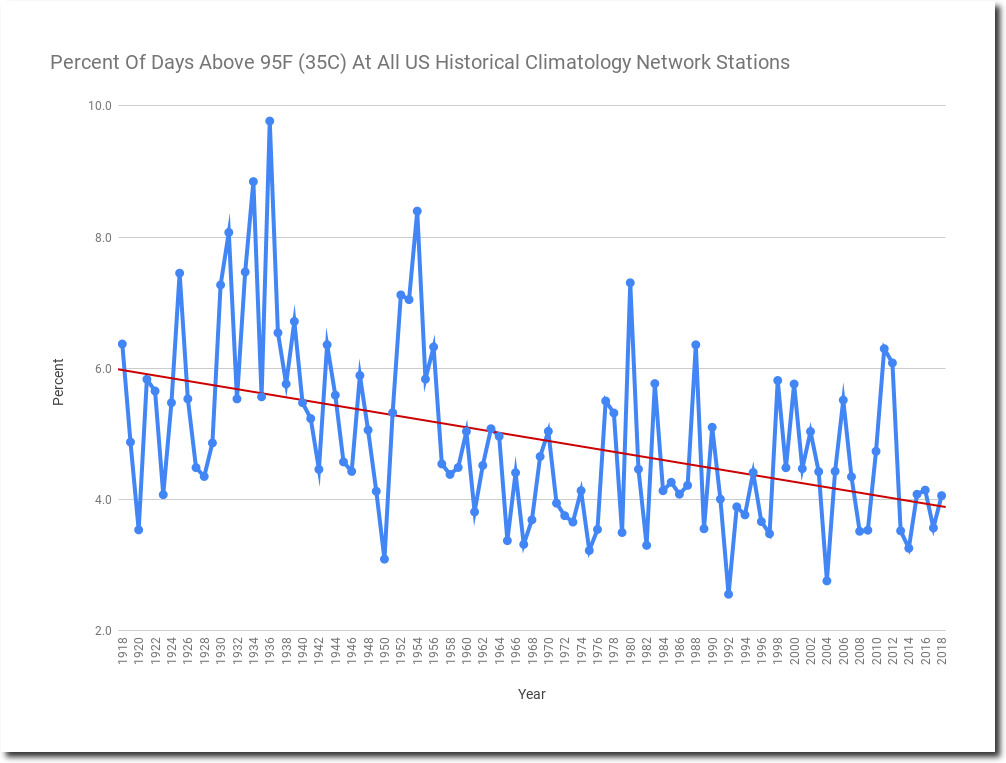
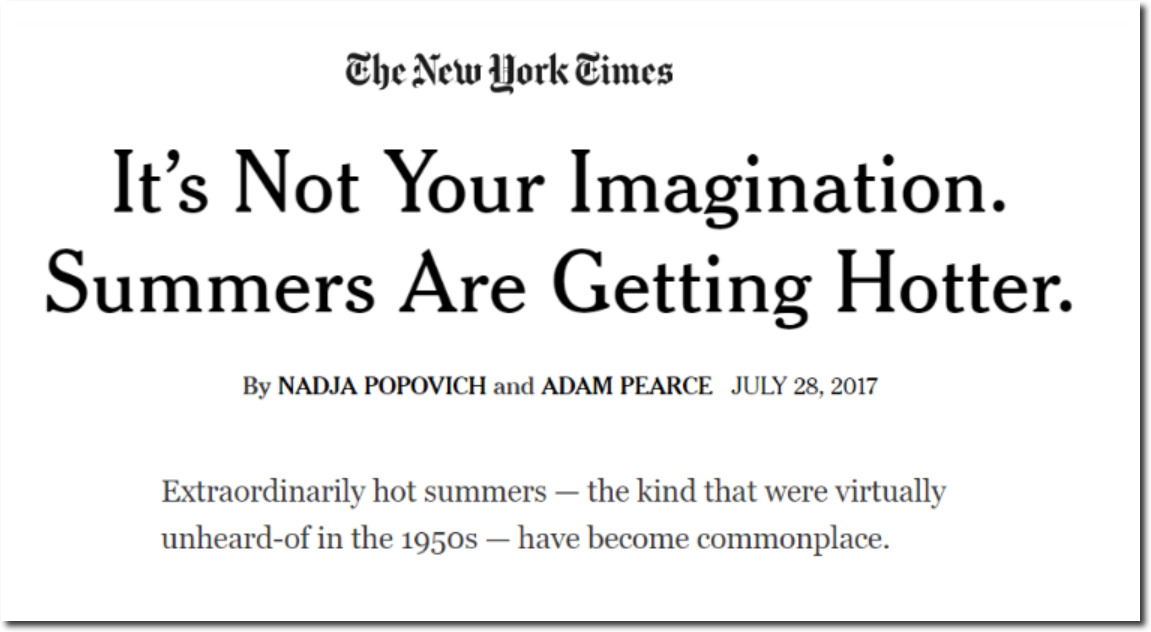
But no lie is too big for the New York Times, so they have erased their own history and now claim the exact opposite of what the data shows.
Extraordinarily hot summers — the kind that were virtually unheard-of in the 1950s — have become commonplace.
It’s Not Your Imagination. Summers Are Getting Hotter. – The New York Times
New York City reached 100 degrees in 1952, 1953, 1954, 1955 and 1957 – but haven’t been over 100 degrees in the past seven years. Summers are getting cooler in New York, but the New York Times understands that their readers will believe anything they say, and this they can get away with any misinformation which suits their agenda.
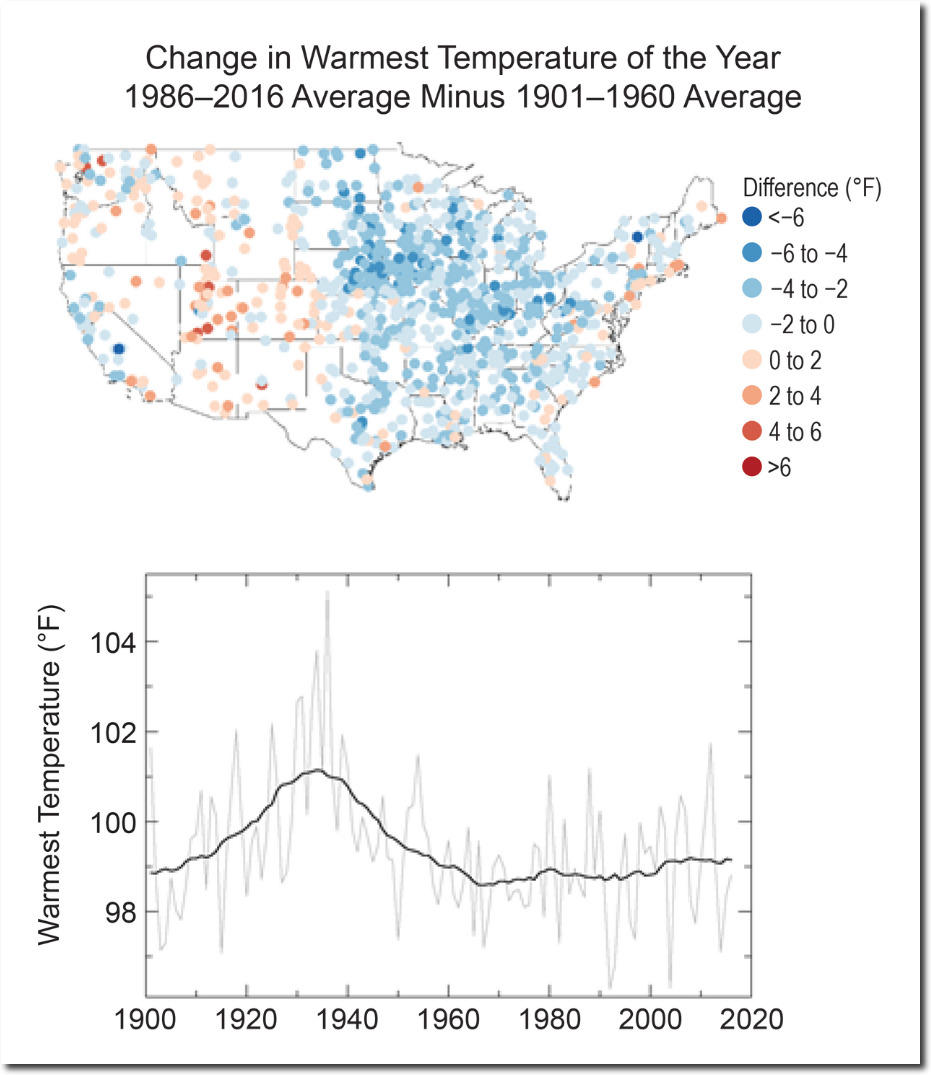
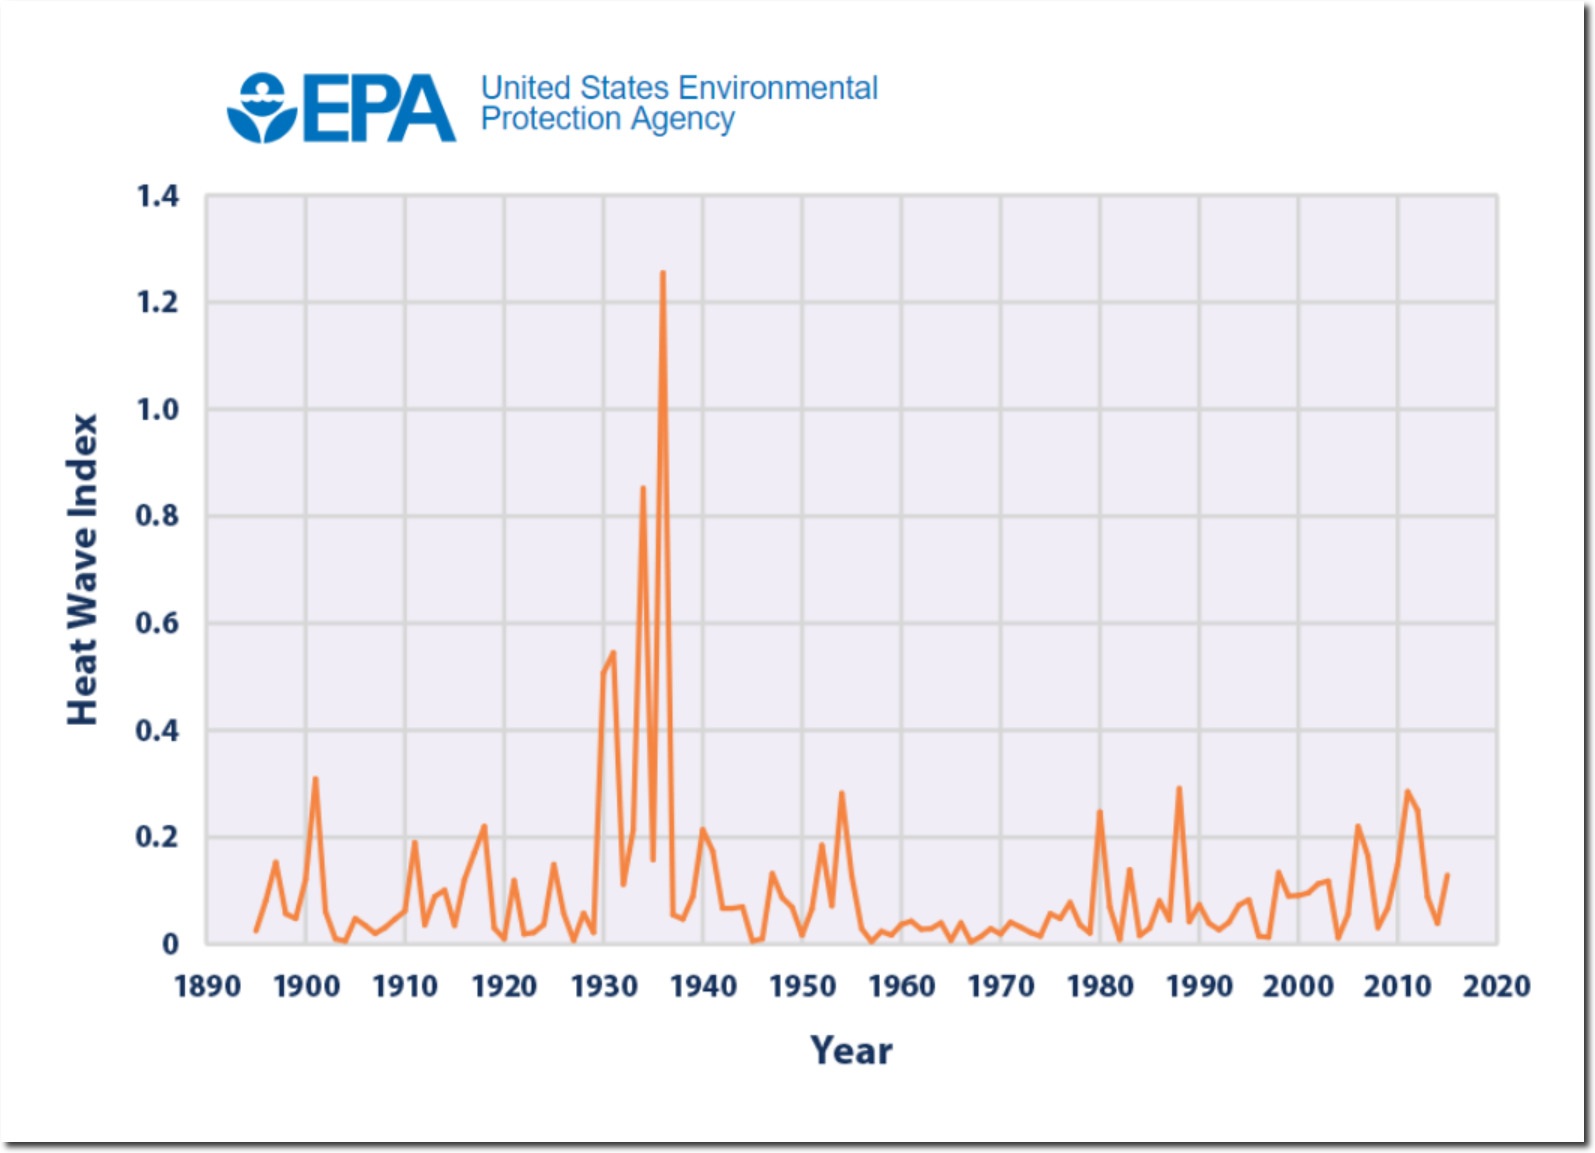
The US Climate assessment shows the same thing as my graphs. Heatwaves peaked in the 1930s and 1950s.
Temperature Changes in the United States – Climate Science Special Report
The EPA shows the same thing.
If we had a free press in the US, this sort of misinformation would not stand. But they have a virtual brick wall erected to keep factual information about climate from being published by the press.

