
The 1990 IPCC Report showed Arctic sea ice increasing since the early 1970s, but the 2001 report reversed the increase into a decrease.


archive.ipcc.ch/ipccreports/tar/wg1/062.htm


Part of this treachery was including the largest freshwater lakes in the world into their sea ice calculations.
Updated digitised ice data for the Great Lakes are also included

They also erased the Medieval Warm Period And Little Ice Age, and replaced it with the Hockey Stick.


Climate Change 2001: The Scientific Basis
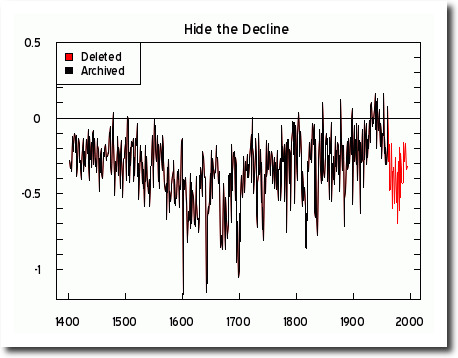
An important part of this process was to hide the decline shown in Briffa’s reconstruction, which closely resembled the 1974 NCAR graph.

21 Jul 1974, 13 – The Des Moines Register at Newspapers.com

This required erasing the “1940’s blip”


For those who ask :
The first graph from IPCC 1991 is on page 224, figure 7.19 (“Figure 7.20 : (a) Northern Hemisphere. Data from NOAA (USA).”)
The second graph from IPCC 2001 is on page 125 (“Figure 2.14: Monthly Arctic sea-ice extent anomalies, 1973 to 2000, relative to 1973 to 1996.”)
In 2001, IPCC added under the graph :
“The data are a blend of updated Walsh (Walsh, 1978), Goddard Space Flight Center satellite passive microwave (Scanning Multichannel Microwave Radiometer (SMMR) and Special Sensor Microwave/Imager (SSM/I)) derived data (Cavalieri et al.,1997) and National Centers for Environmental Prediction satellite passive microwave derived data (Grumbine, 1996). Updated digitised ice data for the Great Lakes are also included (Assel, 1983).”
Ok… That’s cristal clear…
DOOOOOOOOOMMMMMM!!!!!!!!!!