
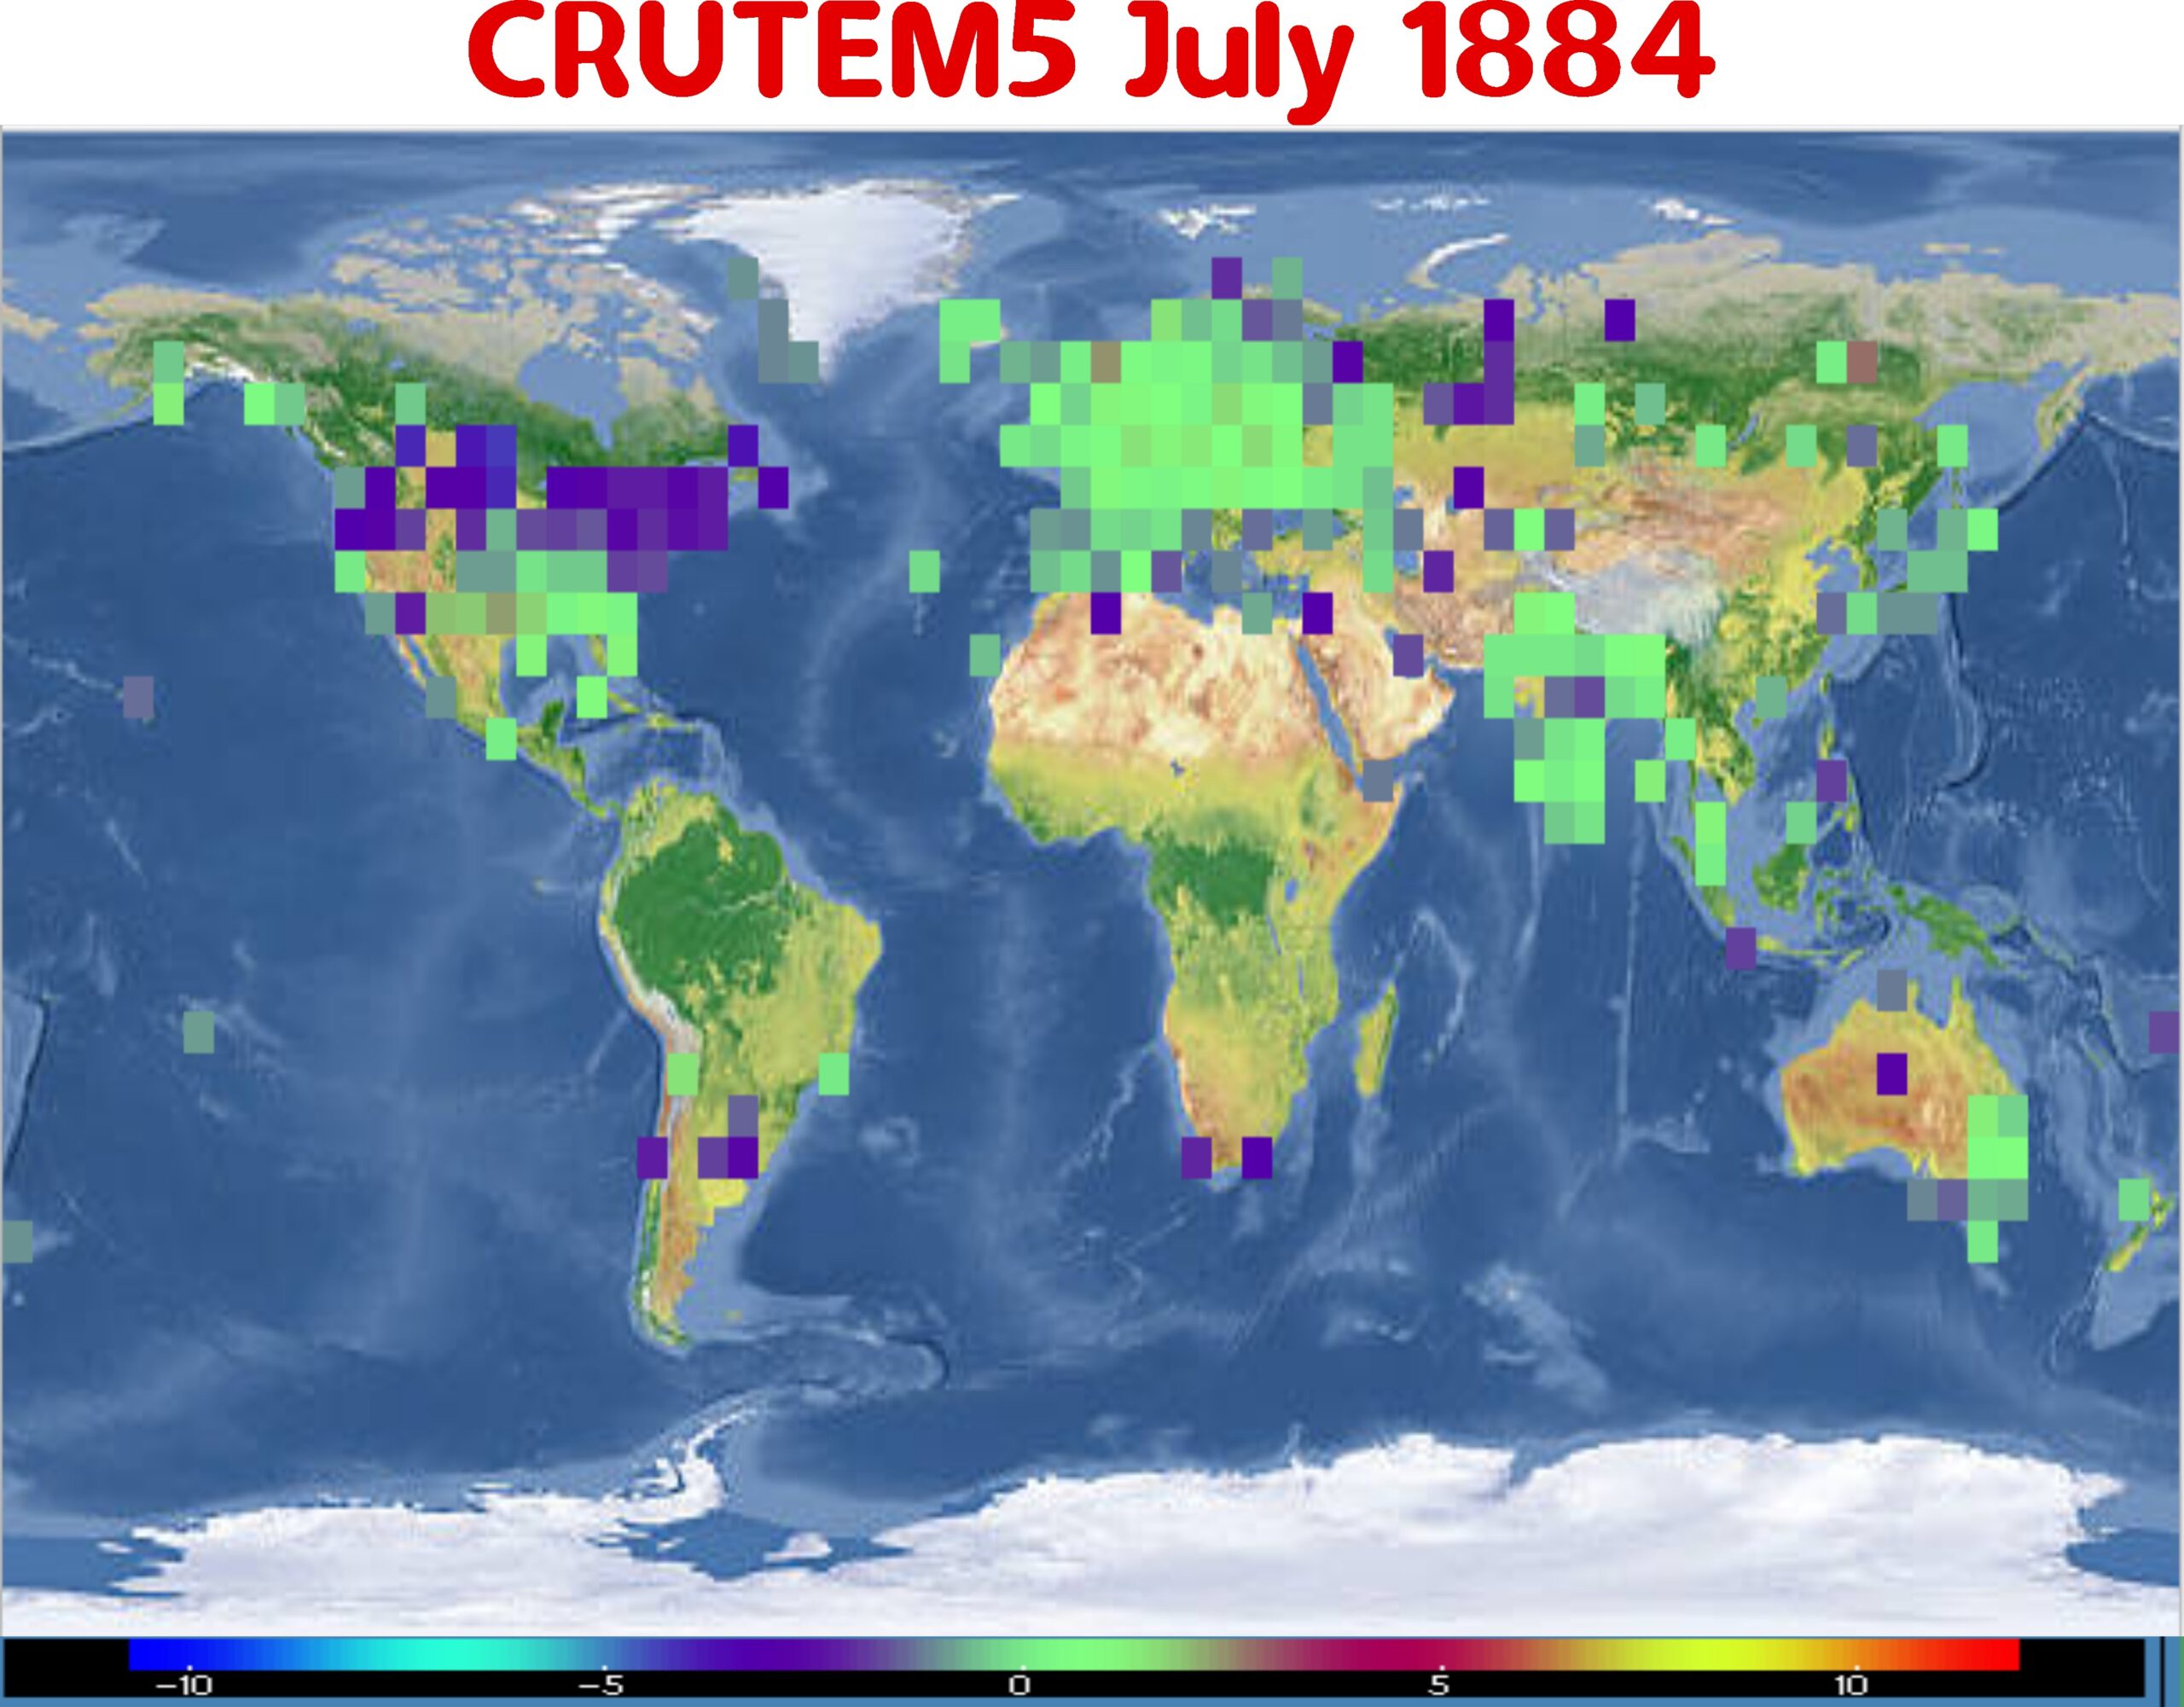
NASA has determined global temperatures very precisely from the year 1884, with most of the world cold, but a noticeable hot spot in west Africa.


Global Temperature | Vital Signs – Climate Change: Vital Signs of the Planet
They only have data from one station in west Africa from 1884, and very little for most of the rest of the world


The one station they have from 1884 in west Africa is at Freetown, Sierra Leone.


You can see hot temperature in 1884, though they only have seven months of records from that year.


But how did they determine that the rest of Africa was cold?
Five independent groups came to the same precise conclusion as NASA.


I trust absolutely nothing coming from NASA, since the Columbia Disaster for the following reason:
They had video of a block of insulating foam breaking off the main tank and hitting the wing root of the shuttle after lift off, and with the vehicle velocity was roughly 650 mph.
These “rocket scientists” determined or judged that because the foam was low density it could not do any significant damage. Furthermore they calculated it had a mass of 10 lbs, or 4.54 kg.
But, but, elementary ballistic energy which should be rocket scientist 101, says the following: Energy = 1/2mv²
So 650 mph is 291 m/s. The energy equation is thus 0.5 x 4.54 x 291 x291 = 192,226 Joules. The density is irrelevant to the ballistic energy of the foam block impacting the wing root.
For comparison we can look at 50 caliber bullets. There are two flavors, a light one and a heavier one. The light one has a ballistic energy of 12,164 Joules, and the heavier one 20,240 Joules.
So this foam block impacting the shuttle wing root had 9.5 times more energy than the heavier 50 cal, and 15.8 times more energy than the lighter 50 cal bullet!
Yet this gaggle of so called rocket scientists figured the foam block would do no damage. But their rudimentary arithmetic about ballistics says otherwise. And indeed many still argued the foam block could not do damage, until they ground tested a foam block fired from an air cannon at a wing root section and it blew a hole 2 feet in diameter!
https://www.youtube.com/watch?v=ySiyzJEi01M (Foam test blows hole in wing)
So when a 2 minute calculation with rudimentary arithmetic predicted the outcome, yet it took these idiots a million bucks with a replication test to acknowledge the math was right, I (nor anyone) cannot ever trust NASA or any science body again!
You have made a fatal assumption.
That foam block would have been travelling at 650mph along with the rest of the shuttle an instant before it broke off. Then when it broke off, the wind at that altitude would be very little compared to the wind at that speed at sea level. This means the impact speed of the foam block against the wing would be very little. Your assumption that the impact speed of the foam block against the wing being 650mph is ridiculous.
The last graph shows the results from 5 different agencies and they are all in agreement on the warming and they all report the same findings
The problem is they all get their data from one source. Each one of those agencies do not have their own independent weather stations,they have ONE source. So of course their graphs all follow the same patteren
With such low coverage they couldn’t have independently come up the same global average temperature, because they need to fill in the missing areas with something.
They clearly had to agree on a lot of things to have results that close. But the fact that they accept the same altered data set is sufficient for me to dismiss their results.
It seems that they have realised that it is easier to lie when all
follow the same pattern of lies.
(the agencies have been so homogenised that they act like one).
Imagine there is little to no data
and 5 different agencies should come to conclusions .
How likely is it that a tiny bit of data can lead to the same results when any outcome is possible?
At least one of them should have come out and admitted that they are not able to get any results with literally no data to work.
Nice to see that experts from 100 – 150 years ago were too dumb to read thermometers ,
but todays NASA experts can obviously read those from 1884 (such a pre Orwellian year) – especially those that did not exist.
Also interesting to see that the global drought of the 1870ies
ended with a supercold Africa just a few years later.
Well, of course they had a hot spot in Freetown in 1884. Their thermometer was situated right next to the runway at the Freetown International Airport. Apparently the world’s very first international airport, dontcha know? 😉
And, as we all know grid cells in the vicinity of airport runways are the most accurate indicators of just about anything.
Isn’t this just petitio principii, i.e. begging the question? Interpolate to find the missing data on the basis that global warming exists, and hey presto, the results ‘prove’ global warming.
The gist of your message I agree.
But, don’t you actually have to have some surrounding data points from which to make the interpolation? It looks like they are simply making up a lot of it out of thin air.
My first digital SLR, a Fujifilm S2 Pro, had a 6 megapixel CCD. Rather than rectangle matrix of photosites, like most, Fujifilm’s proprietary CCD had a grid of honeycomb photosites from which more data could be drawn between those. The device had lots of surrounding data from which to make the mathematical calculations to create extra, similar data. It doubled the output images to 12mp and also somehow helped with dynamic range of the output images.
But, those photosites had all kinds of surrounding data from which to make the interpolations. I’m just not so sure about all the corruption we see going on in climate seance. Interpolation? Or simply making it up?
As I recall we had a methodology for interpolation between data points to make a thermal grid. Of course, you do have to have sufficient data points to make the result reasonable, i.e. you can’t apply that type of technique thoughtlessly. Some common sense needs to be involved.
When inappropriately applied, this technique allows the falsification of data, while appearing to be scientific.
Bingo.
“They only have data from one station in west Africa from 1884, and very little for most of the rest of the world”
But, it was a very good thermometer.
I bet they still adjusted the data for the one thermometer.