Disrupting the Borg is expensive and time consuming!
Google Search
-
Recent Posts
- Analyzing The Western Water Crisis
- Gaslighting 1924
- “Why Do You Resist?”
- Climate Attribution Model
- Fact Checking NASA
- Fact Checking Grok
- Fact Checking The New York Times
- New Visitech Features
- Ice-Free Arctic By 2014
- Debt-Free US Treasury Forecast
- Analyzing Big City Crime (Part 2)
- Analyzing Big City Crime
- UK Migration Caused By Global Warming
- Climate Attribution In Greece
- “Brown: ’50 days to save world'”
- The Catastrophic Influence of Bovine Methane Emissions on Extraterrestrial Climate Patterns
- Posting On X
- Seventeen Years Of Fun
- The Importance Of Good Tools
- Temperature Shifts At Blue Hill, MA
- CO2²
- Time Of Observation Bias
- Climate Scamming For Profit
- Climate Scamming For Profit
- Back To The Future
Recent Comments
- Bob G on Analyzing The Western Water Crisis
- Bob G on Analyzing The Western Water Crisis
- Bob G on Analyzing The Western Water Crisis
- arn on Analyzing The Western Water Crisis
- Scott Allen on Analyzing The Western Water Crisis
- conrad ziefle on Analyzing The Western Water Crisis
- conrad ziefle on Analyzing The Western Water Crisis
- Bob G on Analyzing The Western Water Crisis
- Bob G on Analyzing The Western Water Crisis
- Bob G on Gaslighting 1924
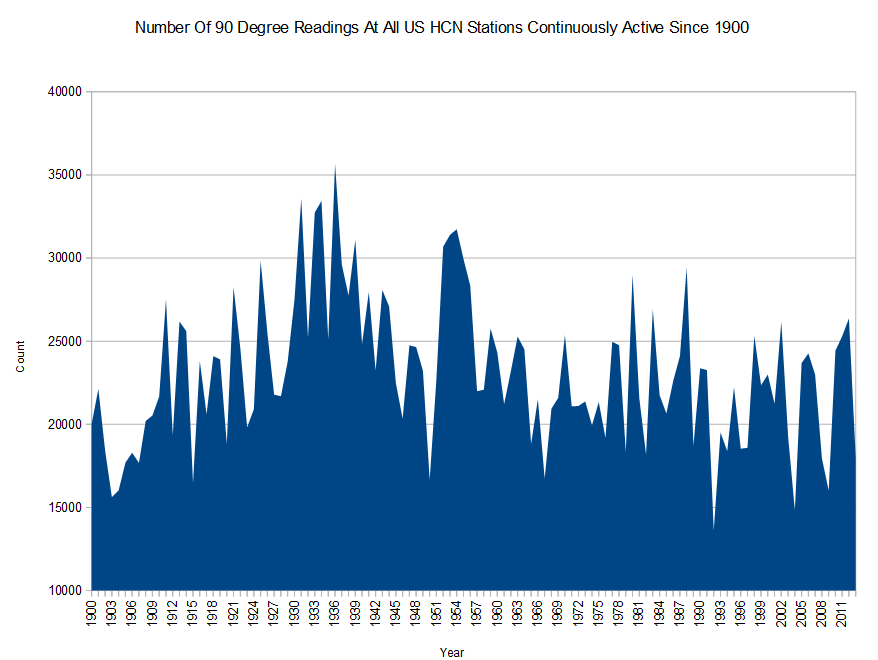
Frequency Of US 90 Degree Temperatures Has Dropped Sharply Over The Last 80 Years
This entry was posted in Uncategorized. Bookmark the permalink.


Scott Bixby (Is he related to Bill Bixby of MF Martian fame?) say we should all just “let it go” Steven. I think he has a few kangaroos loose in the top paddock.0
http://www.thedailybeast.com/articles/2014/02/12/from-snowy-atlanta-to-sunny-sochi-this-winter-is-all-about-global-weirding.html
Last year CSIRO published a detailed study on heatwaves, which besides a lot on Australia, included Moscow and Newark (2003). Interesting in many ways especially as the Australian data goes back 100 years.
http://www.cawcr.gov.au/publications/technicalreports/CTR_060.pdf
I would have thought that this is a check-mate graph in any serious debate on the subject:
http://climateaudit.org/2013/12/09/does-the-observational-evidence-in-ar5-support-itsthe-cmip5-models-tcr-ranges/