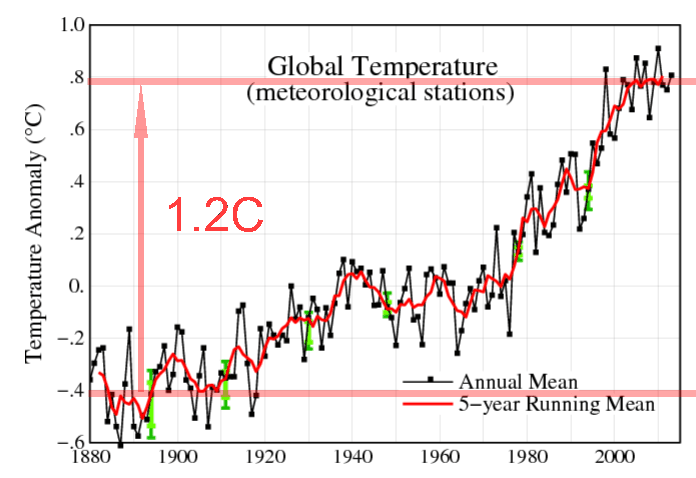
We are all familiar with this NASA graph, which forms the basis of the hockey stick. It shows about 1.2C warming from 1880 to 1998.
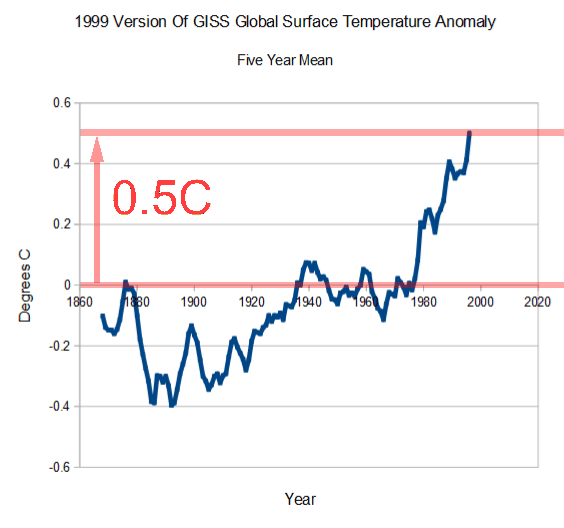
But their graphs didn’t always look like this. In 1999 they showed no net warming from the 1870’s to the 1970’s, and a total of 0.5C warming from the 1870’s to 1998. NASA has more than doubled hockey stick warming since 1999. Clever of them to not show warm pre-1880 temperatures in their current graph.


It took a couple looks to see what you meant. The first graph is the current graph while the second graph is the 1999 graph.
So in fifteen years they have ‘Adjusted’ the temperatures so as to double the ‘warming’
Got it.
(you might want a better year label on the first graph.)
Once they start messsing with the data (cheating), all bets are off. You cannot believe a word of what NASA/NOAA says. It is purely political propaganda.
It’s standard practice in climate science. If the real data doesn’t match the hypothesis, change the real data. It’s seems to work quite well. Hadcrut does it as well. It’s so wellaccepted, that would economies are changed based on the results.
And yet they do not offer any justification for the massive adjustments beyond “we are NASA, so trust us”.
Maybe if we’re lucky, Mikey Mann turn his tobacco lawyer loose to sue NASA for a cheap knock-off of his signature “Hockey stick”.
NASA going above and beyond!!
They just tweeted that a researcher proved there is 30-50% less snow on the arctic sea ice cap.
And somehow they want to be taken seriously. Geez, without Russian rocket motors there isn’t even a S in NASA!
Who the hell is running that show- a bunch of clowns?
Steve, which version GHCN is this? Or is this raw data?
Current GISS is based on V3. Not sure what the 1999 version was based on.
Right, ok, is it possibly this: http://www.ncdc.noaa.gov/ghcnm/ Version 2?
They’re trying to clean up medical research maybe they should start with climate science at NASA.
link- http://phys.org/news/2014-08-personal-scientific-misconduct.html