
Experts say the Arctic is super-hot and the ice is melting, but mysteriously the hot Arctic air becomes very cold when it moves south.
I just bought my plane ticket to the UK for December.
Experts say the Arctic is super-hot and the ice is melting, but mysteriously the hot Arctic air becomes very cold when it moves south.
I just bought my plane ticket to the UK for December.
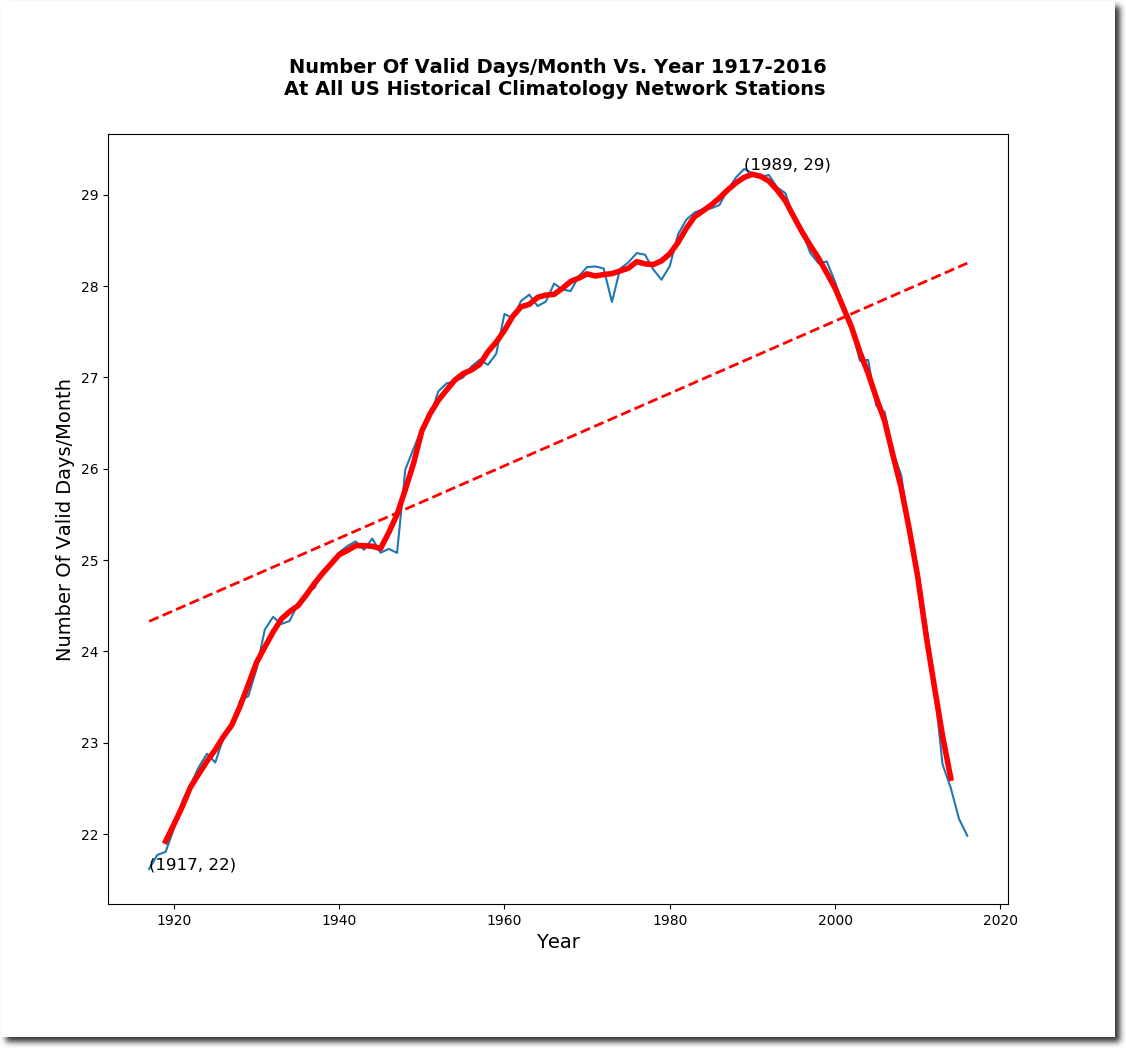
I did some more research on my theory that the NOAA later winters hockey stick since 1990 is due to missing data. In the first graph below I plotted the number of valid days per month for the 100 stations with the fastest trend towards a later winter. As I expected, these stations have dropped from thirty days of valid temperatures per month in 1990, to six days per month now.
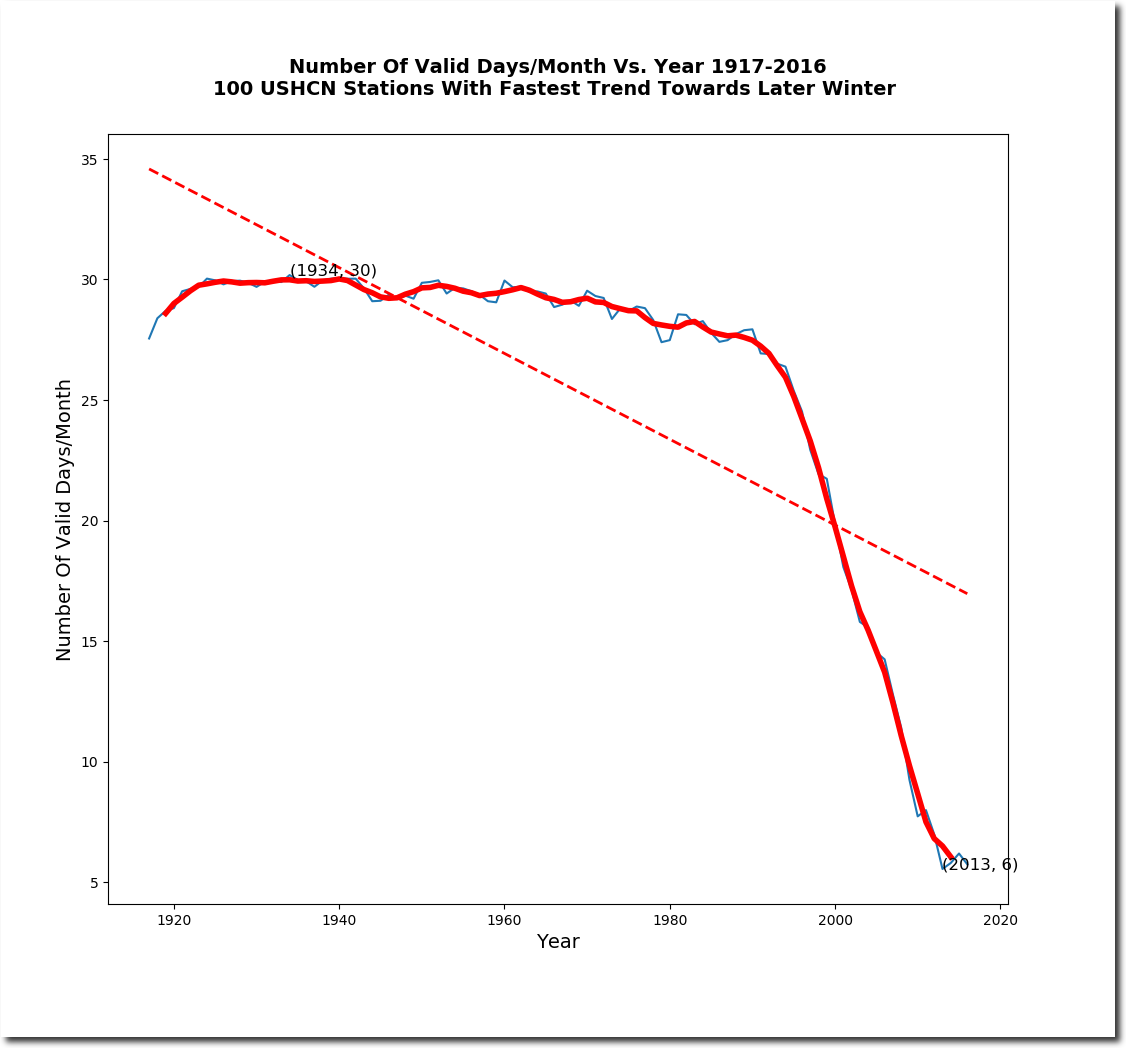
This confirms my suspicion that the apparent trend towards later winter since 1990 is largely due to data loss. If a station is missing temperature readings in October and November, that will cause the average date of the first freeze to come later.
Stations used in this analysis :
| FREMONT 5 NW | OR | US | USC00353095 |
| WEST YELLOWSTONE | MT | US | USC00248857 |
| FORKS 4 NNE | MT | US | USC00243089 |
| FORTINE 1 N | MT | US | USC00243139 |
| WELLSBURG WTR TRMT PL | WV | US | USC00469368 |
| FRANKLIN | NE | US | USC00253035 |
| KALAMAZOO STATE HOSPITAL | MI | US | USC00204244 |
| CHELSEA | VT | US | USC00431360 |
| COLLBRAN | CO | US | USC00051741 |
| GREENVILLE 2 NE | PA | US | USC00363526 |
| WAHPETON 3 N | ND | US | USC00329100 |
| CORTLAND | NY | US | USC00301799 |
| HETTINGER | ND | US | USC00324178 |
| JOHNSTOWN | PA | US | USC00364385 |
| CORINNE | UT | US | USC00421731 |
| LAKE SPAULDING | CA | US | USC00044713 |
| BROCKPORT | NY | US | USC00300937 |
| PALMERTON | PA | US | USC00366689 |
| ASHLAND EXP FARM | WI | US | USC00470349 |
| WOODSTOCK | MD | US | USC00189750 |
| LOCKPORT 4E | NY | US | USC00304844 |
| FAYETTE 4 SW | MI | US | USC00202737 |
| KLAMATH FALLS 2 SSW | OR | US | USC00354506 |
| CAMBRIDGE WATER TRMT P | MD | US | USC00181385 |
| DELAWARE | OH | US | USC00332119 |
| CAMBRIDGE CITY 3 N | IN | US | USC00121229 |
| ROSEAU | MN | US | USC00217087 |
| GRAFTON | ND | US | USC00323594 |
| FREDERICKSBURG NP | VA | US | USC00443192 |
| MILLINGTON 1 SE | MD | US | USC00185985 |
| OWINGS FERRY LANDING | MD | US | USC00186770 |
| WHEATFIELD | IN | US | USC00129511 |
| LUSK 2 SW | WY | US | USC00485830 |
| MUNISING | MI | US | USC00205690 |
| HERMISTON 1 SE | OR | US | USC00353847 |
| MILFORD 2 SE | DE | US | USC00075915 |
| STEAMBOAT SPRINGS | CO | US | USC00057936 |
| MEDICINE LODGE | KS | US | USC00145173 |
| COLVILLE | WA | US | USC00451630 |
| HEBER | UT | US | USC00423809 |
| LEWISTON | ME | US | USC00174566 |
| THOMPSON | UT | US | USC00428705 |
| QUINCY | CA | US | USC00047195 |
| HOBART 2 WNW | IN | US | USC00124008 |
| SHELBYVILLE 1 E | KY | US | USC00157324 |
| TAUNTON | MA | US | USC00198367 |
| GLOVERSVILLE | NY | US | USC00303319 |
| FOSSTON 1 E | MN | US | USC00212916 |
| MOTT | ND | US | USC00326155 |
| VACAVILLE | CA | US | USC00049200 |
| PLAIN DEALING | LA | US | USC00167344 |
| GOLDENDALE | WA | US | USC00453222 |
| DARLINGTON | WI | US | USC00472001 |
| TELLURIDE 4WNW | CO | US | USC00058204 |
| FRANKFORT DOWNTOWN | KY | US | USC00153028 |
| KENTON | OK | US | USC00344766 |
| COEUR D’ALENE | ID | US | USC00101956 |
| MERRIMAN | NE | US | USC00255470 |
| TUCSON WFO | AZ | US | USC00028815 |
| MILLINOCKET | ME | US | USC00175304 |
| LAKEVIEW 2 NNW | OR | US | USC00354670 |
| MORRISVILLE 6 SW | NY | US | USC00305512 |
| MCLEANSBORO | IL | US | USC00115515 |
| CONCONULLY | WA | US | USC00451666 |
| PORT TOWNSEND | WA | US | USC00456678 |
| MILBANK 4 NW | SD | US | USC00395536 |
| DAHLONEGA 4WSW | GA | US | USC00092475 |
| LAWTON | OK | US | USC00345063 |
| GOLDSBORO 4 SE | NC | US | USW00013713 |
| SAINT PAUL | NE | US | USC00257515 |
| GOLCONDA | NV | US | USC00263245 |
| BAUDETTE | MN | US | USC00210515 |
| SANTA ROSA | CA | US | USC00047965 |
| MORGAN POWER & LIGHT | UT | US | USC00425826 |
| PARKER | AZ | US | USC00026250 |
| LISBON | ND | US | USC00325220 |
| RED RIVER | NM | US | USC00297323 |
| BOONTON 1 SE | NJ | US | USC00280907 |
| PAROWAN | UT | US | USC00426686 |
| SNAKE CREEK POWERHOUSE | UT | US | USC00427909 |
| PANGUITCH | UT | US | USC00426601 |
| UNIONVILLE | MO | US | USC00238523 |
| SNOQUALMIE FALLS | WA | US | USC00457773 |
| DILLON 1 E | CO | US | USC00052281 |
| WANAKENA RNGR SCHOOL | NY | US | USC00308944 |
| HILLSBORO 3 N | ND | US | USC00324203 |
| MILLEN 4 N | GA | US | USC00095882 |
| HEALDSBURG | CA | US | USC00043875 |
| WILLIAMSTOWN | KY | US | USC00158714 |
| MORAN 5WNW | WY | US | USC00486440 |
| SACATON | AZ | US | USC00027370 |
| UKIAH | CA | US | USC00049122 |
| TUSTIN IRVINE RCH | CA | US | USC00049087 |
| LAKETOWN | UT | US | USC00424856 |
| DICKINSON EXP STN | ND | US | USC00322188 |
| BEND | OR | US | USC00350694 |
| NORTH LOUP | NE | US | USC00256040 |
| CLARK | SD | US | USC00391739 |
| GAGE | NM | US | USC00293368 |
| ELECTRA P H | CA | US | USC00042728 |
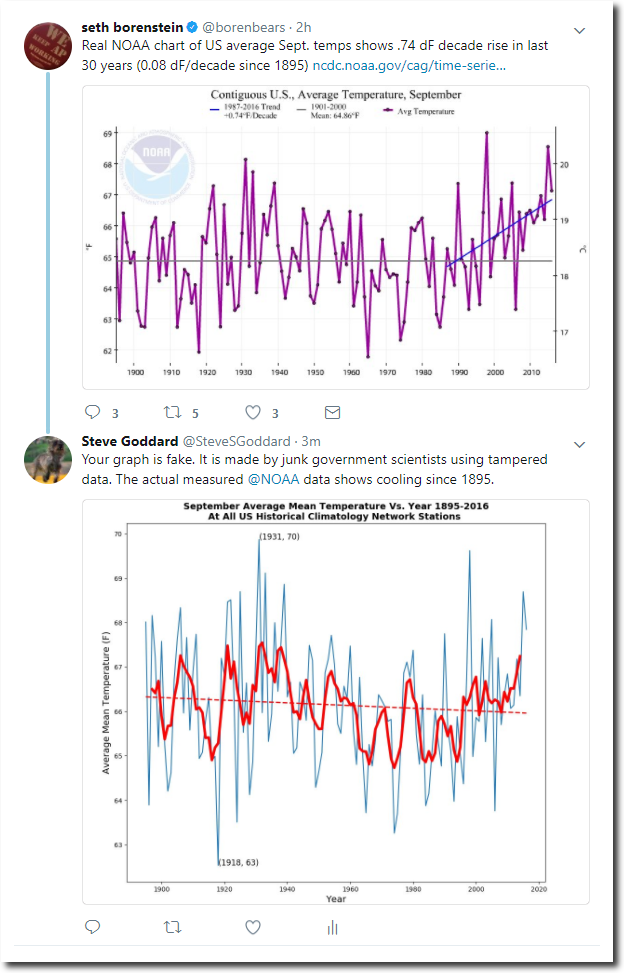
Claiming to speak for science, Seth “Arctic will be ice-free by 2012” Borenstein says the first fall freeze is coming later in the US since the 1980’s.
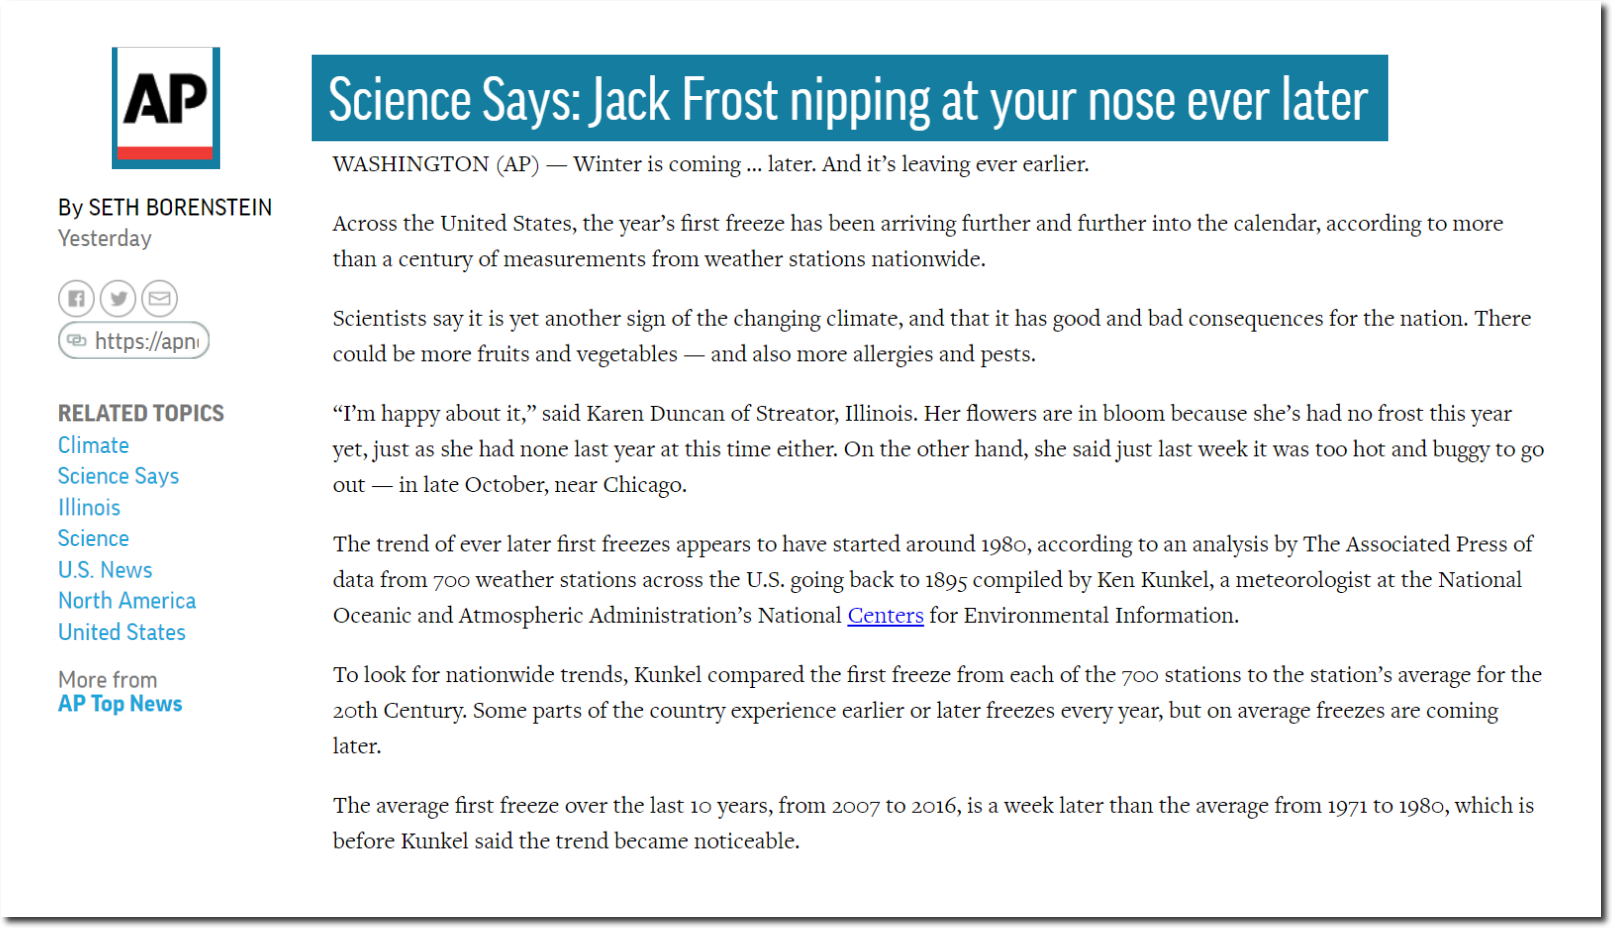
Science Says: Jack Frost nipping at your nose ever later
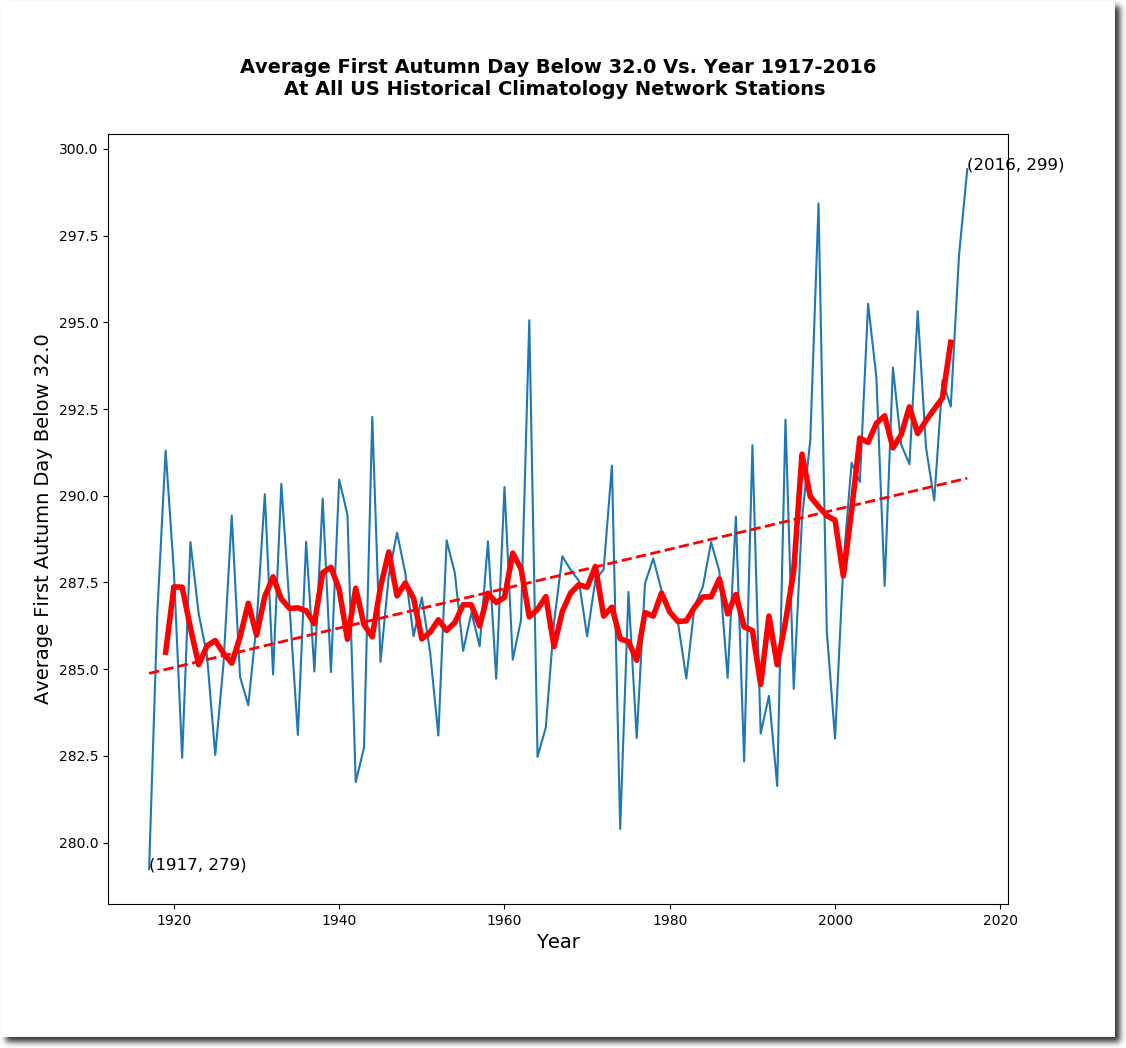
I tested this out, and “confirmed” the findings in the study. There was no trend in the date of the first autumn freeze prior to the 1980’s, and a hockey stick since then.
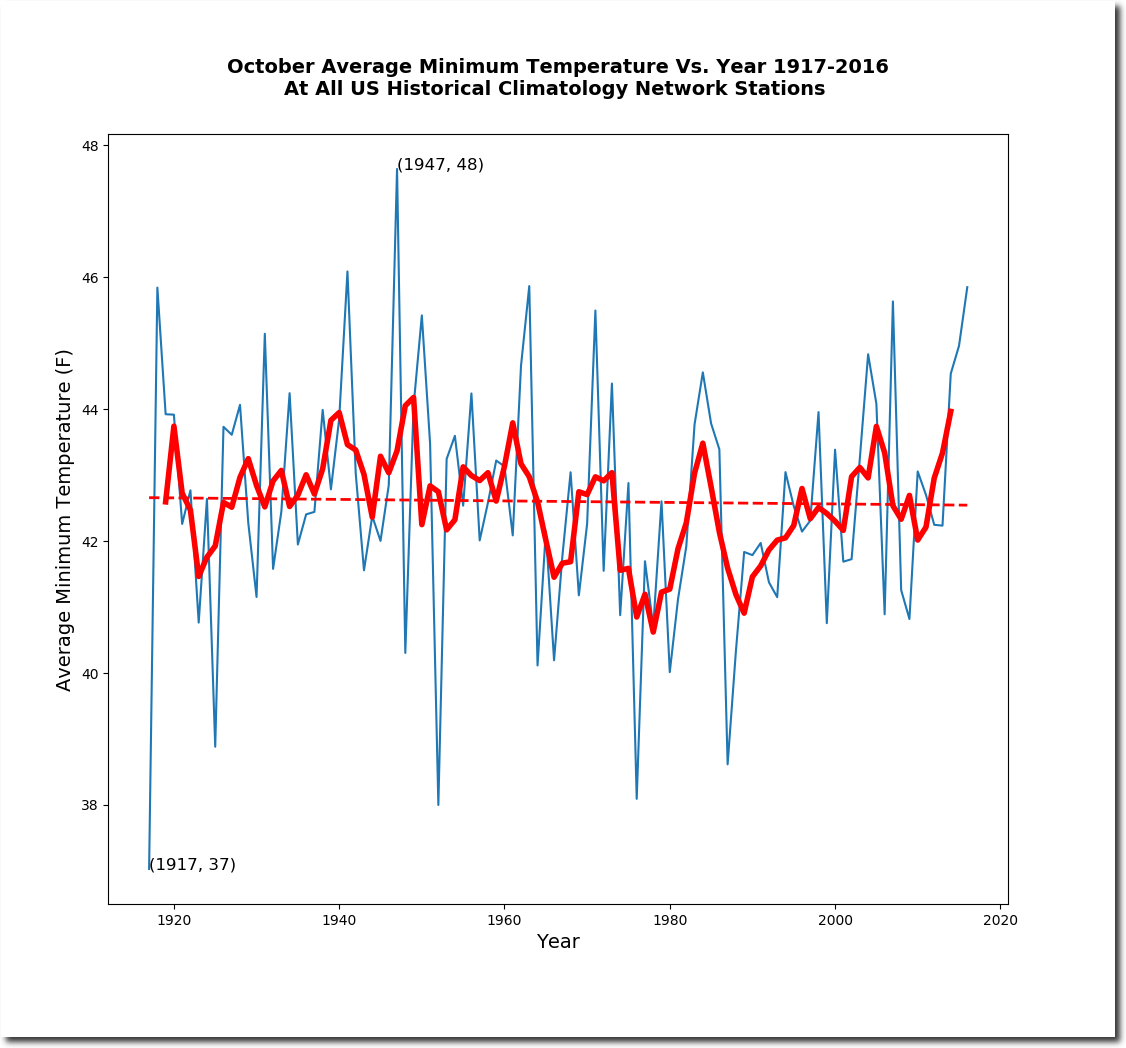
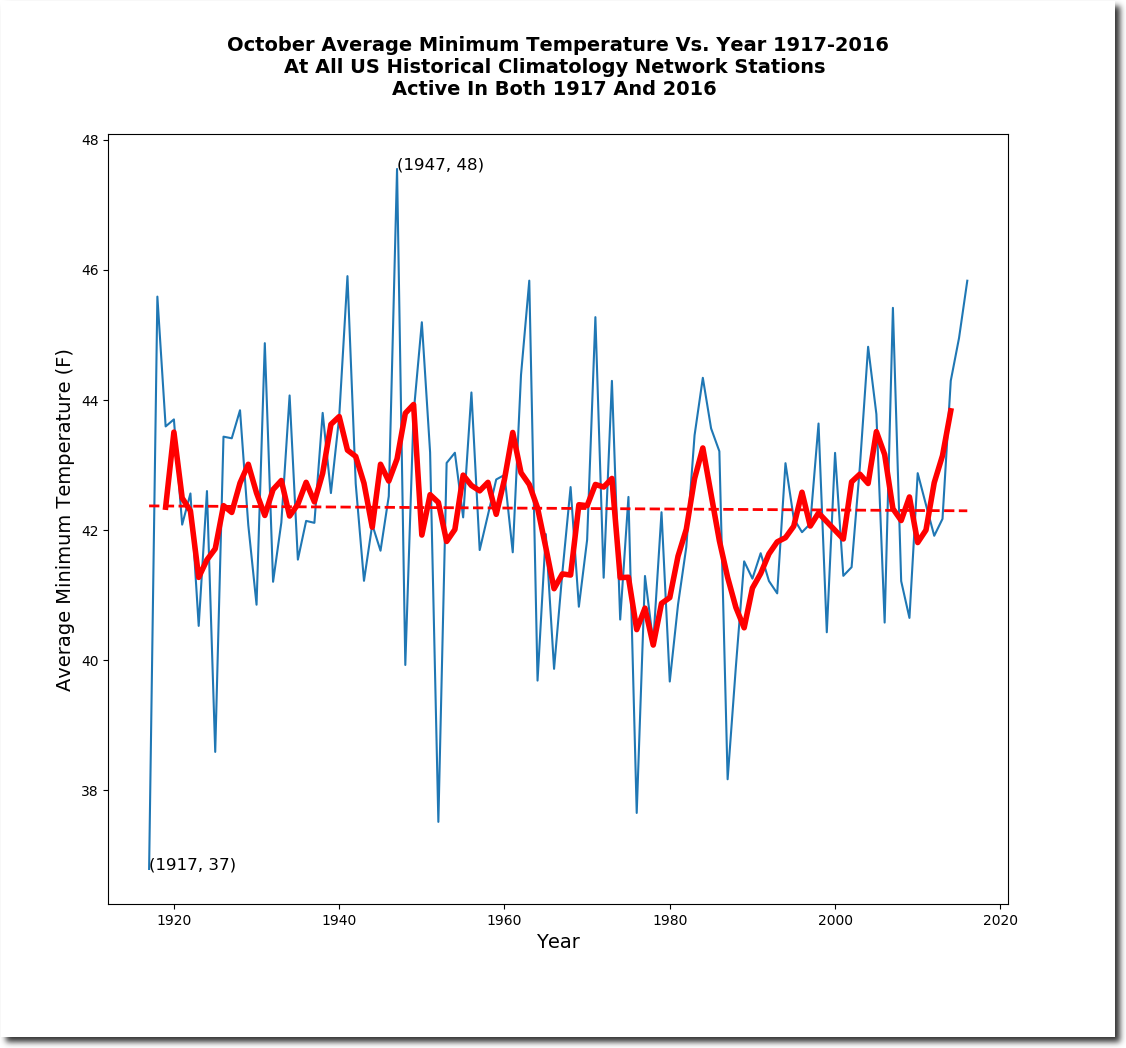
This didn’t make any sense to me, because average October minimum temperatures haven’t changed, and because autumn snow cover has increased greatly – indicating that Arctic air is spilling further south than it used to in October.
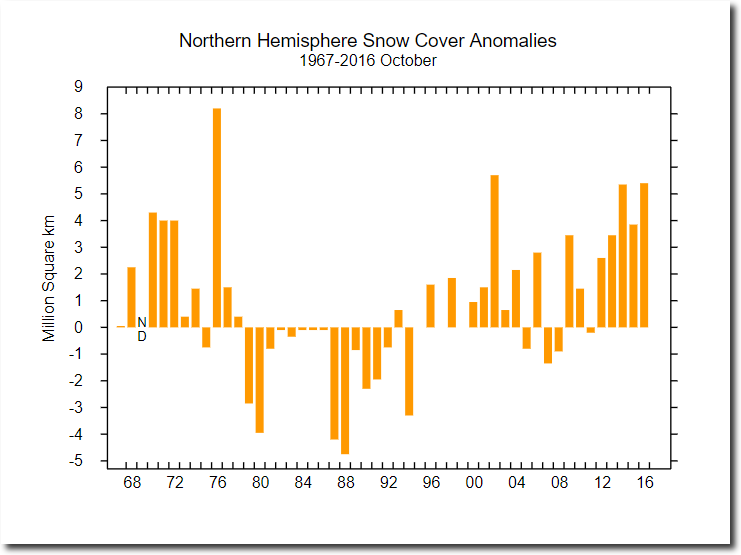
Rutgers University Climate Lab :: Global Snow Lab
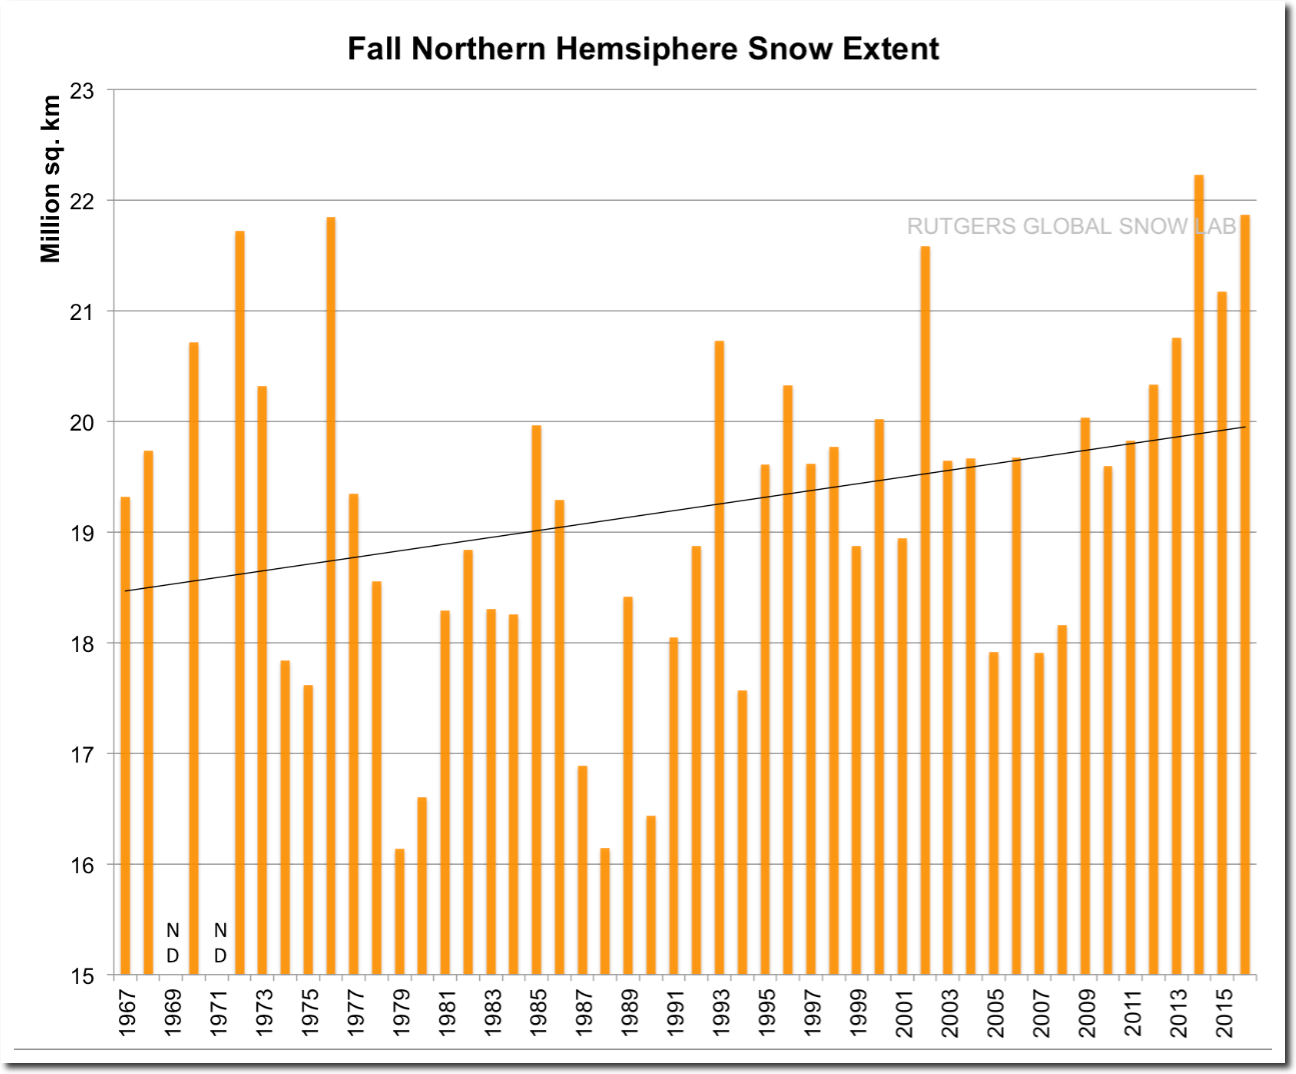
Rutgers University Climate Lab :: Global Snow Lab
So I looked at what was going on with the data. The hockey stick upwards coincides with NOAA’s massive loss of station data since the 1980’s, which makes a downwards hockey stick.
More than 40% of the USHCN monthly data is now fake.
If 40% of stations are failing to report in October, that pushes the date of the first freeze out by more than 12 days (40% of 31 days.) Average monthly temperatures aren’t affected much by intermittent data loss, but metrics like this one are heavily affected.
It is very likely that a large portion of the upwards trend since 1980 is simply due to data loss. If there is no data for a particular station in October, then the first freeze will be pushed out at least 30 days at that station. As more daily data is lost, the average date gets pushed out further and further, causing a hockey stick. The trend is completely fake junk science, which are NOAA and Borenstein trademarks.
Additionally, the diurnal temperature variation is decreasing in the US due to Urban Heat Island issues.
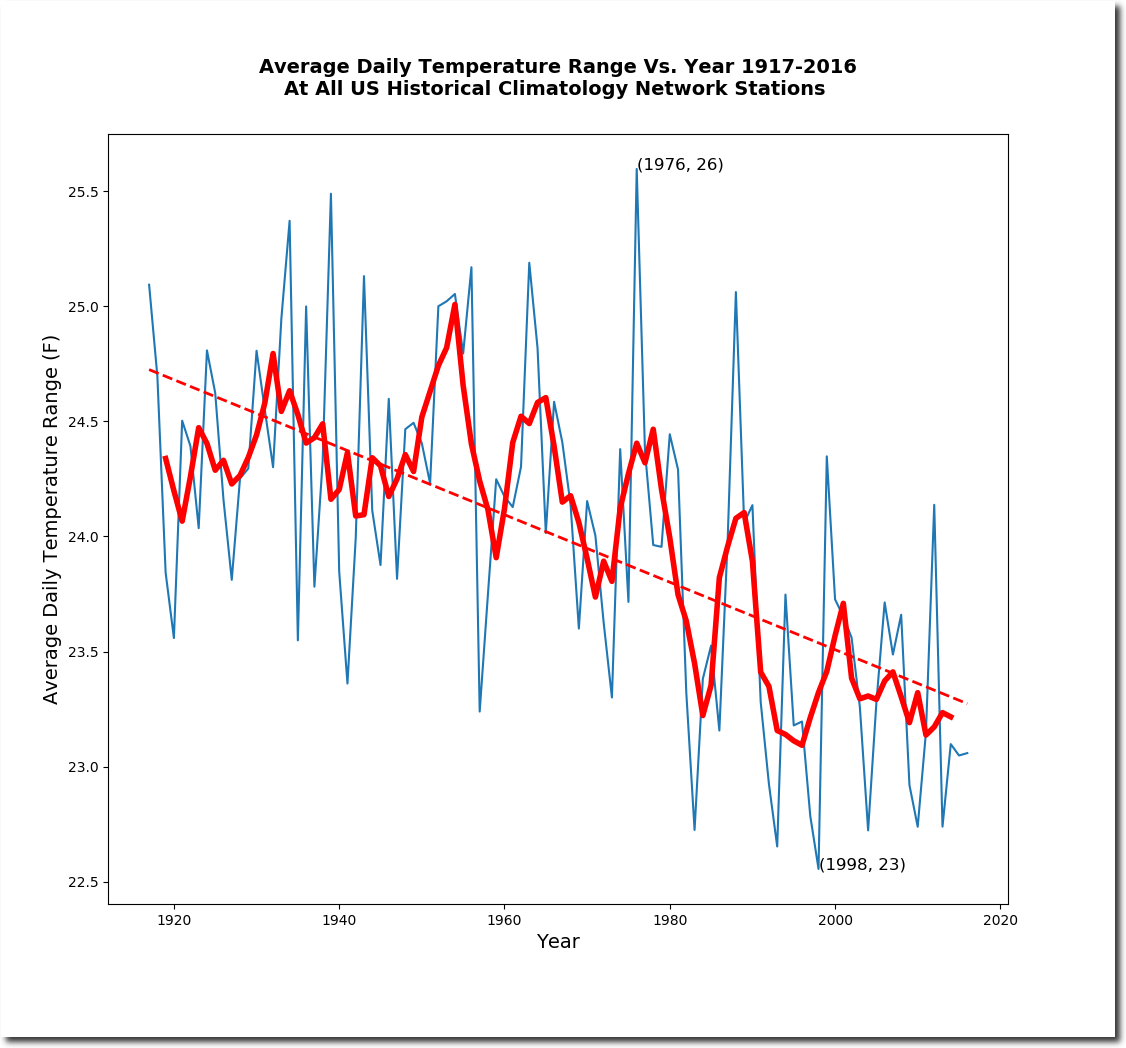
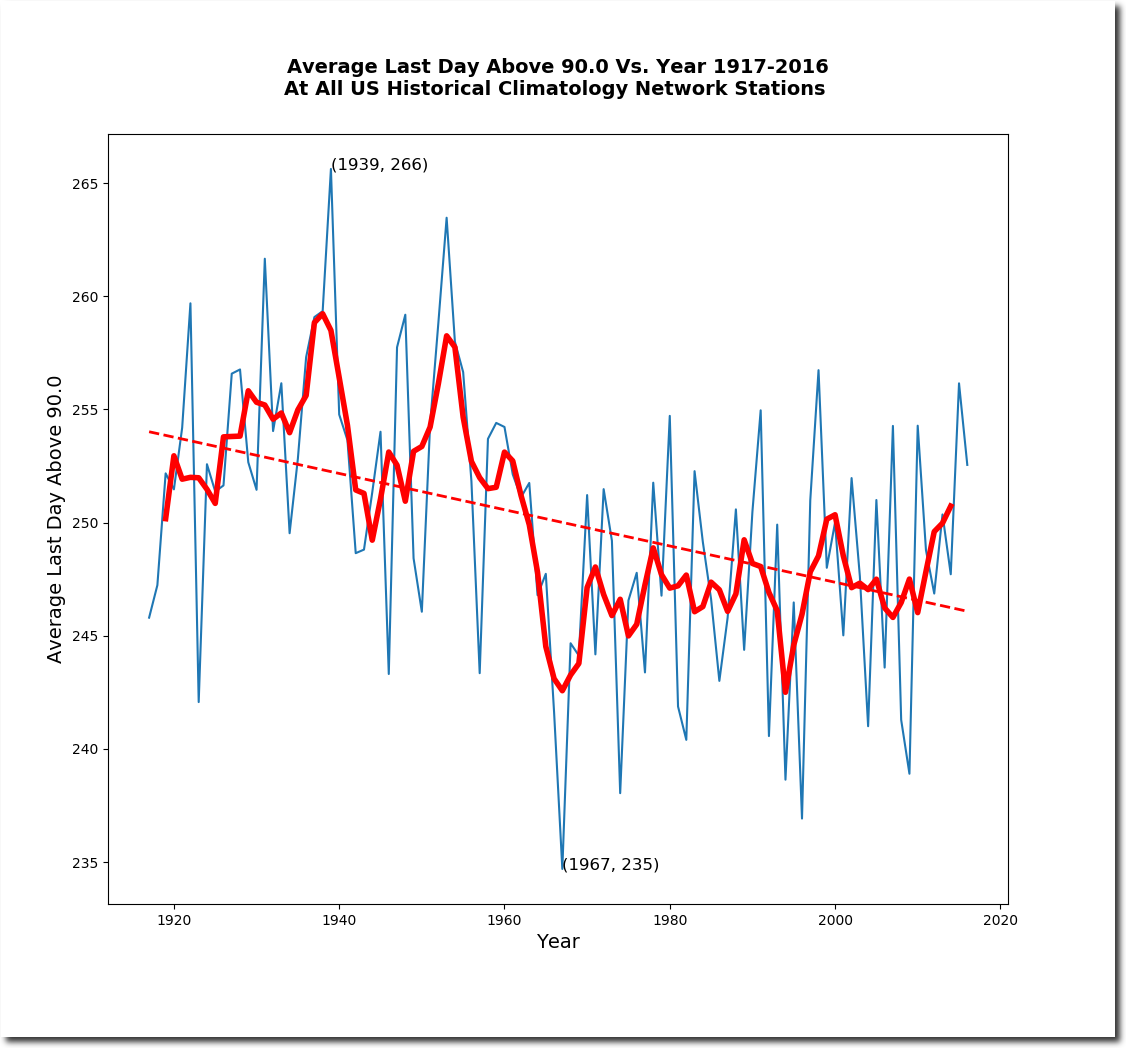
Summers are getting shorter. The last 90 degree day comes earlier than it did a century ago. (Data loss would have the opposite effect, and cause it come later.)
This junk science is nothing new for Seth, who loves his fake post-1980 hockey sticks.
And his fake Arctic forecasts.
Star-News – Google News Archive Search
The Argus-Press – Google News Archive Search
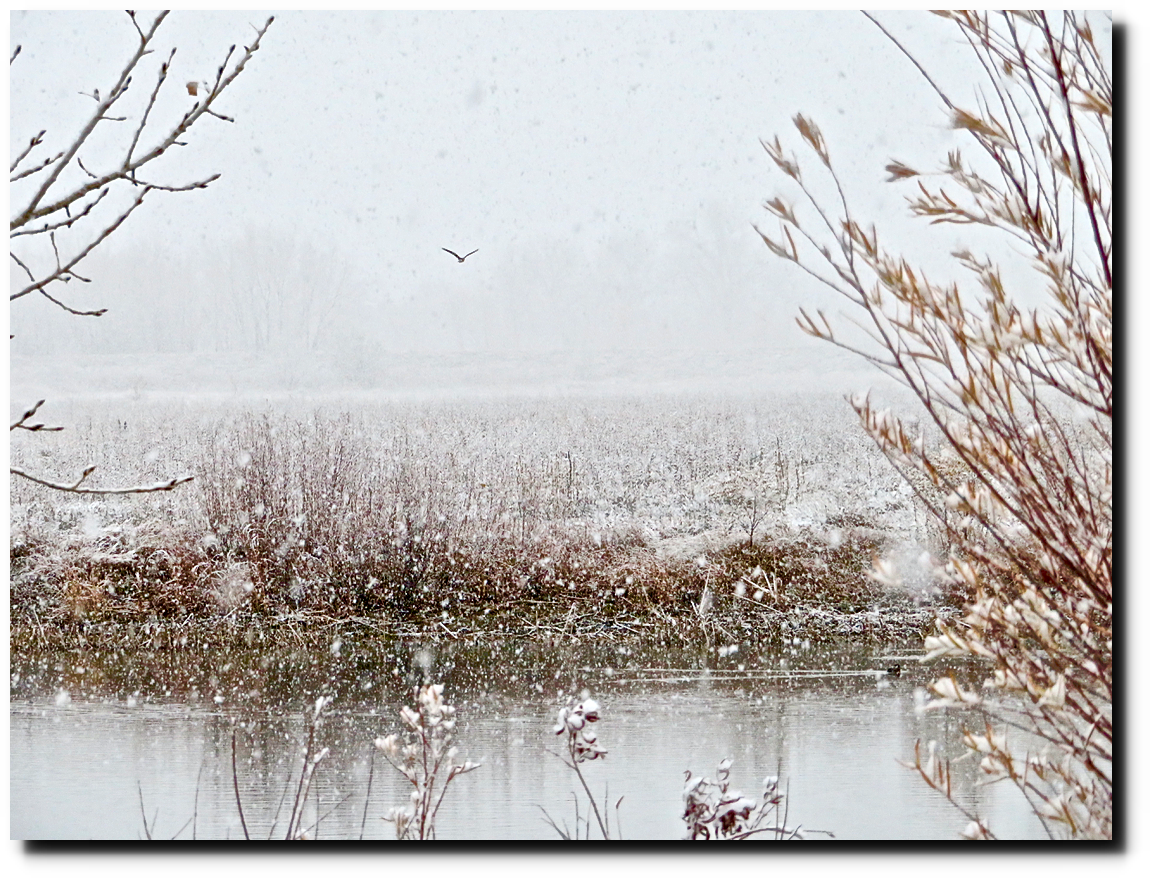
There is no indication that fall freezes are coming later. We have already had two snowstorms in Boulder this month, with a third expected tomorrow.
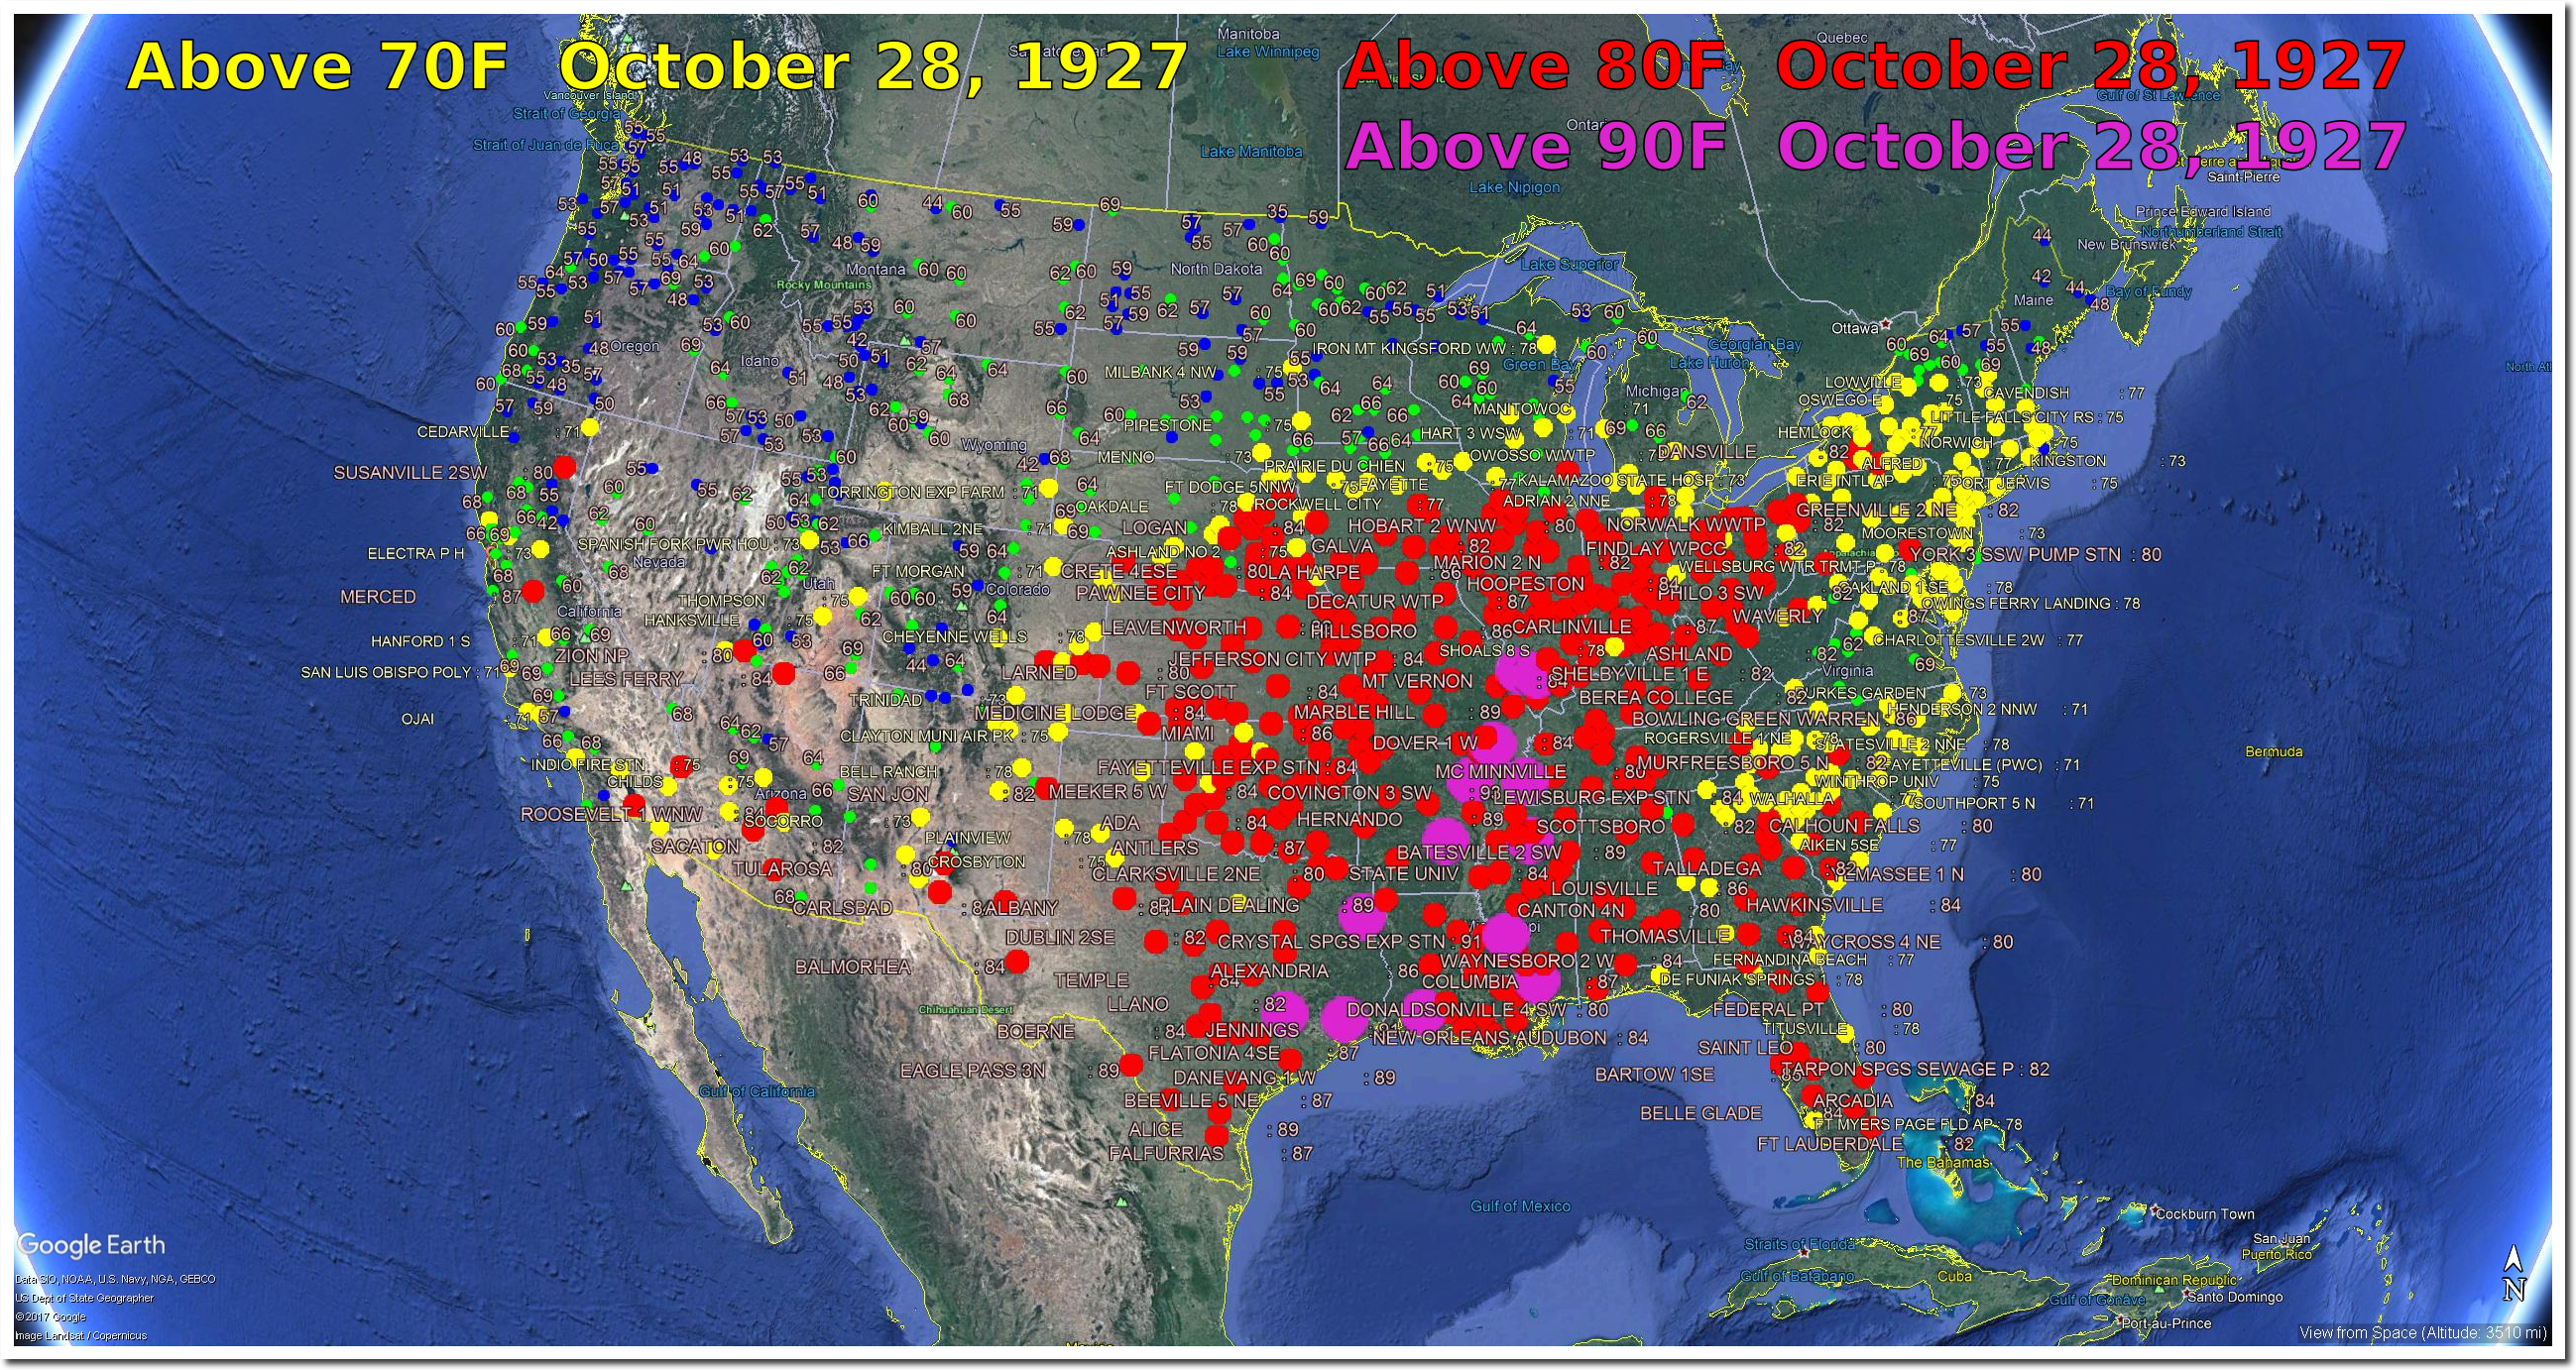
Over the past century, US October 28 maximum temperatures have dropped about 1.5F
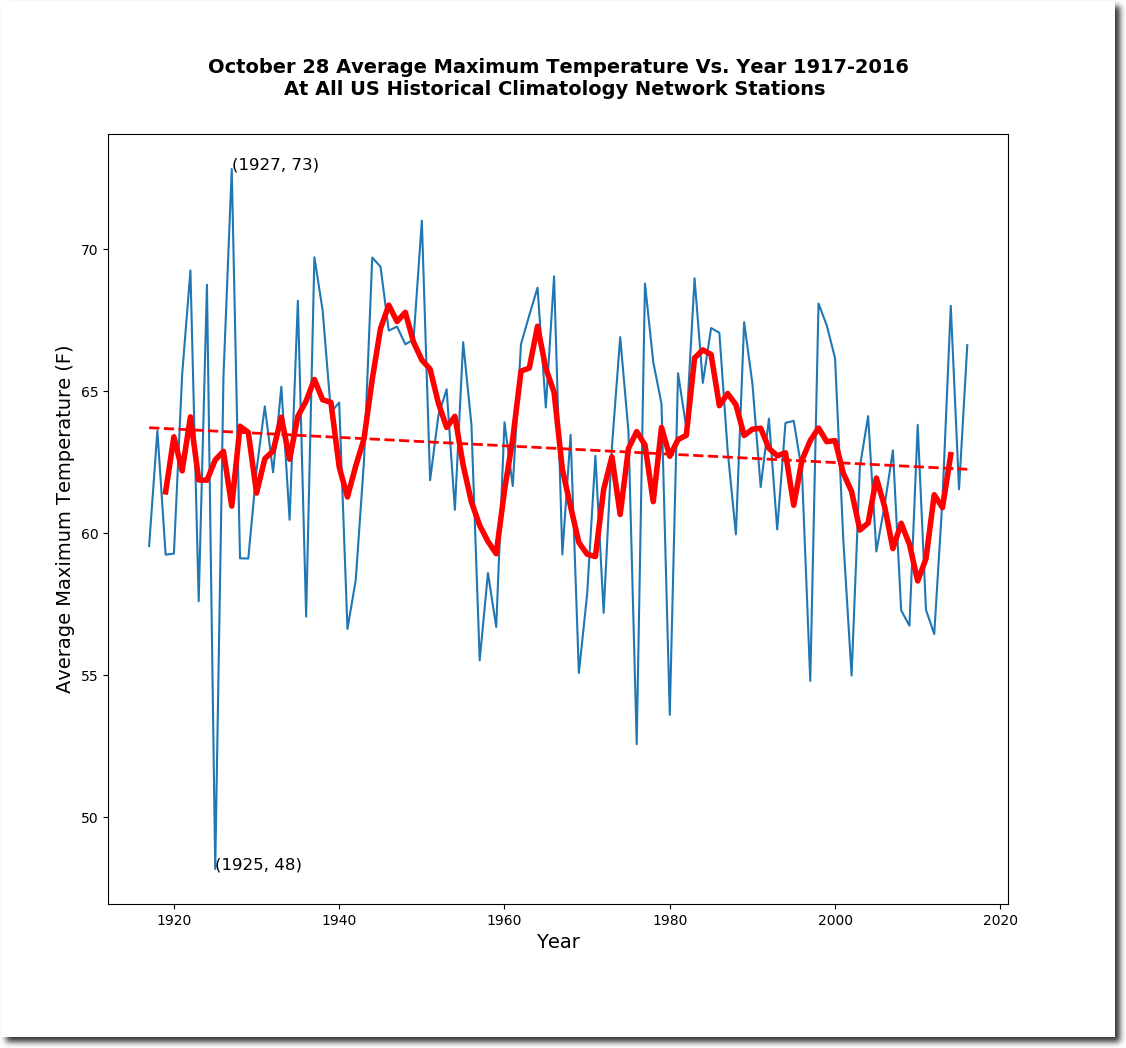
The likelihood of warm weather has plummeted.
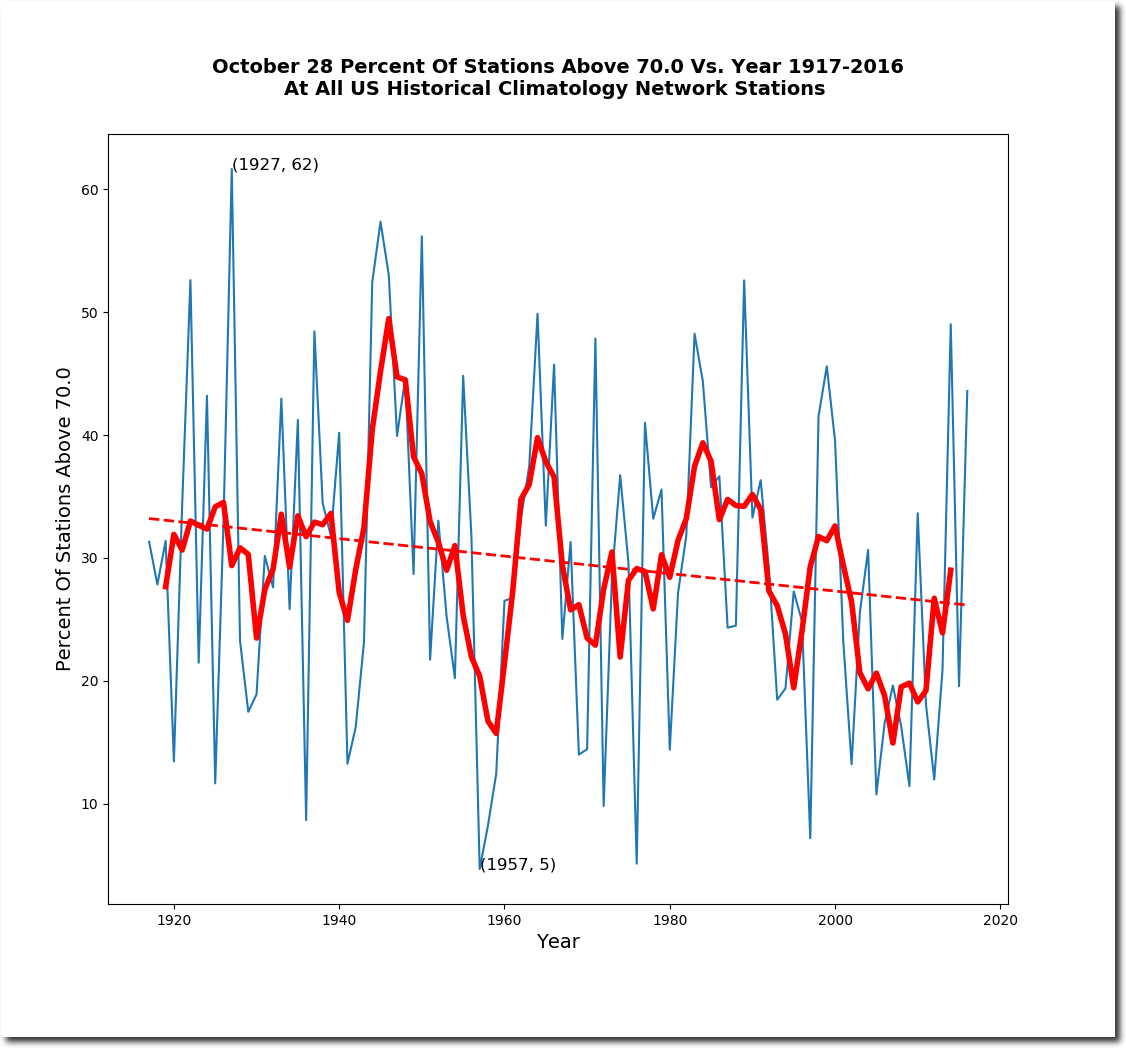
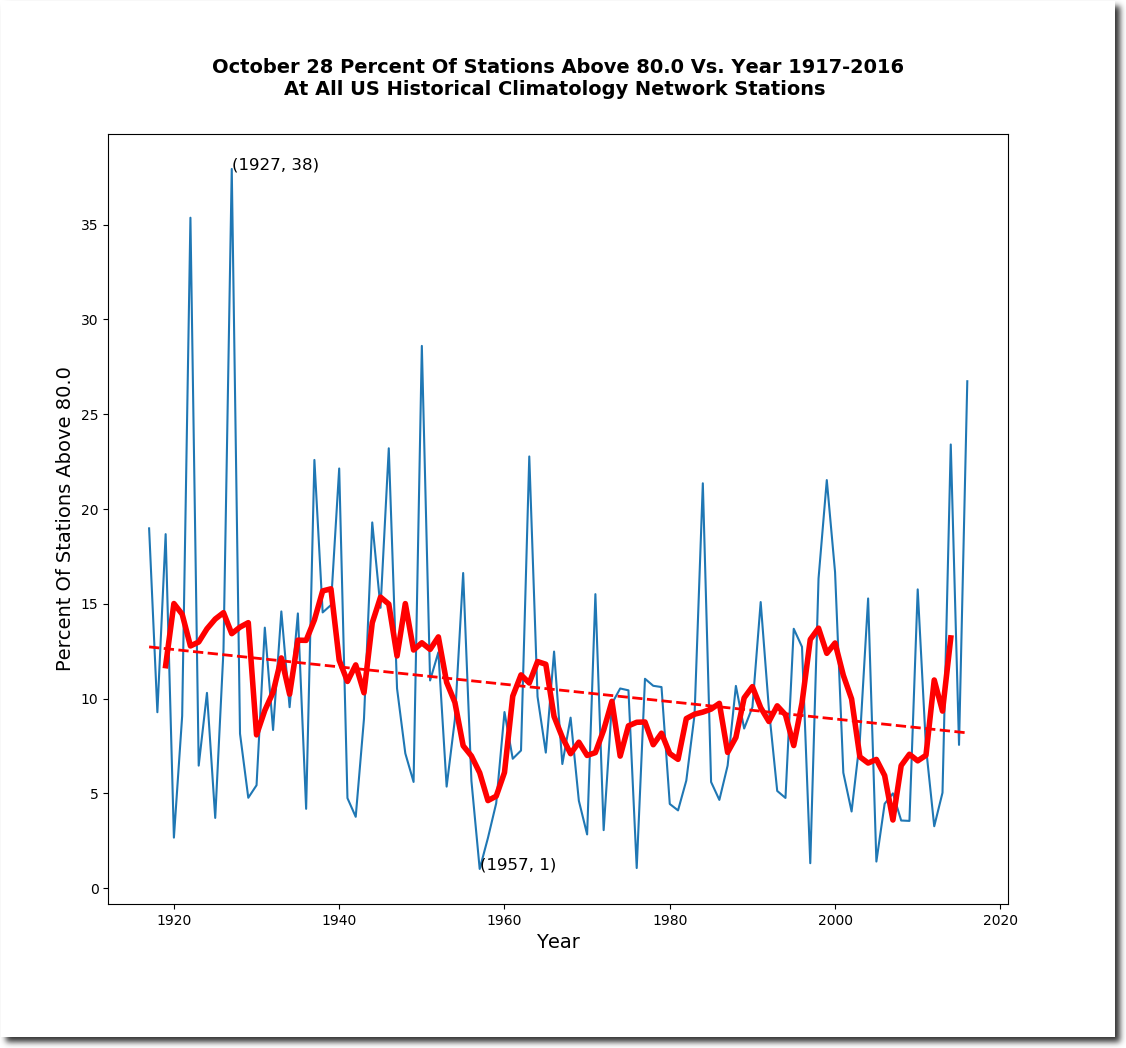
On this date 90 years ago, there were 90 degree temperatures in Illinois, and 80 degree temperatures in upstate New York. Almost the entire eastern US was over 70F.
“Insensibly one begins to twist facts to suit theories, instead of theories to suit facts.”
– Sherlock Holmes
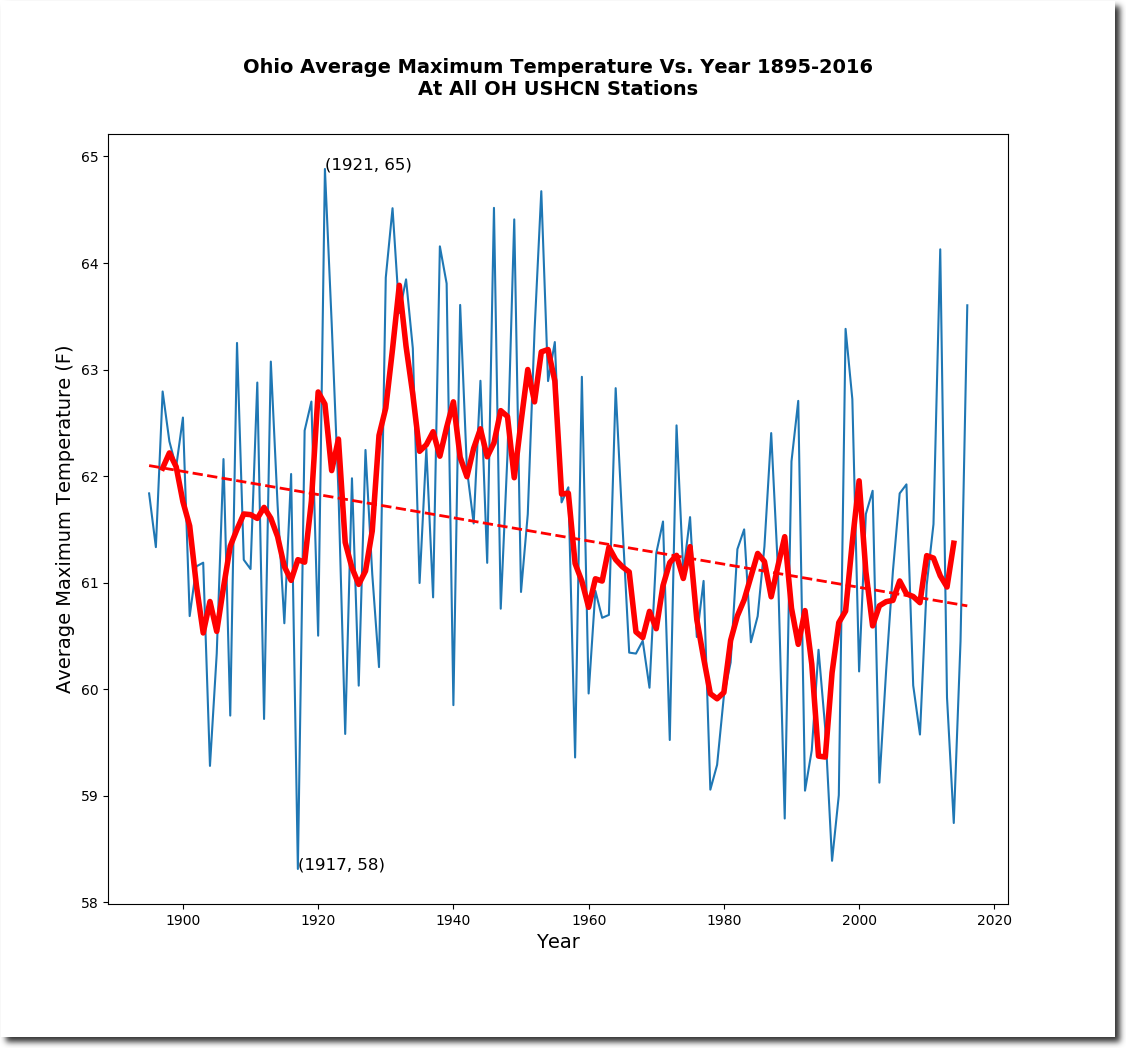
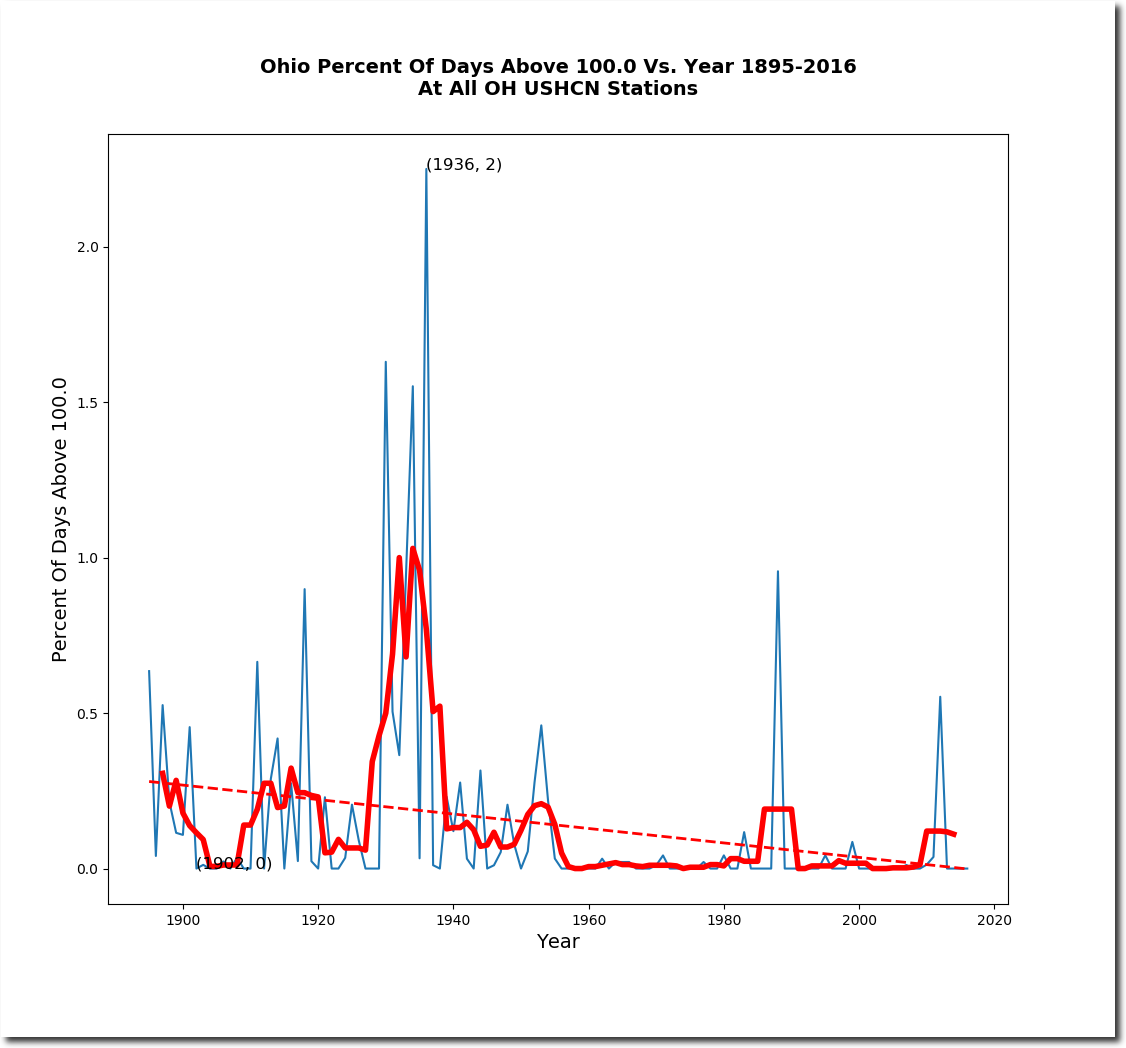
I had a request from a reader to cover Ohio temperatures/data tampering. Afternoon temperatures in Ohio were much higher prior to 60 years ago. After 1955, maximum temperatures plummeted and never recovered.
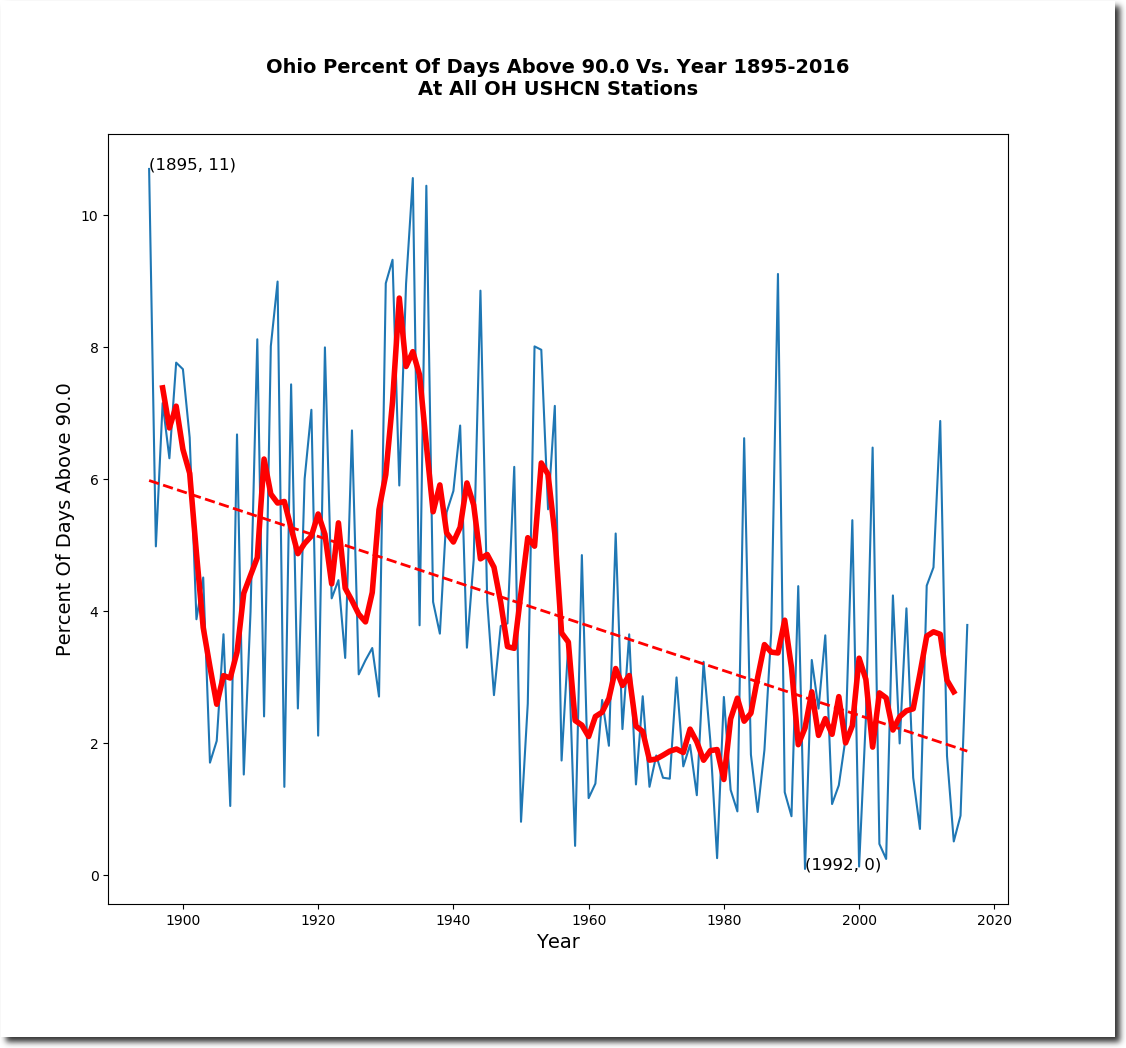
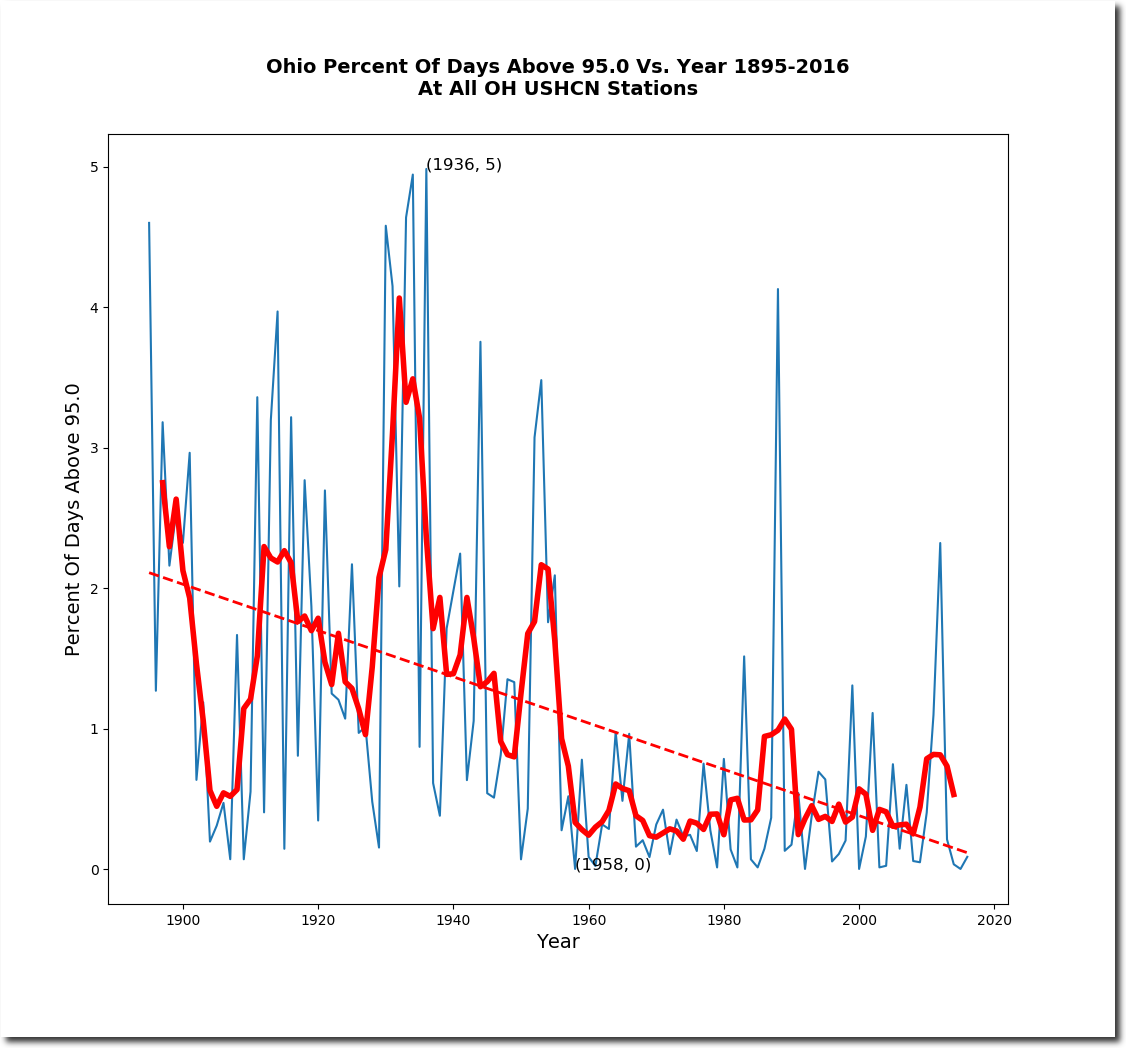
The percent of hot days in Ohio has dropped off dramatically since the 19th century.
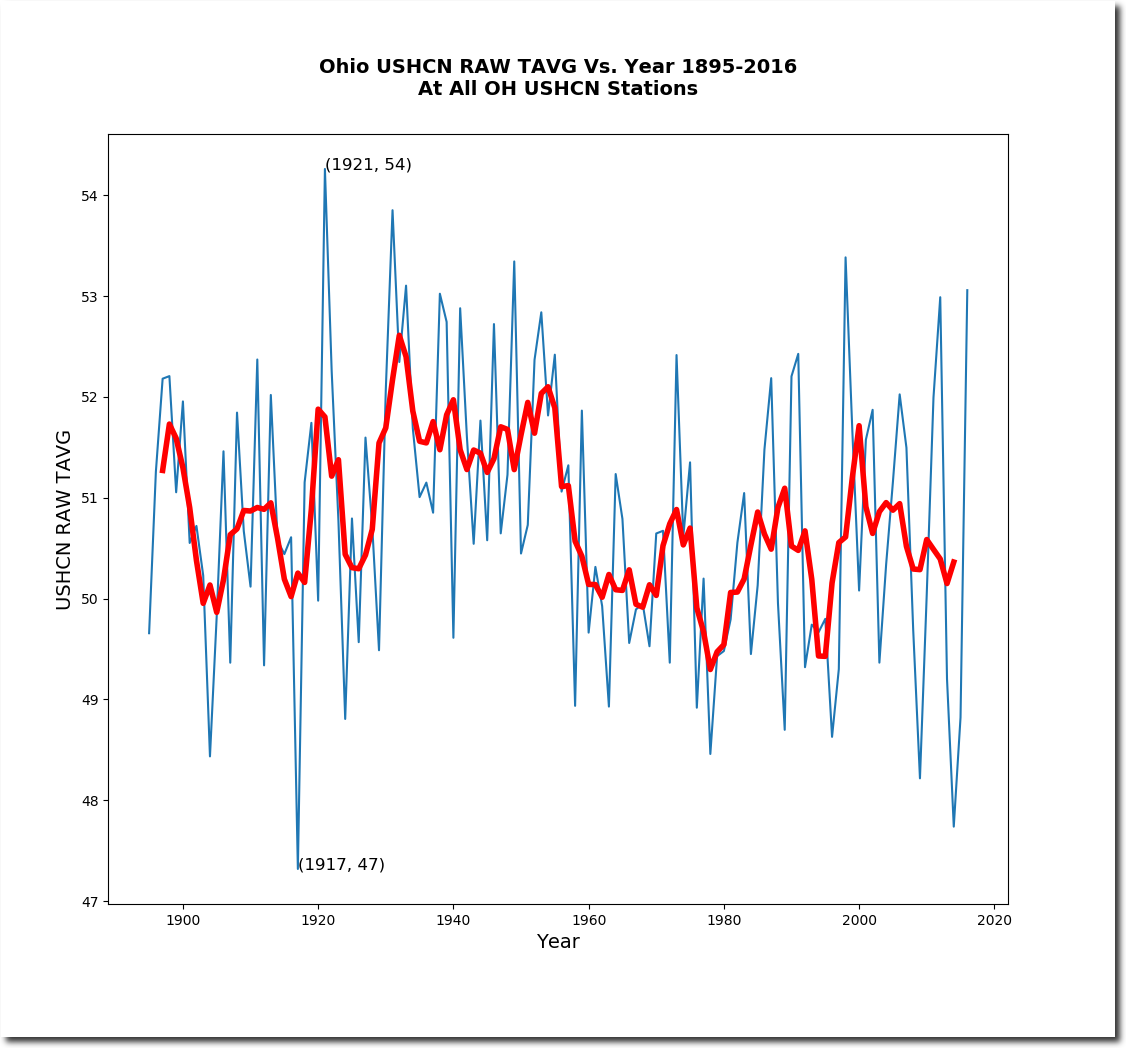
The mean temperature in Ohio also shows cooling.
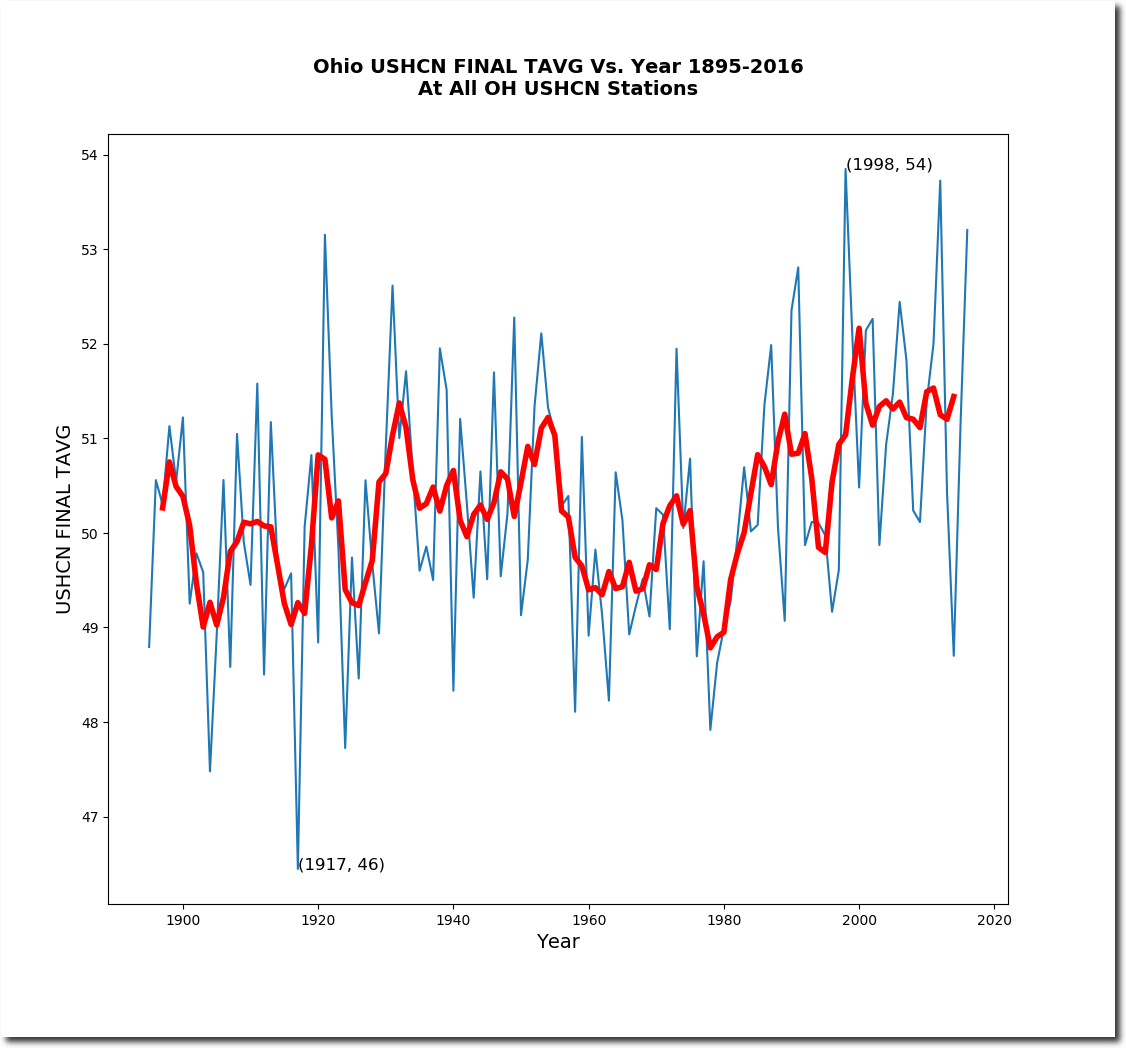
But NOAA massively tampers with the data to produce warming.
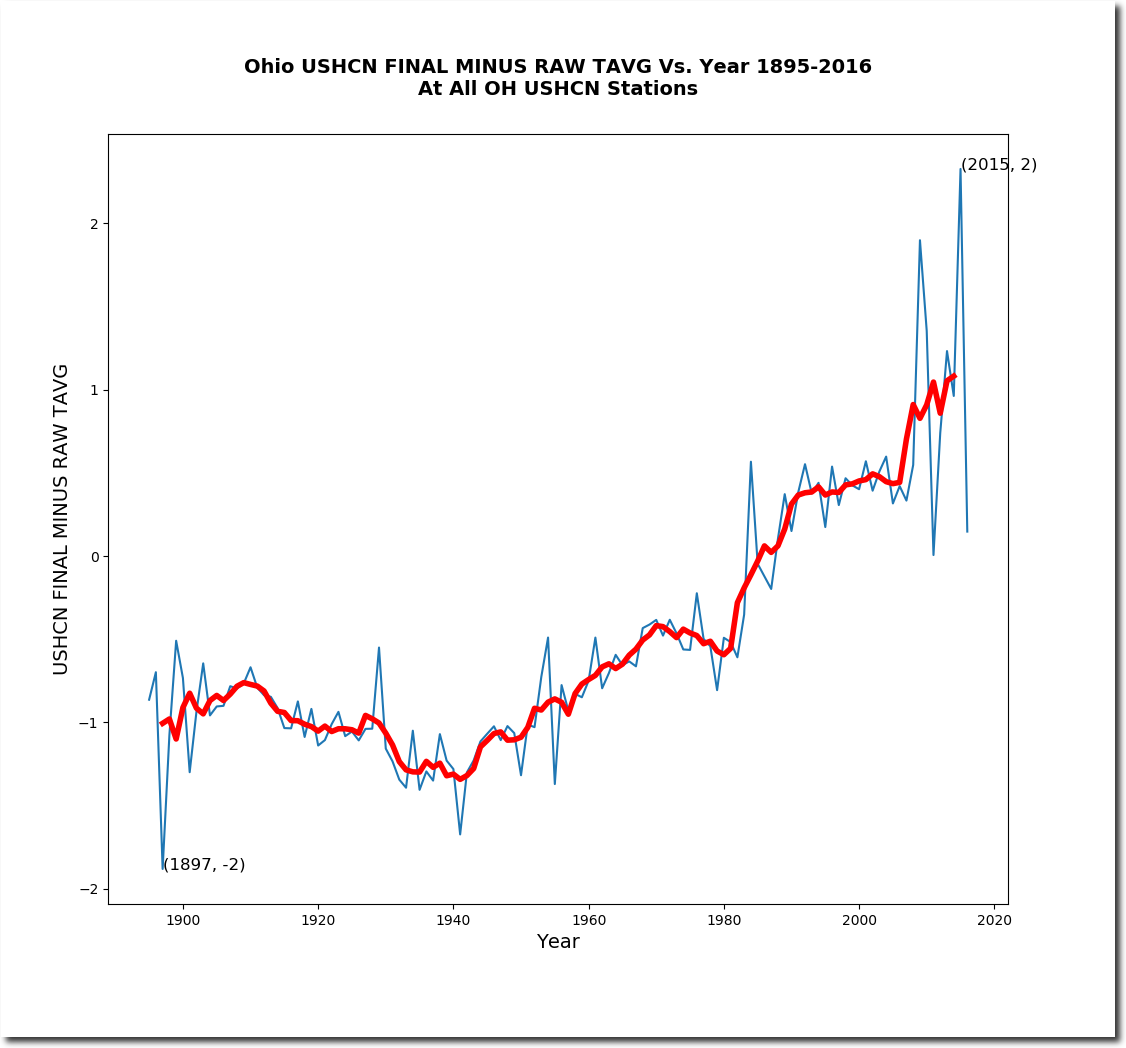
The hockey stick below shows how NOAA cools pre-1990 temperatures and warms post-1990 temperatures, to turn cooling into warming.
Global warming, and in particular US warming, is a fabrication of criminals working at government agencies. It has nothing to do with climate.
Below is the list of stations used in this analysis.
| BUCYRUS | USC00331072 |
| CADIZ | USC00331152 |
| CHIPPEWA LAKE | USC00331541 |
| CIRCLEVILLE | USC00331592 |
| COSHOCTON WPC PLT | USC00331890 |
| DEFIANCE | USC00332098 |
| DELAWARE | USC00332119 |
| FINDLAY WPCC | USC00332791 |
| GREENVILLE WTP | USC00333375 |
| HILLSBORO | USC00333758 |
| HIRAM | USC00333780 |
| KENTON | USC00334189 |
| MC CONNELLSVILLE LK 7 | USC00335041 |
| MILLERSBURG | USC00335297 |
| MILLPORT 4 NE | USC00335315 |
| NORWALK WWTP | USC00336118 |
| OBERLIN | USC00336196 |
| PHILO 3 SW | USC00336600 |
| PORTSMOUTH-SCIOTOVILLE | USC00336781 |
| TIFFIN | USC00338313 |
| UPPER SANDUSKY | USC00338534 |
| URBANA WWTP | USC00338552 |
| WARREN 3 S | USC00338769 |
| WAUSEON WTP | USC00338822 |
| WAVERLY | USC00338830 |
| WOOSTER EXP STATION | USC00339312 |
Boulder yesterday – 80 degrees.
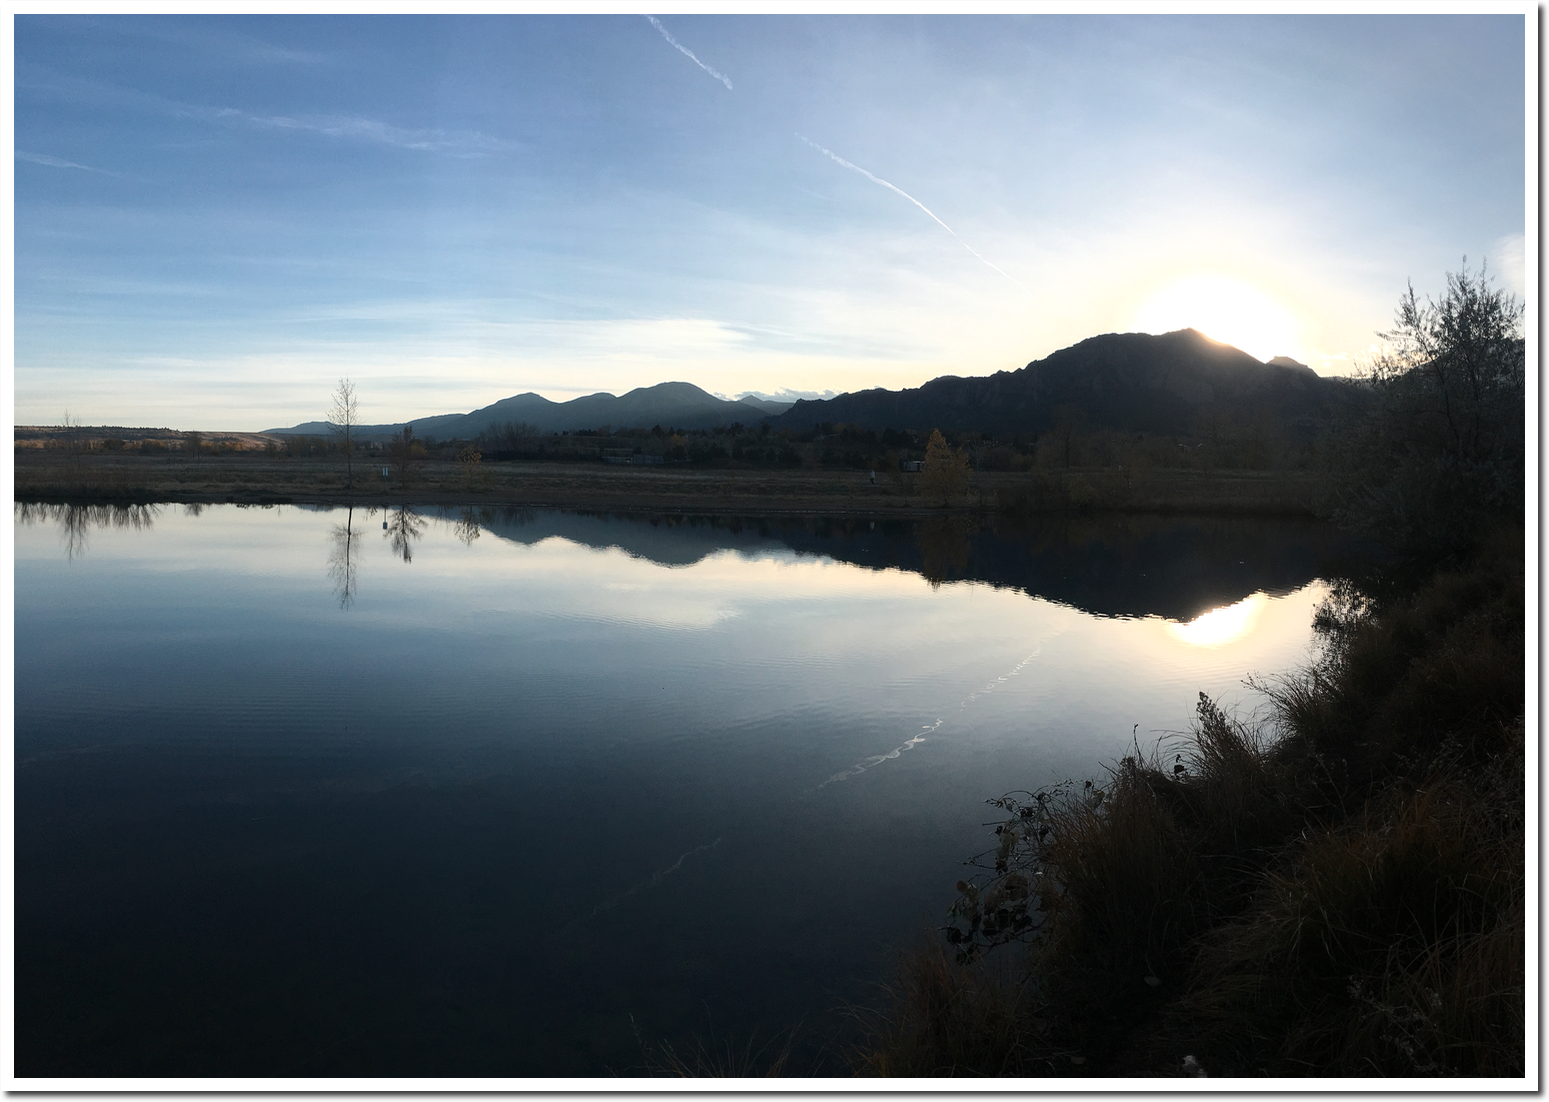
Boulder today

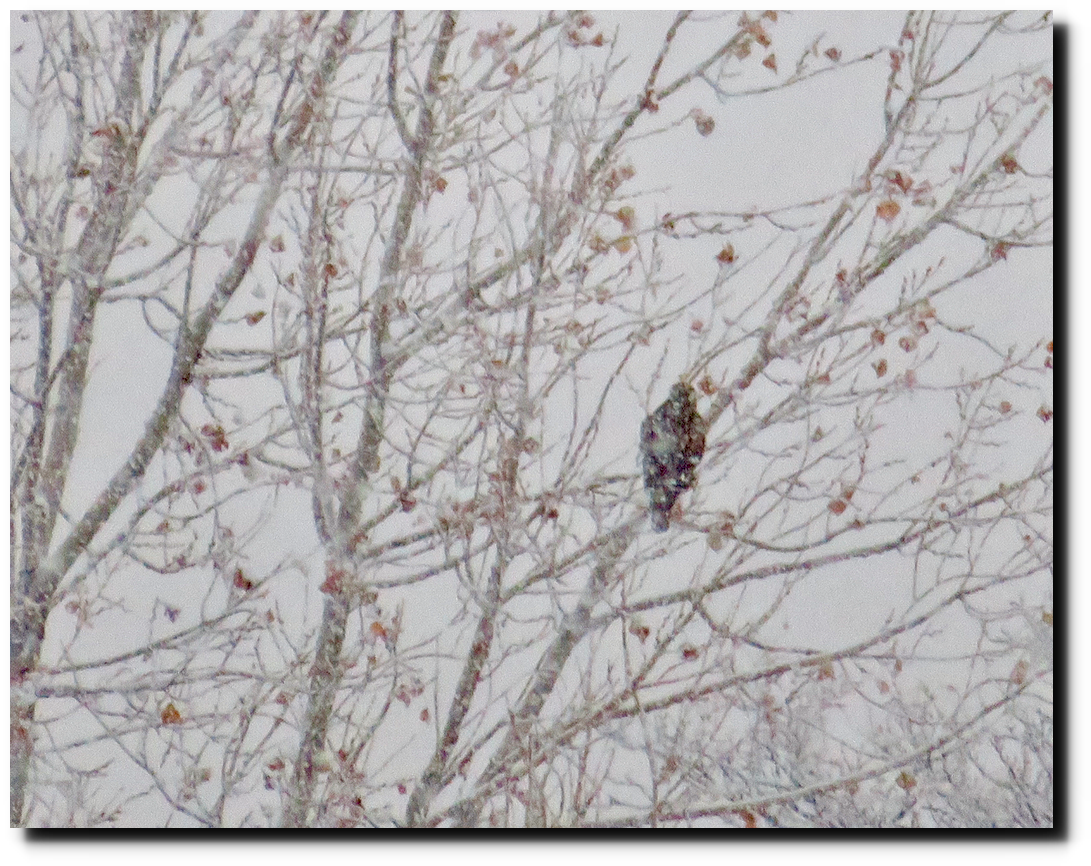
The Kestrel


NOAA’s climate reporting is spectacularly fraudulent and cynical. They do things like report record heat in parts of the world where they had no temperature data that month..
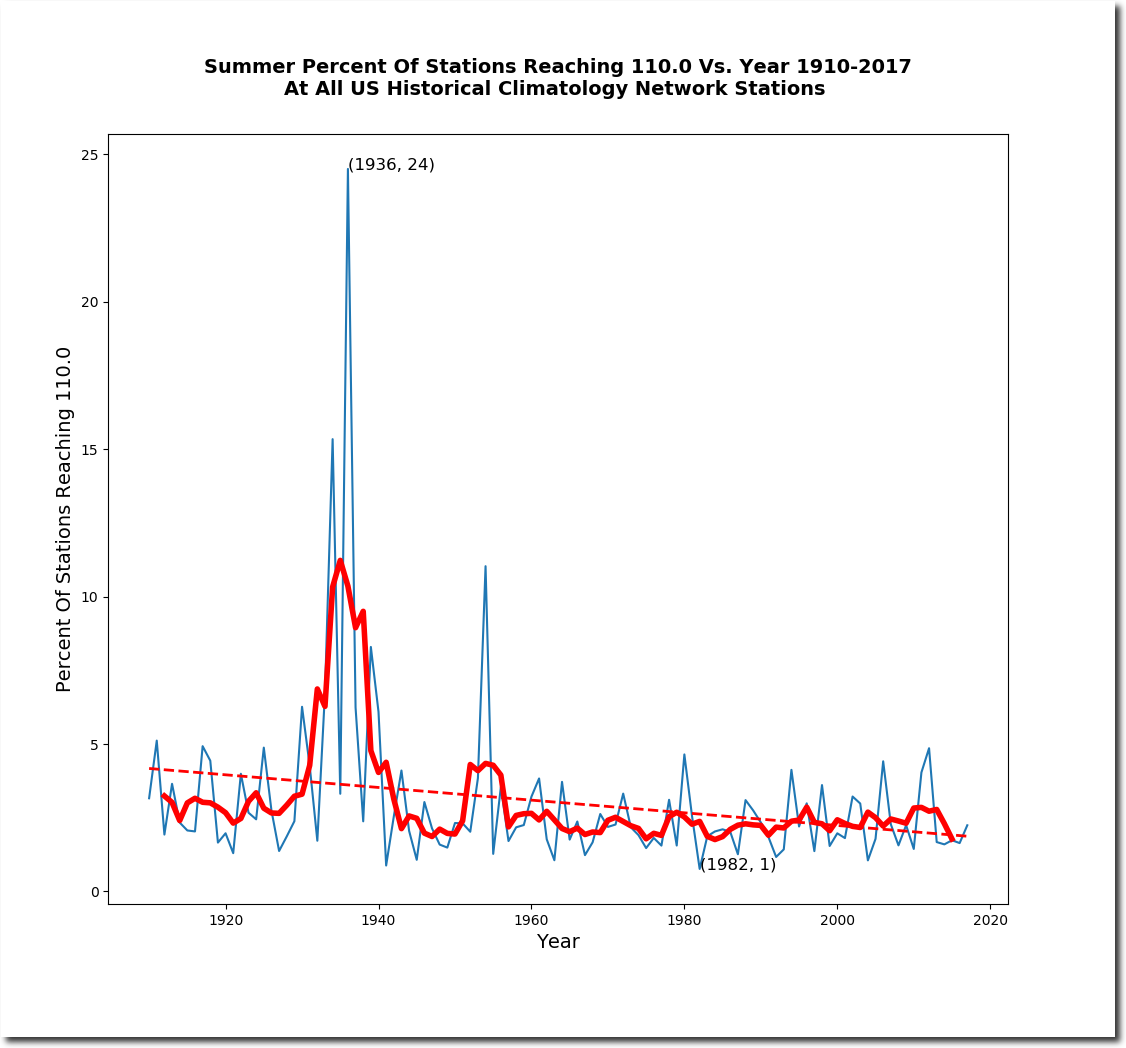
But none of NOAA’s climate fraud is more cynical then their Climate Extremes Index. NOAA claims that the occurrence of hot summer afternoons has increased in the US, with 2012 being the hottest.
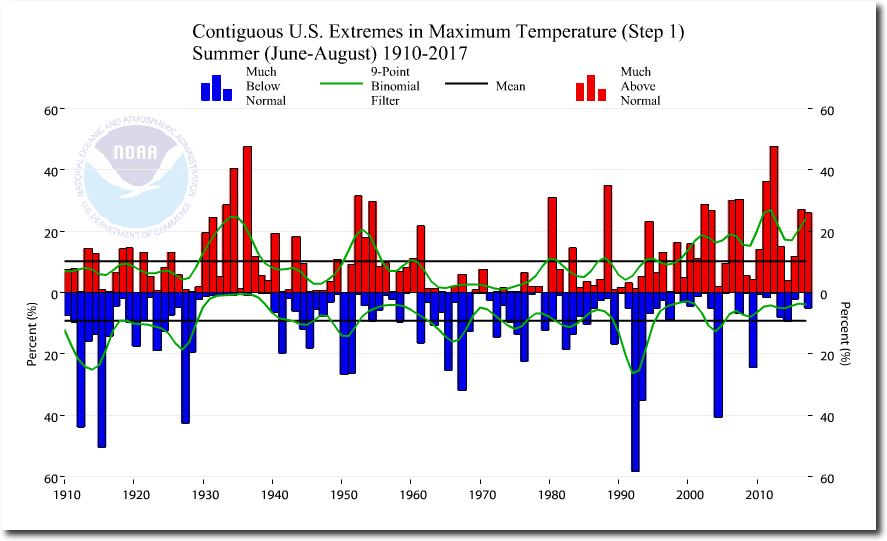
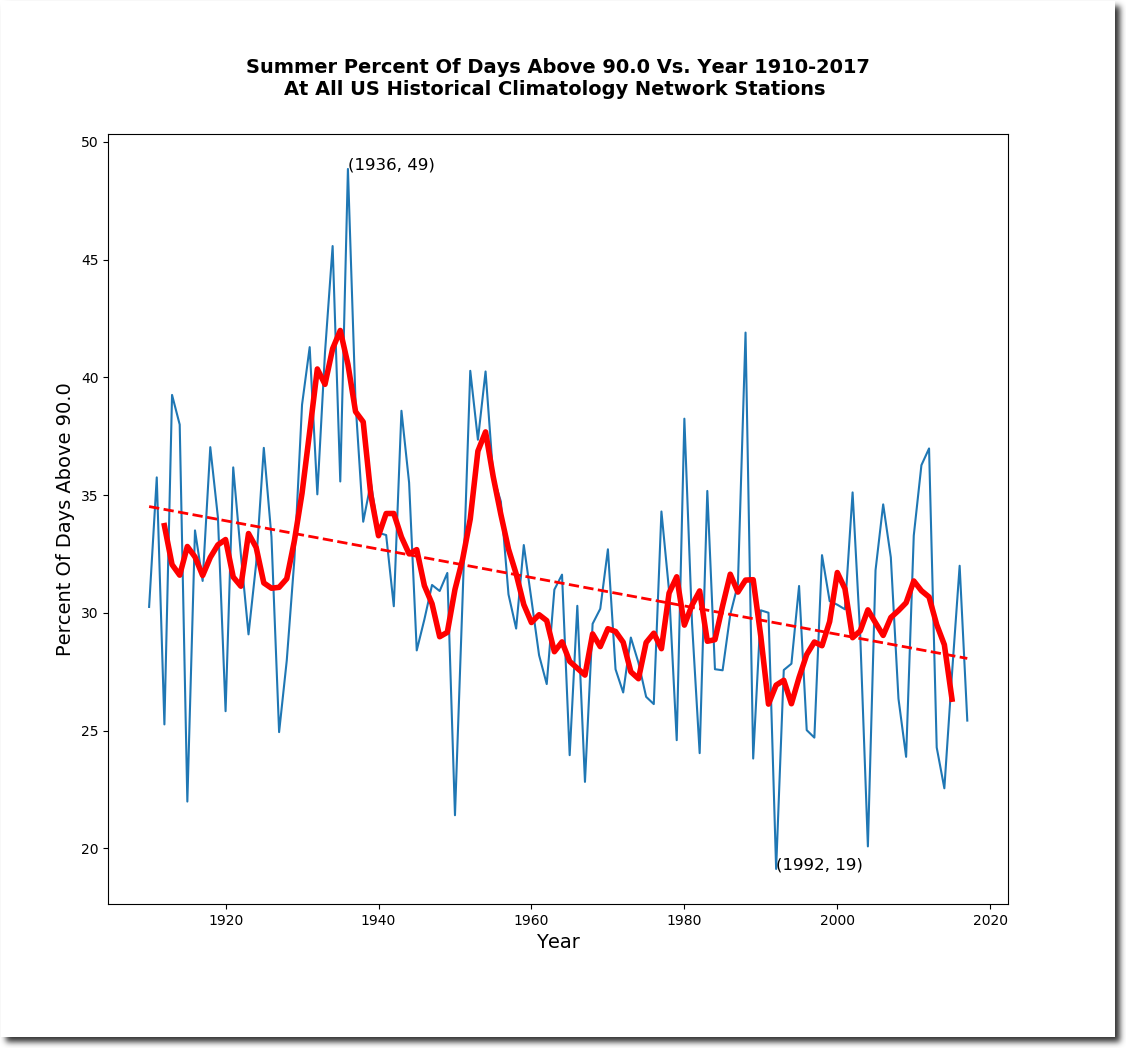
This is wildly fraudulent misinformation. The frequency and areal coverage of hot summer afternoons in the US has plummeted over the past 80 years, and is now near record lows.
The average summer maximum temperature has plummeted.

The percent of hot days has plummeted.
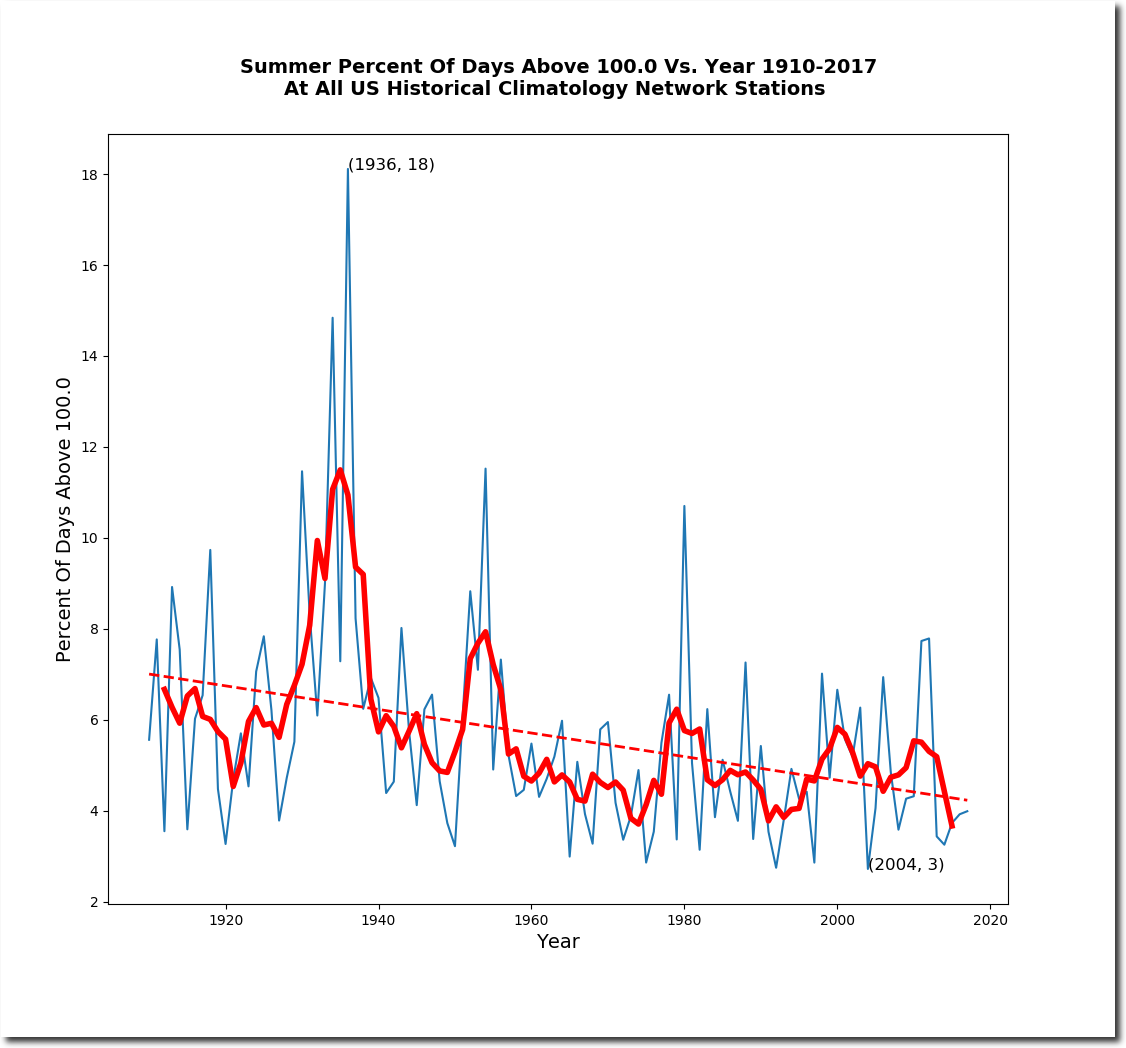
During the 1930’s about two-thirds of the US would reach 100 degrees during the summer. In recent years, that percentage has been less than one-third.
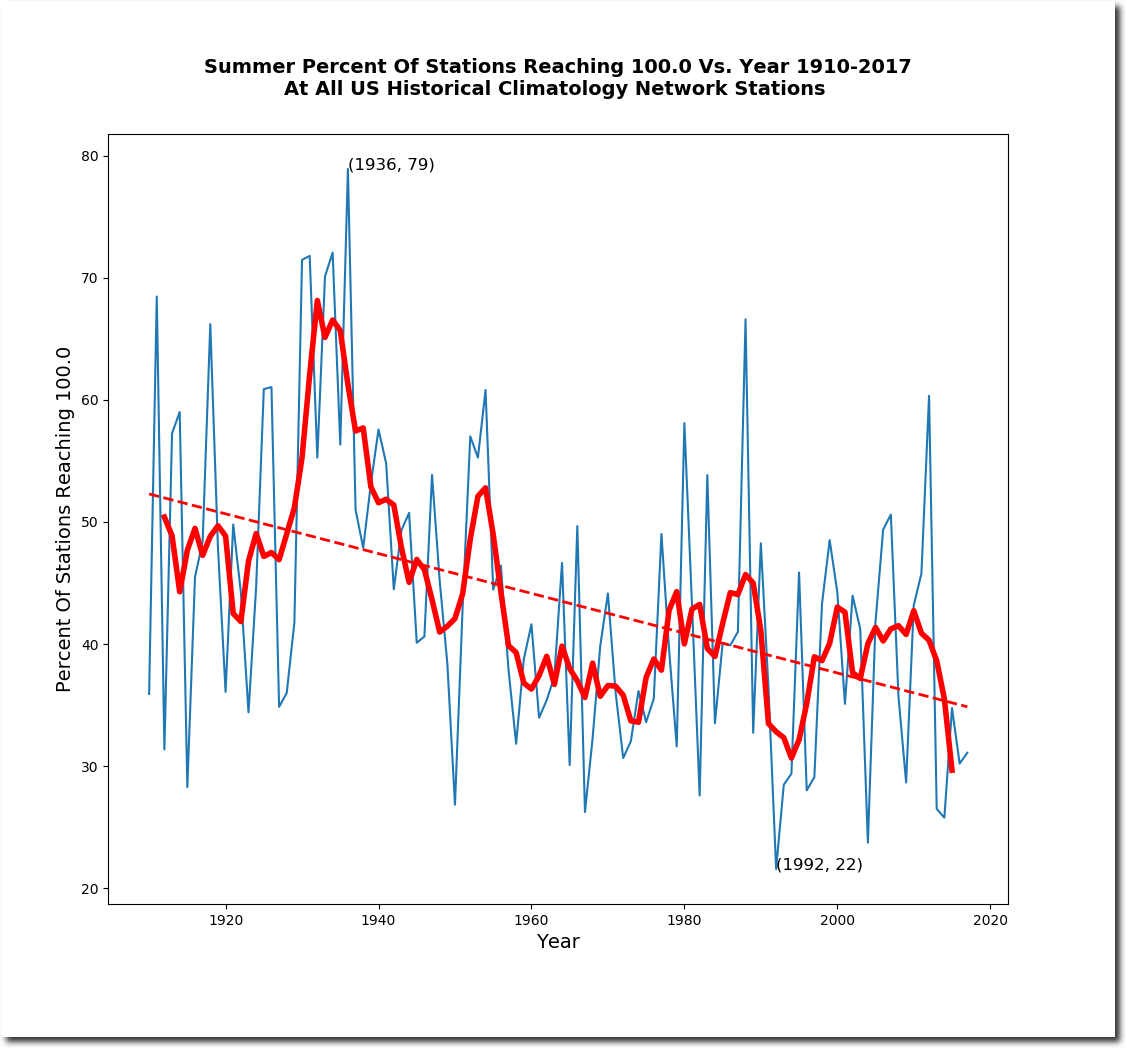
Summer afternoons are getting much cooler in the US. The 1930’s were very hot, with temperatures over 120 degrees in the Great Plains, and over 110 degrees across much of the US.
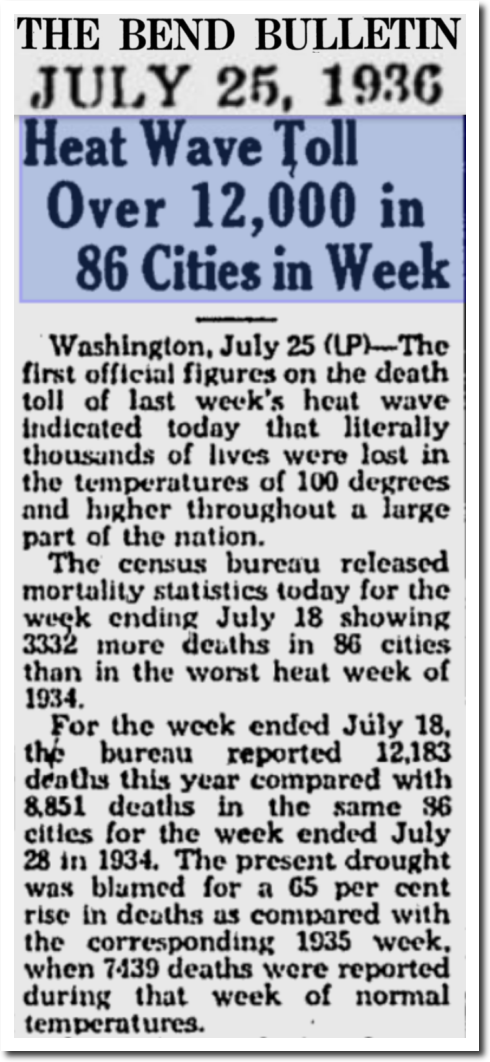
The Bulletin – Google News Archive Search
It is bad enough when NOAA makes up record high temperatures, but even more disturbing when they report the exact opposite of the actual trend. The people behind this are criminals, not scientists – and they are enabled by their fellow travelers in the press who refuse to question their work, or talk to anyone who does.
In 1973, George Kukla and the National Science Foundation forecast global cooling and a new ice age. They cited increased ice and snow in the Arctic as evidence.
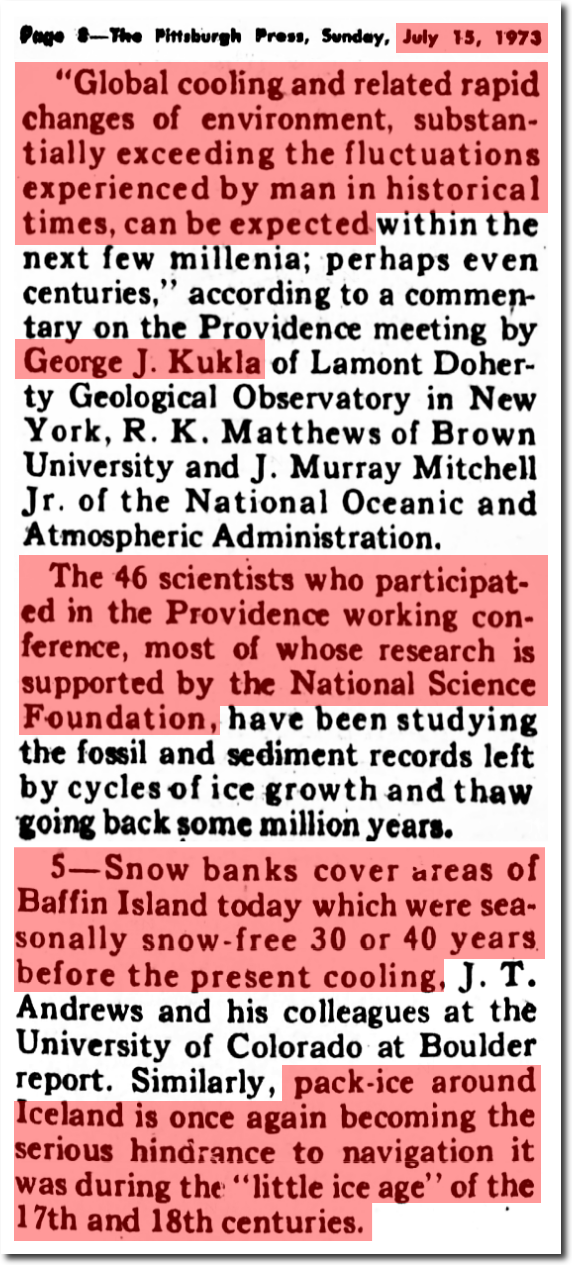
15 Jul 1973, Page 200 – The Pittsburgh Press at Newspapers.com
In 1981, George Kukla and the National Science Foundation forecast global warming and melting polar ice caps. They cited decreased ice in the Antarctic as evidence.
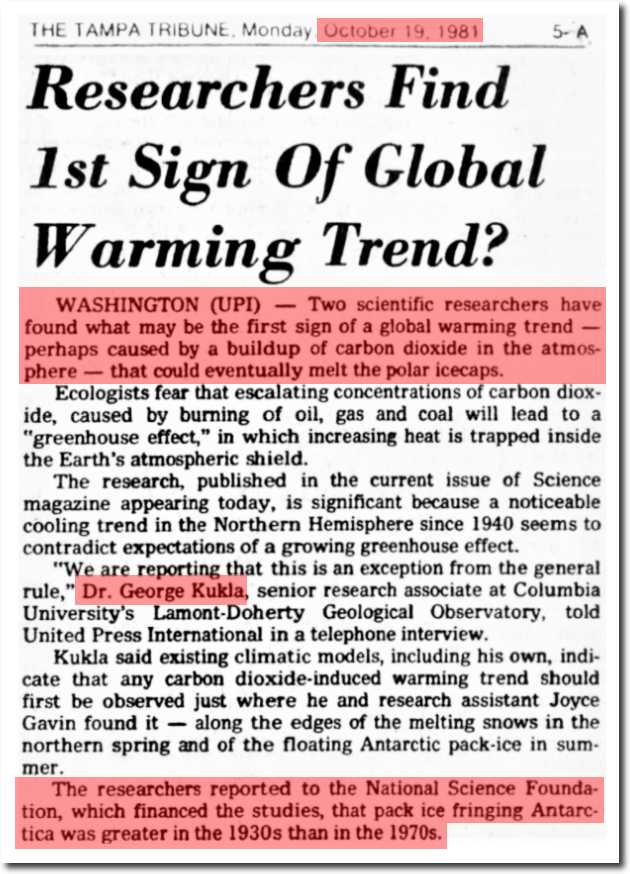
19 Oct 1981, 5 – The Tampa Tribune at Newspapers.com
As the IPCC reported in 1990, Arctic and Antarctic trends go opposite each other. Arctic ice increased from 1973 to 1981, and Antarctic ice decreased during that same period.
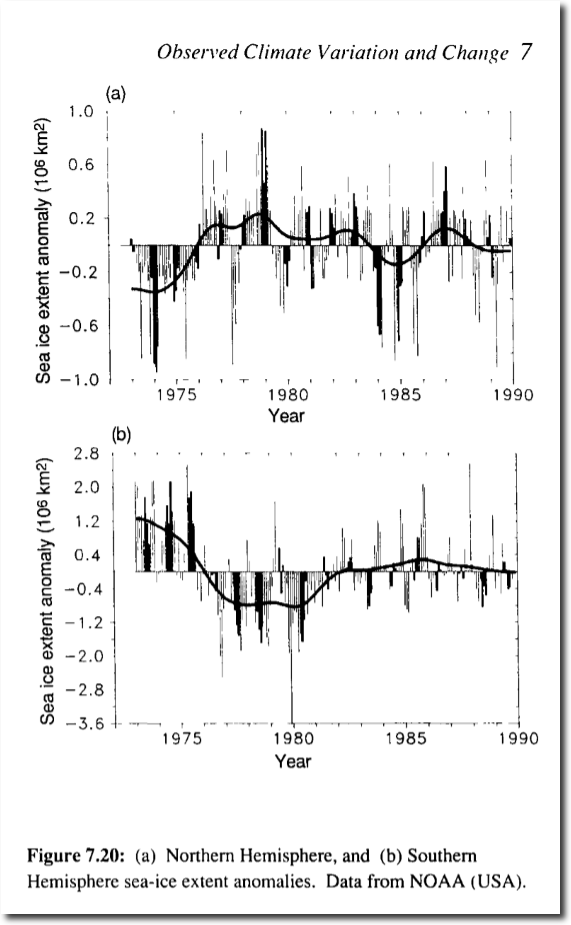
https://www.ipcc.ch/ipccreports/far/wg_I/ipcc_far_wg_I_chapter_07.pdf
Kukla ignored the increase in Arctic ice in his 1981 study, just as climate scientists now ignore the increase in Antarctic ice since 1981.
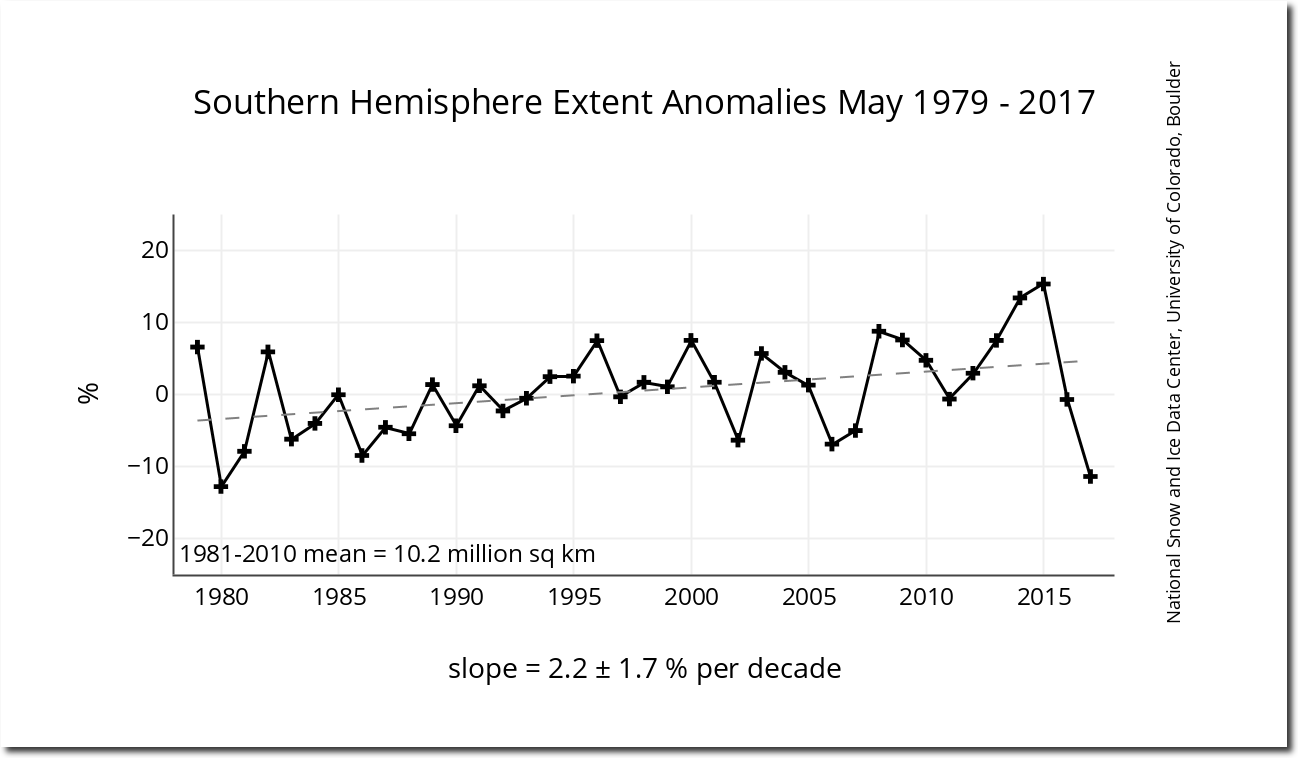
S_05_extent_anomaly_plot_hires_v3.0.png (1260×720)
The one thing constant in climate science is that climate scientists will say whatever is required to obtain funding, and they will cherry-pick their data as necessary. What they are doing has absolutely nothing to do with science.


