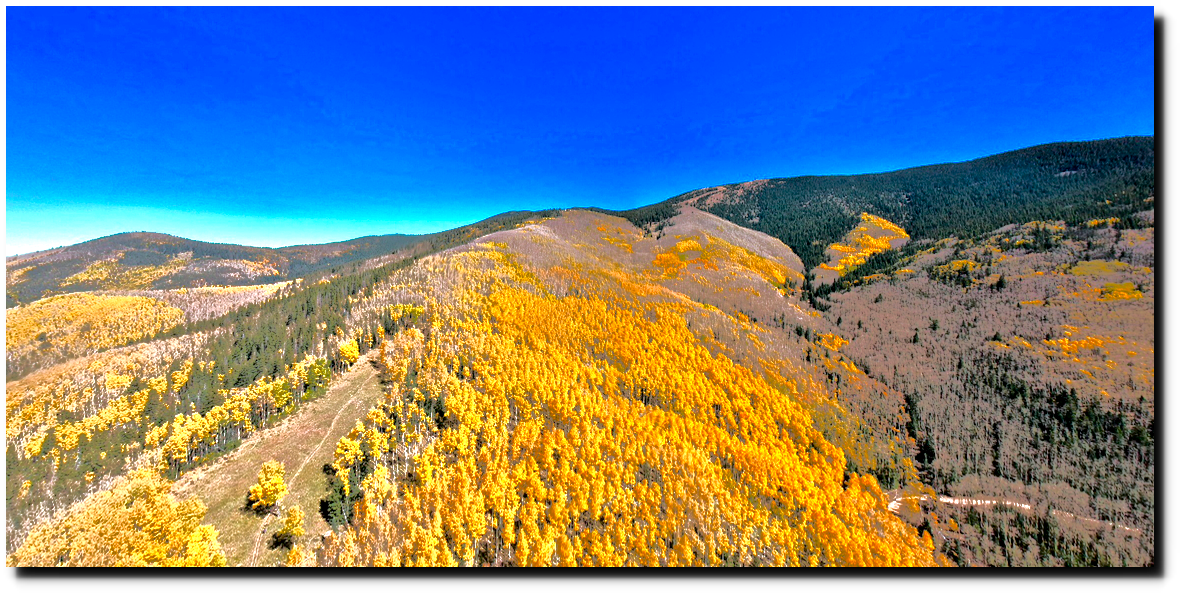
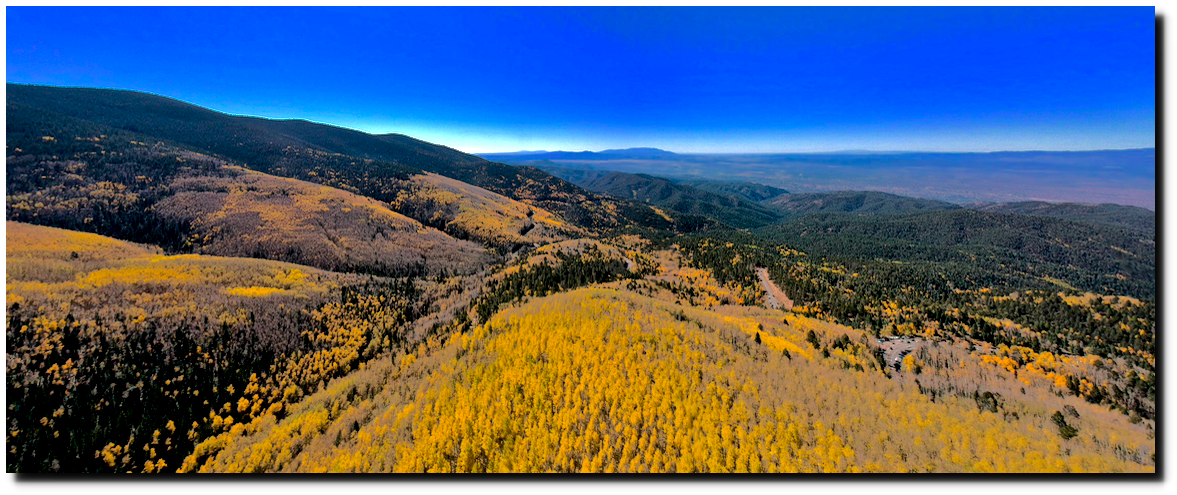
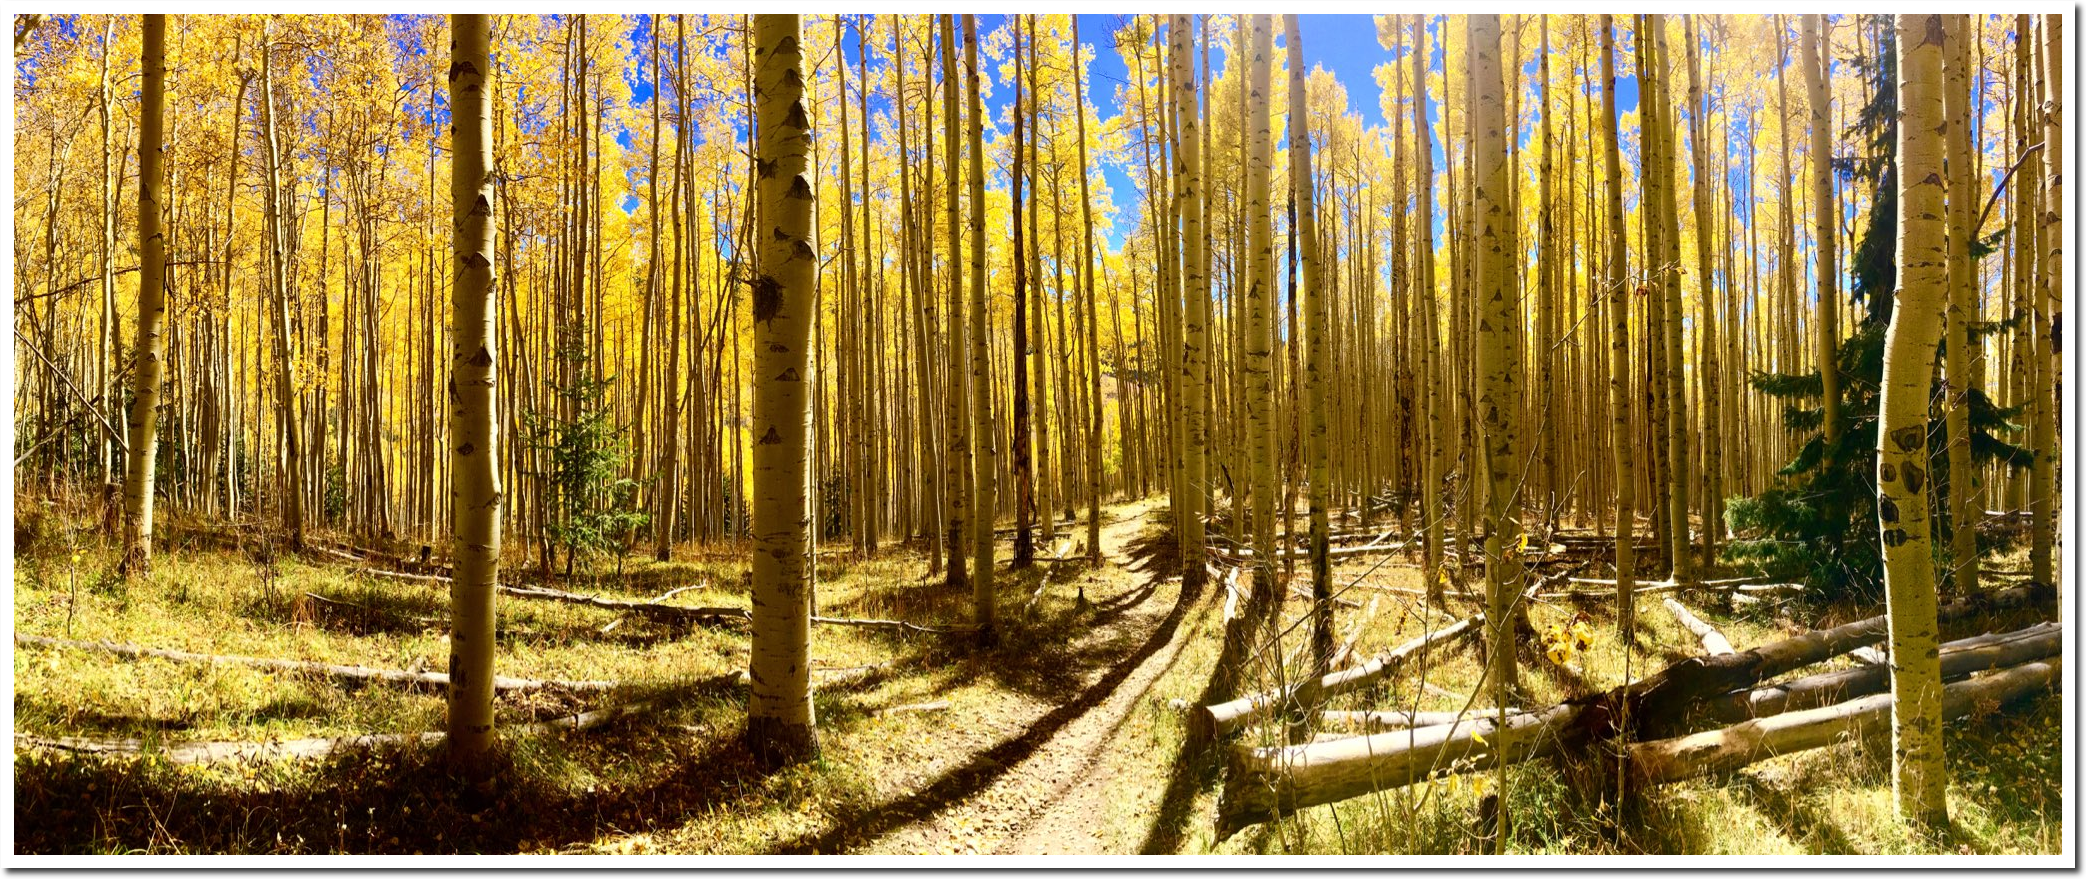
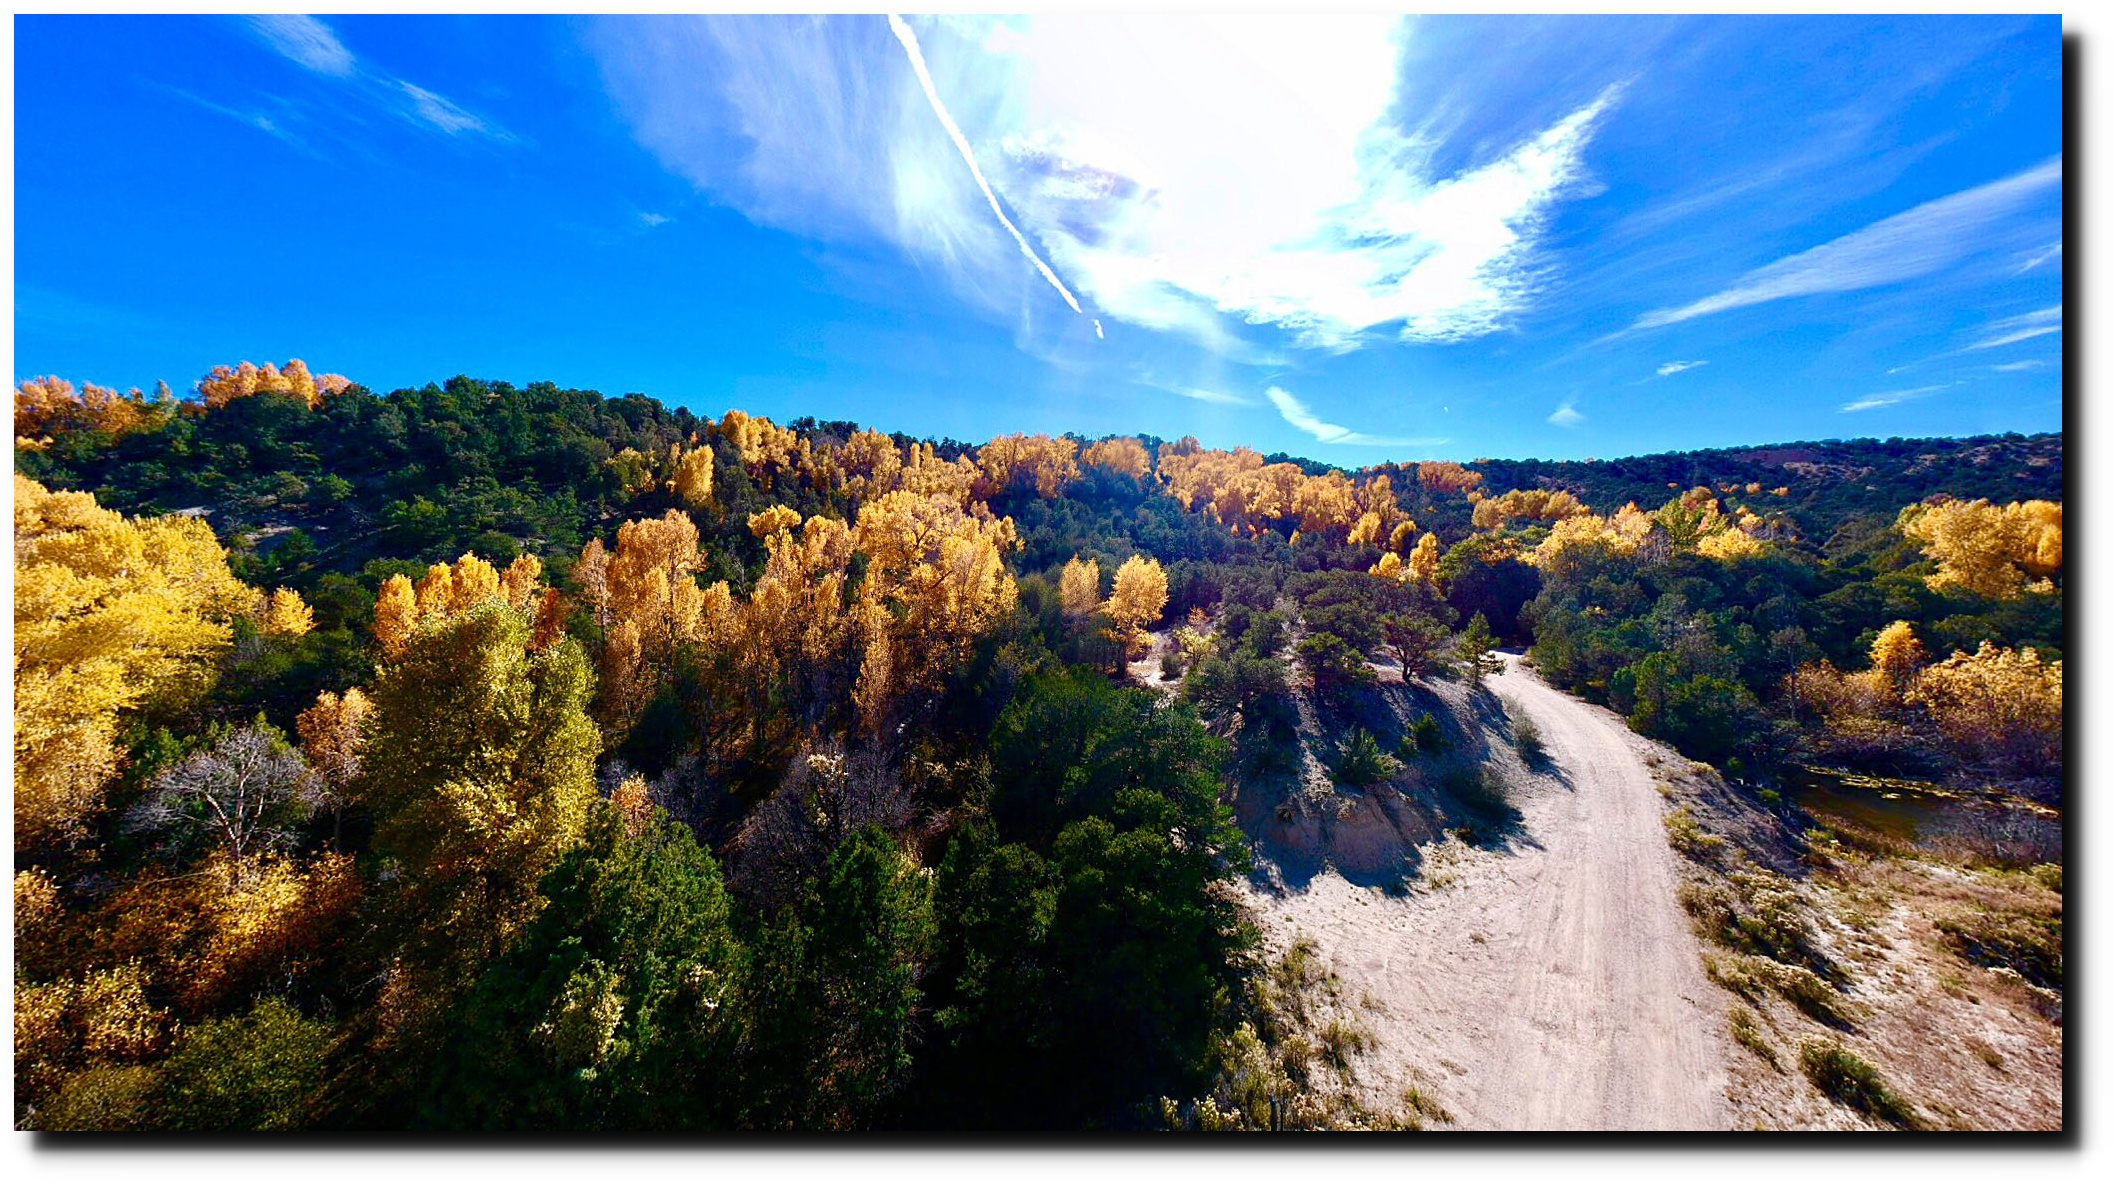
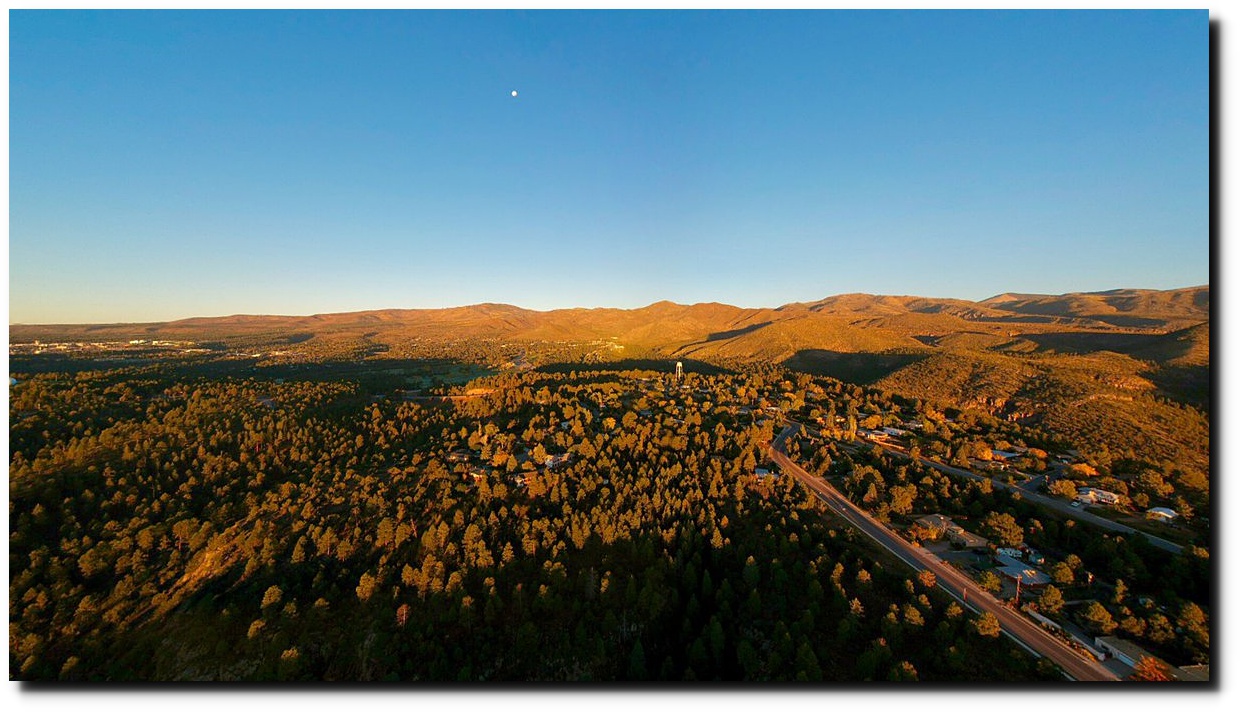
Winter has arrived, but the last week of the very short autumn in Colorado and Northern New Mexico was beautiful.

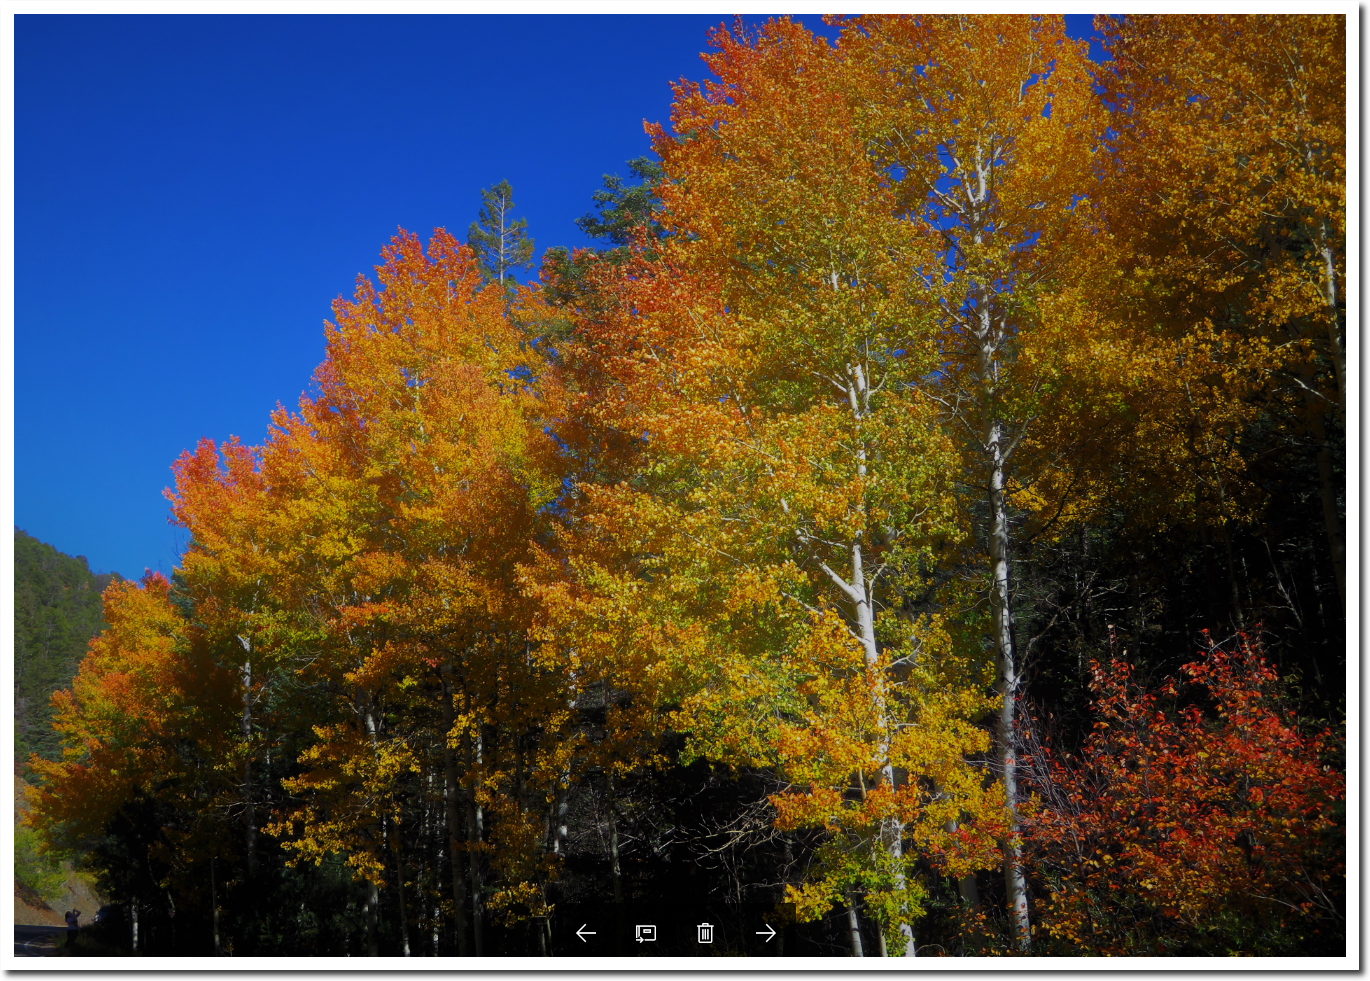


Winter has arrived, but the last week of the very short autumn in Colorado and Northern New Mexico was beautiful.
October 9 used to be a very warm day in the US, but temperatures have declined over the past century.
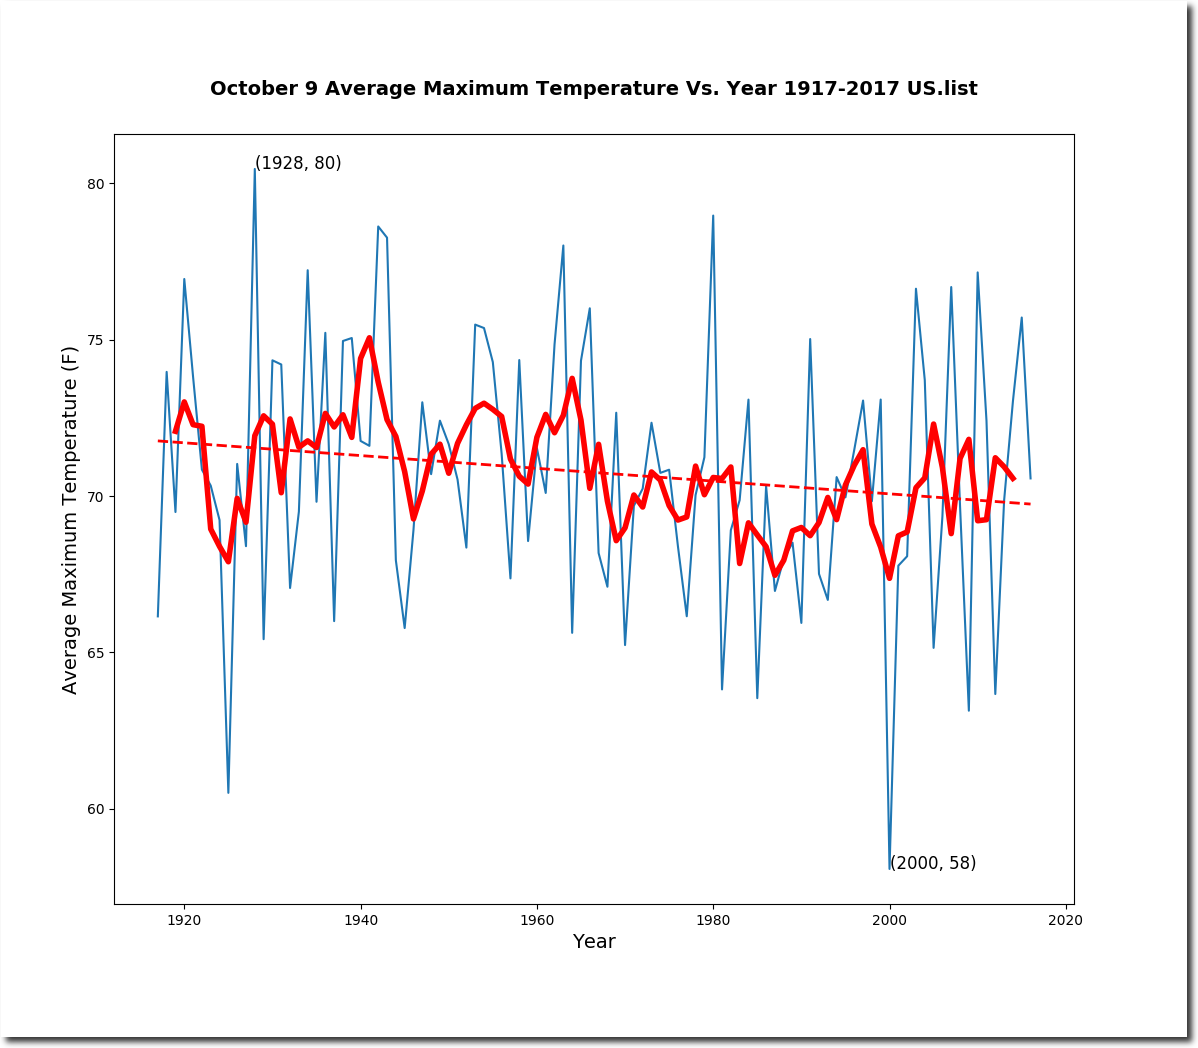
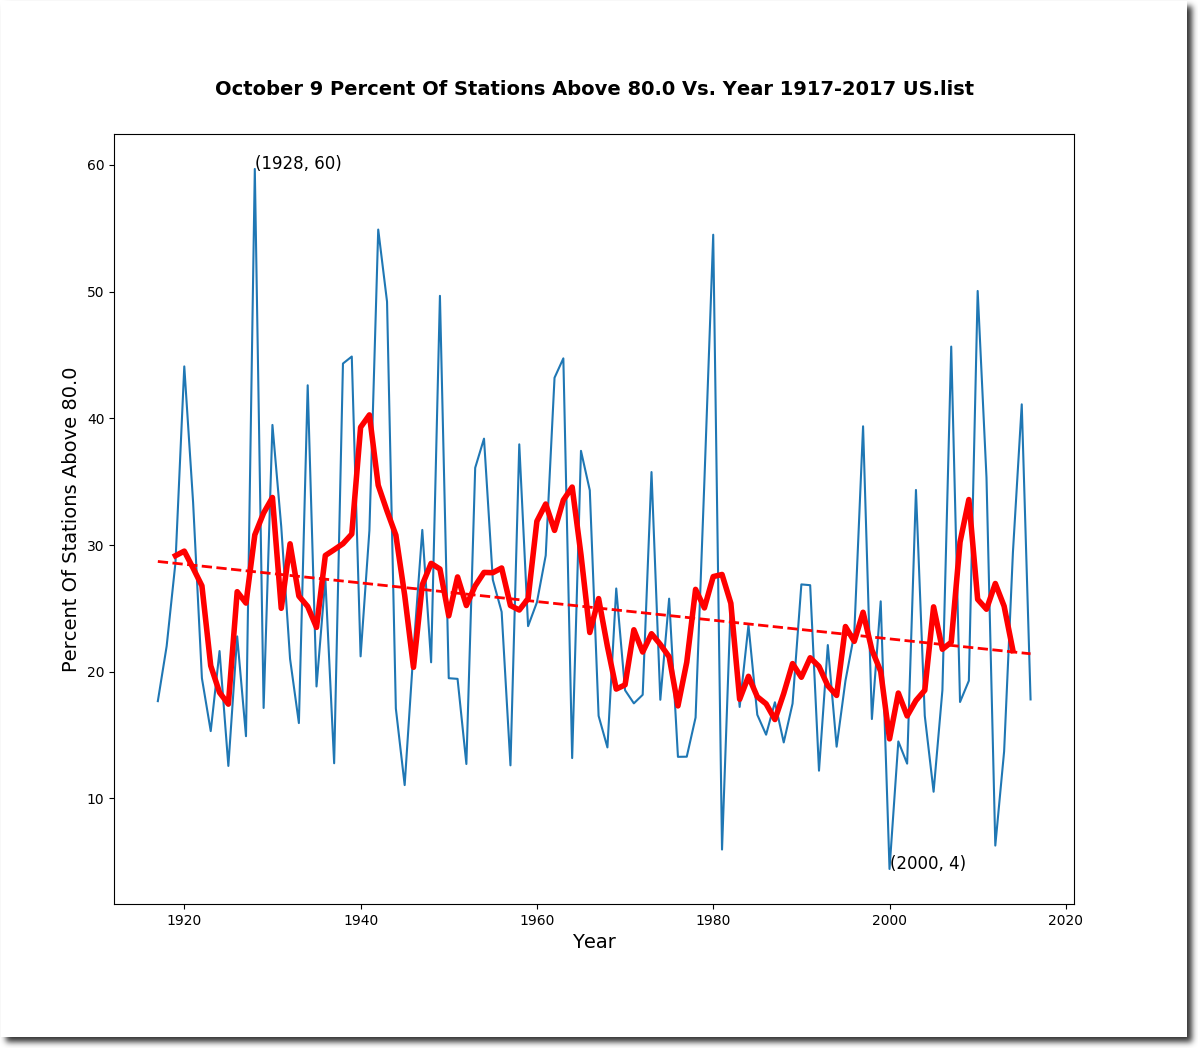
On this date in 1928, Most of the eastern US was over 80F, much of the Midwest was over 90F, and Pine Bluff, Arkansas was 100F

Fake scientists Zeke and Nick would of course try to claim that the past heat was due to “changing station composition” – but if we look at the complete set of stations which have been continuously active over the past century, we see exactly the same pattern.

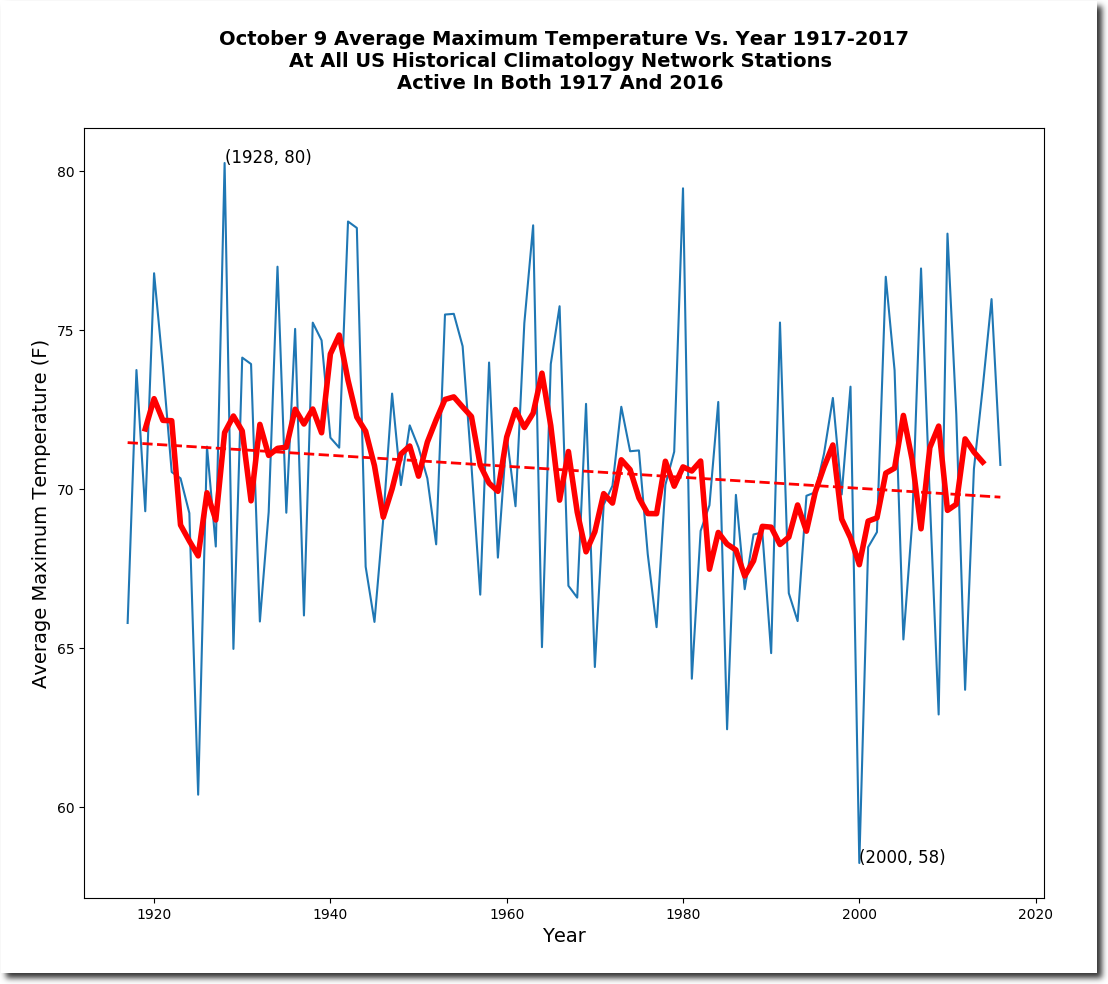
The US used to be much warmer, and attempts to hide this are not based on science.
We had a big snowstorm on May 18

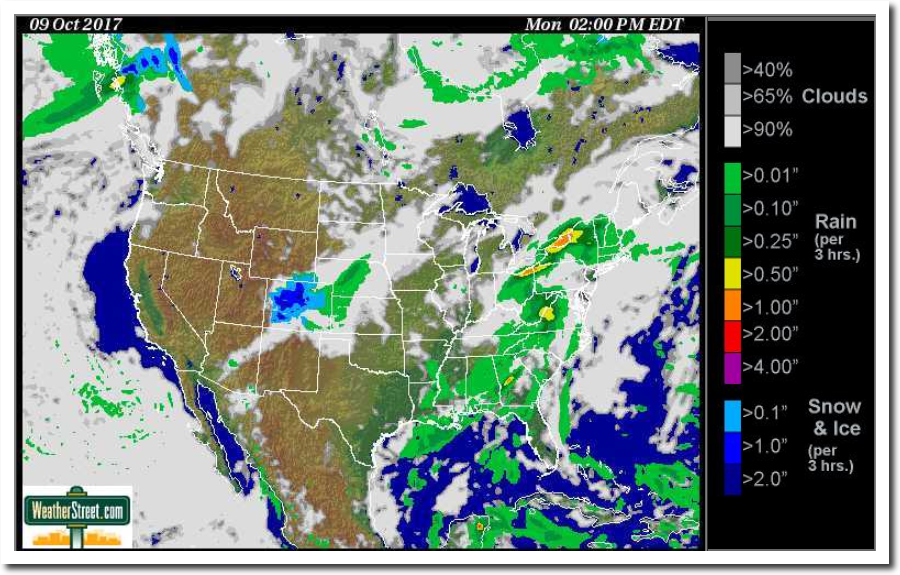
And we have a big snowstorm forecast for Monday. That will be 144 days between snowfalls greater than 5cm (2 inches) beating the previous record of 147 days – set seventy years ago.
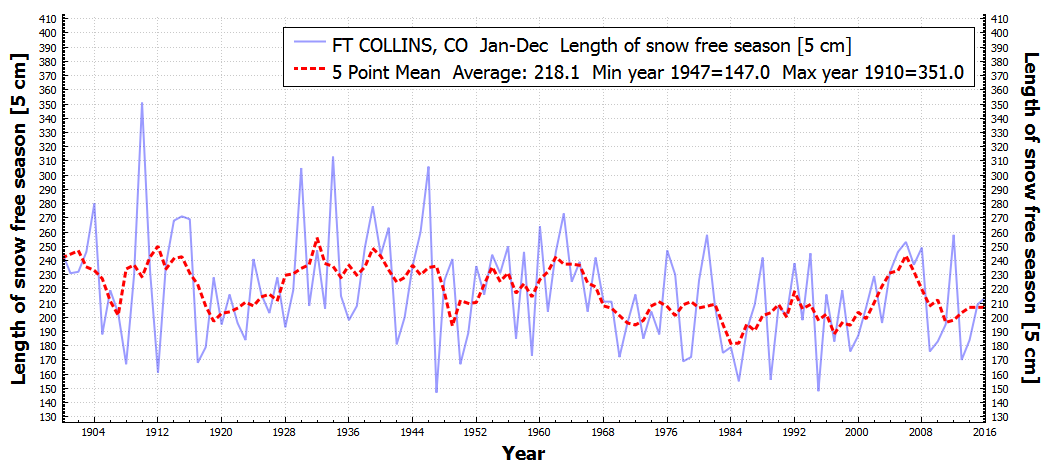
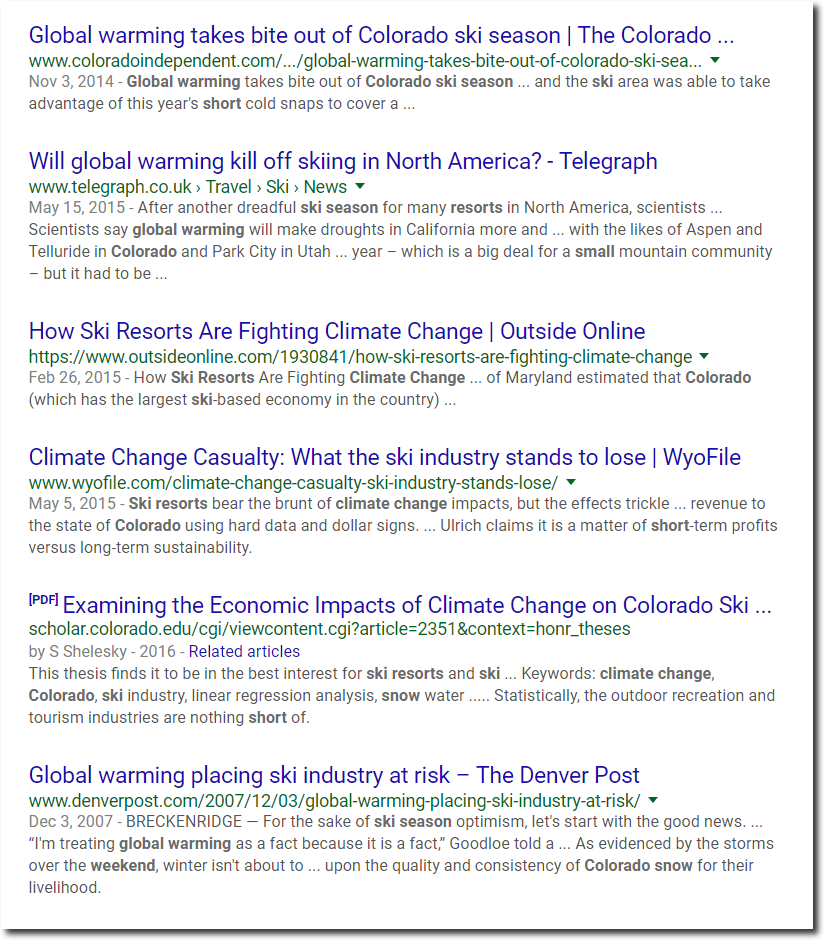
Climate experts say global warming makes Colorado’s ski season shorter and will destroy our ski industry. This is because they are criminals pushing an agenda, not scientists.
Hillary’s closest associates are sexual predators, but that isn’t newsworthy. However, Trump saying “pussy” was all the press could talk about for a month.


CNN didn’t find this to be newsworthy.

Nick and Zeke’s favorite justification for NOAA data tampering, which turns US cooling into warming – is “changing station composition” – i.e. the set of USHCN stations isn’t identical from year to year. In this post I examine that rationalization.
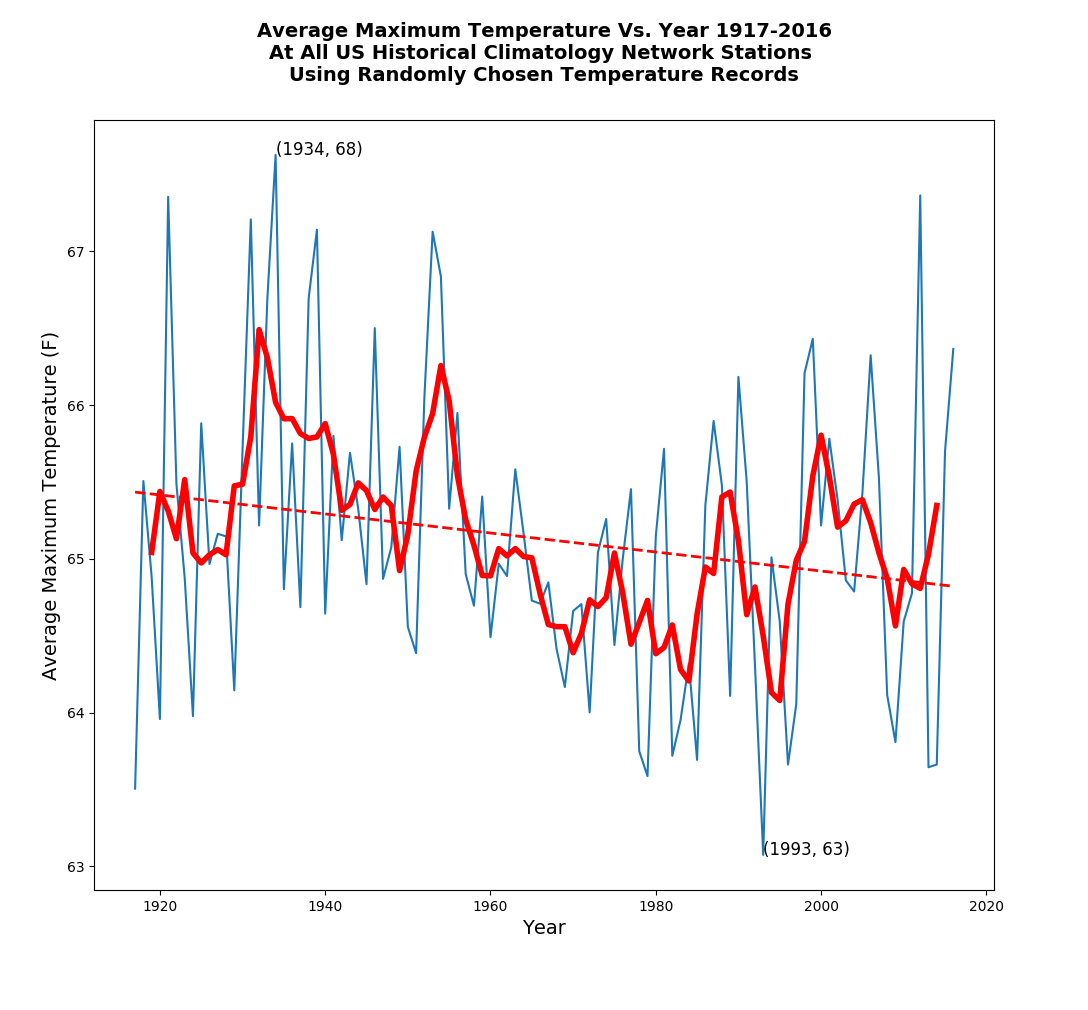
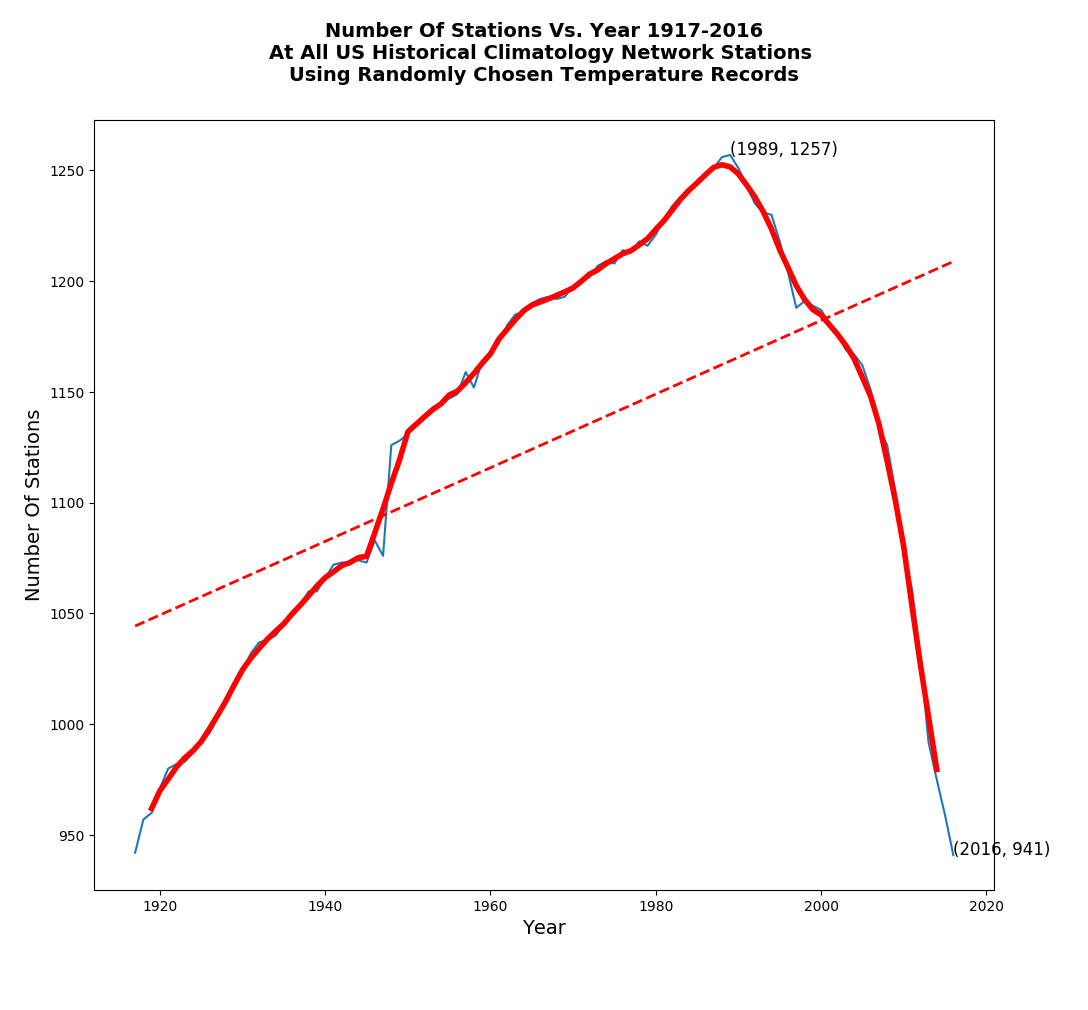
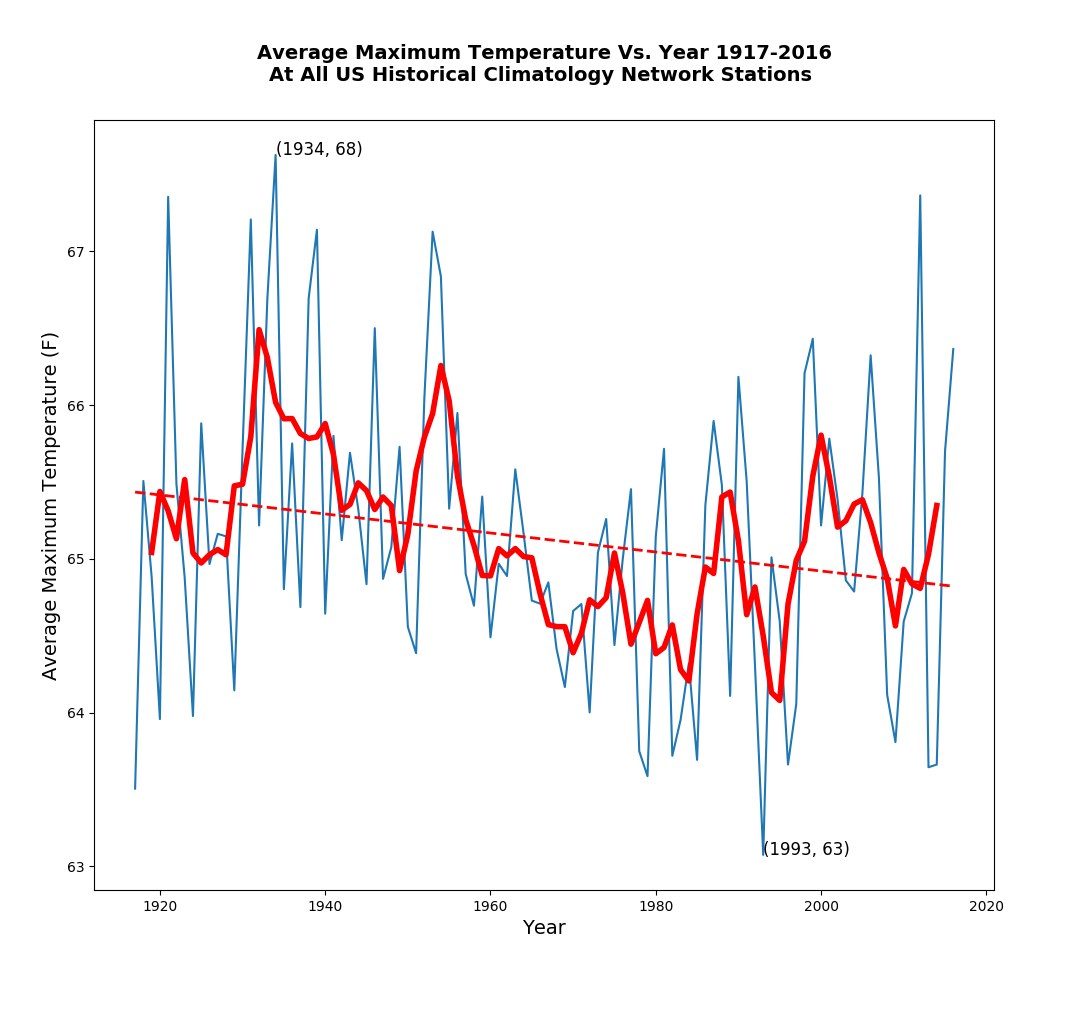
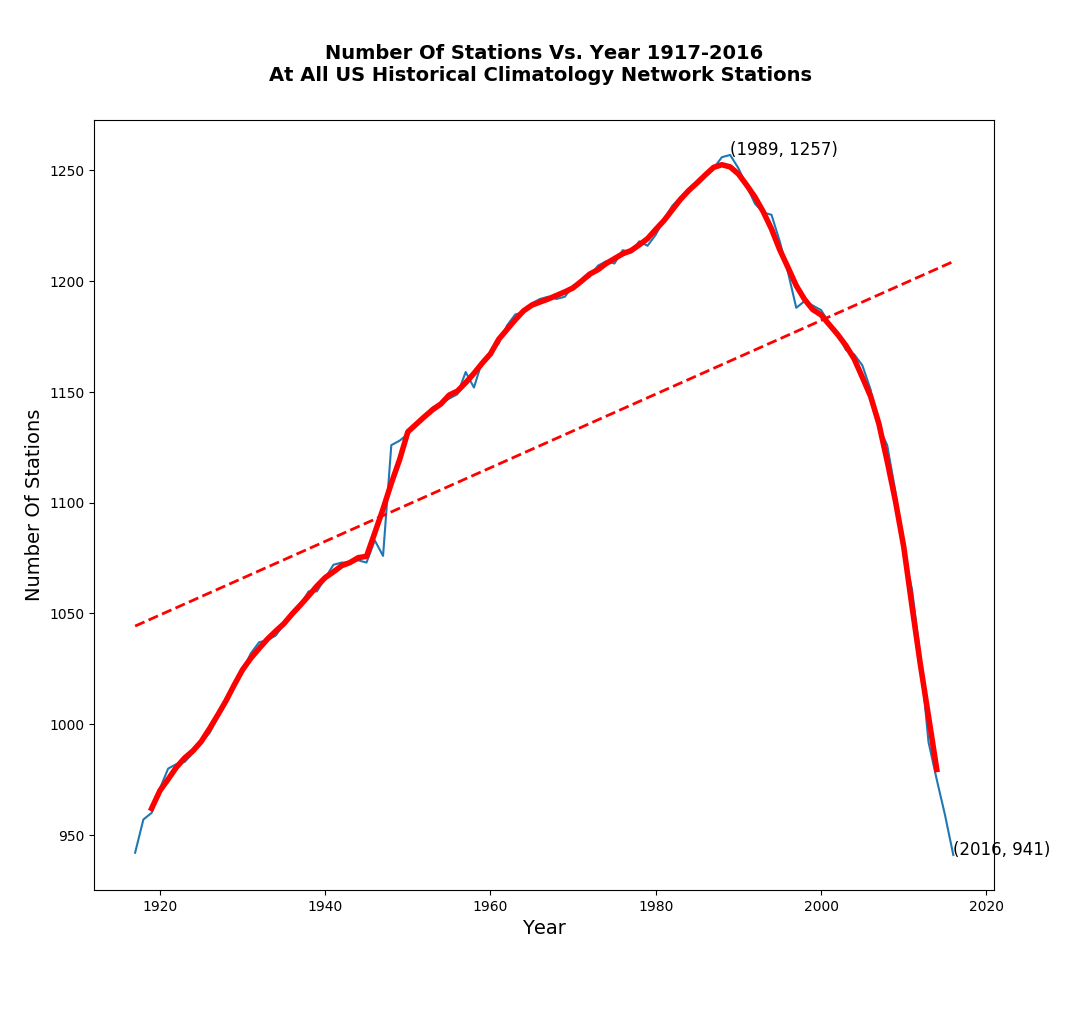
Rather than attempting to adjust the temperatures, let’s do a much more rigorous experiment – and simply use a set of stations which haven’t changed. There are 747 US stations which were continuously active over the past century. Examining them, they show exactly the same pattern as the set of all stations.
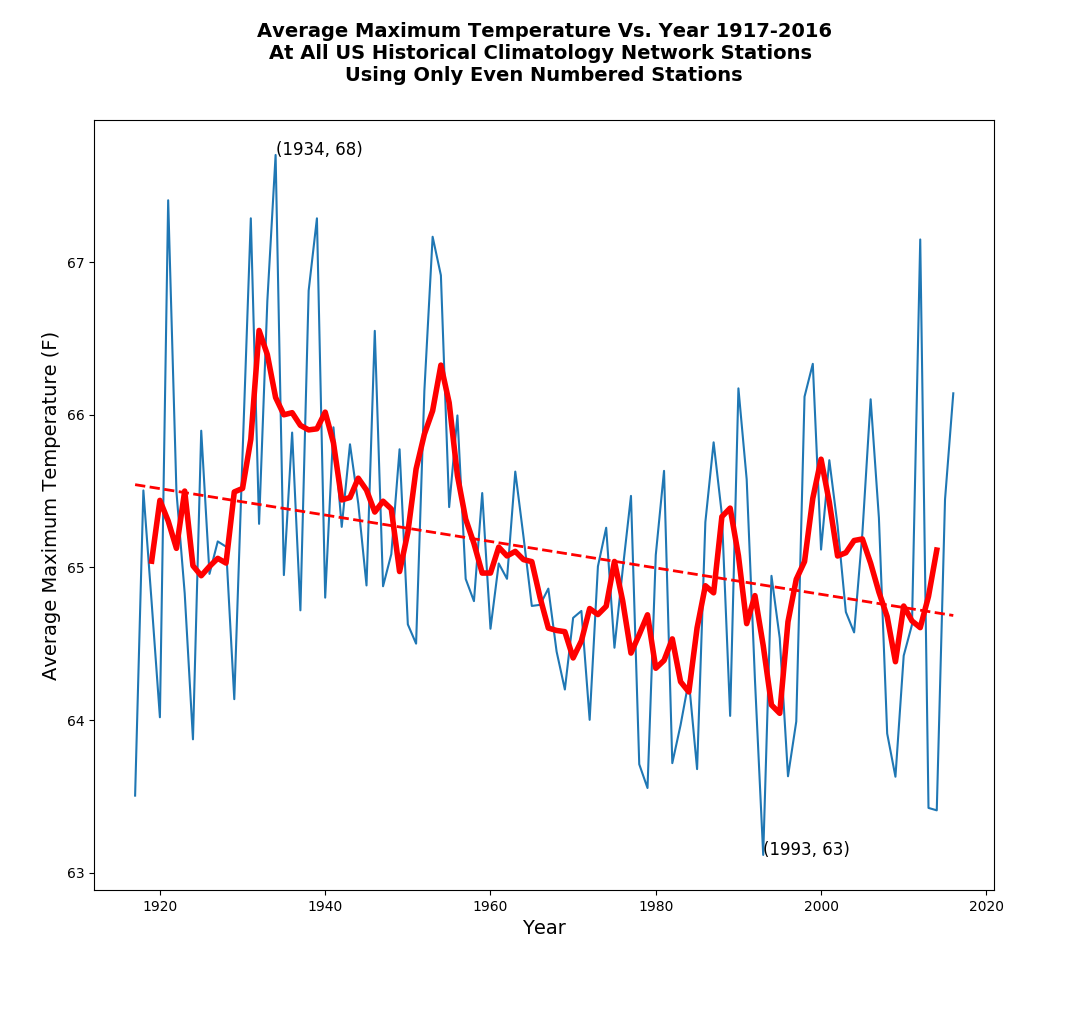
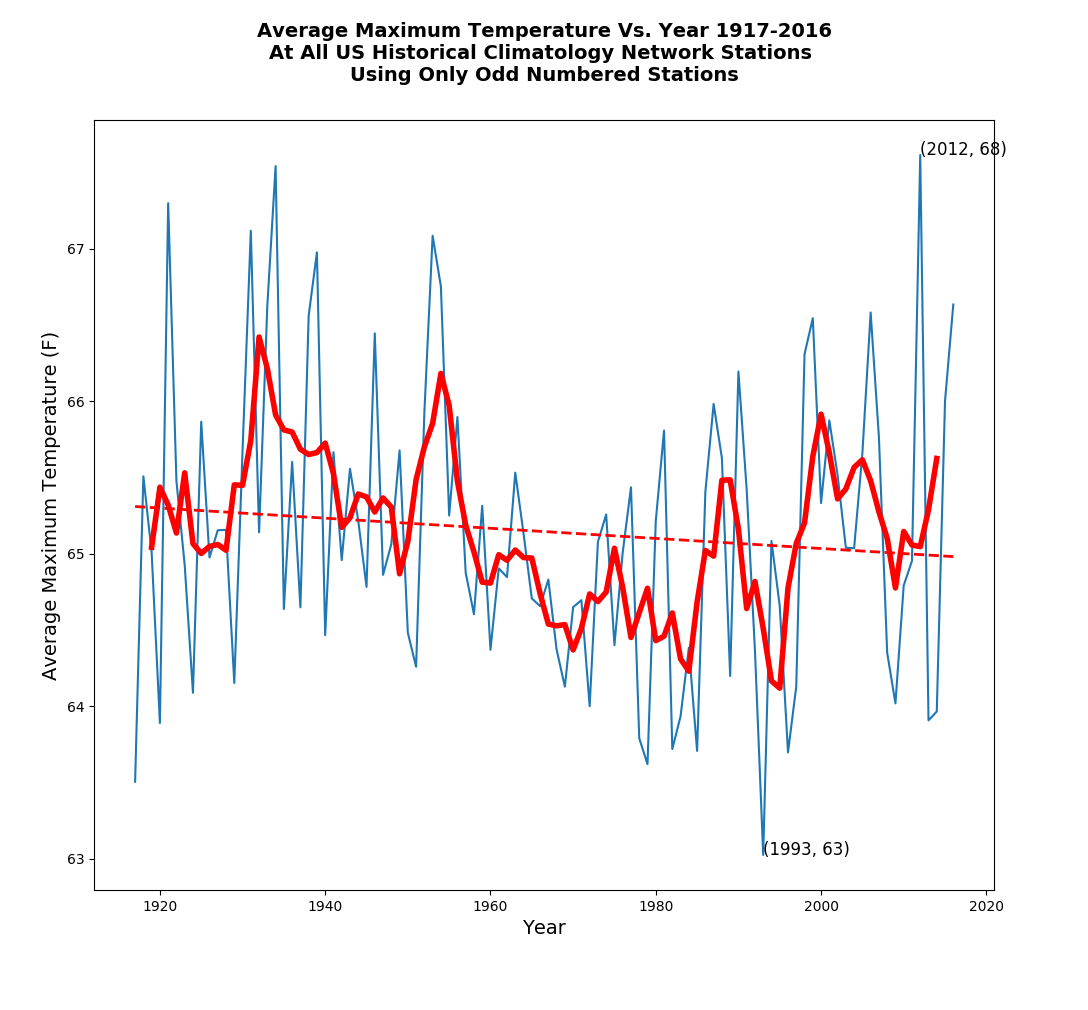
Using the set of 747 unchanging stations, maximum temperatures have declined over the past century – just like they do in the set of all stations.
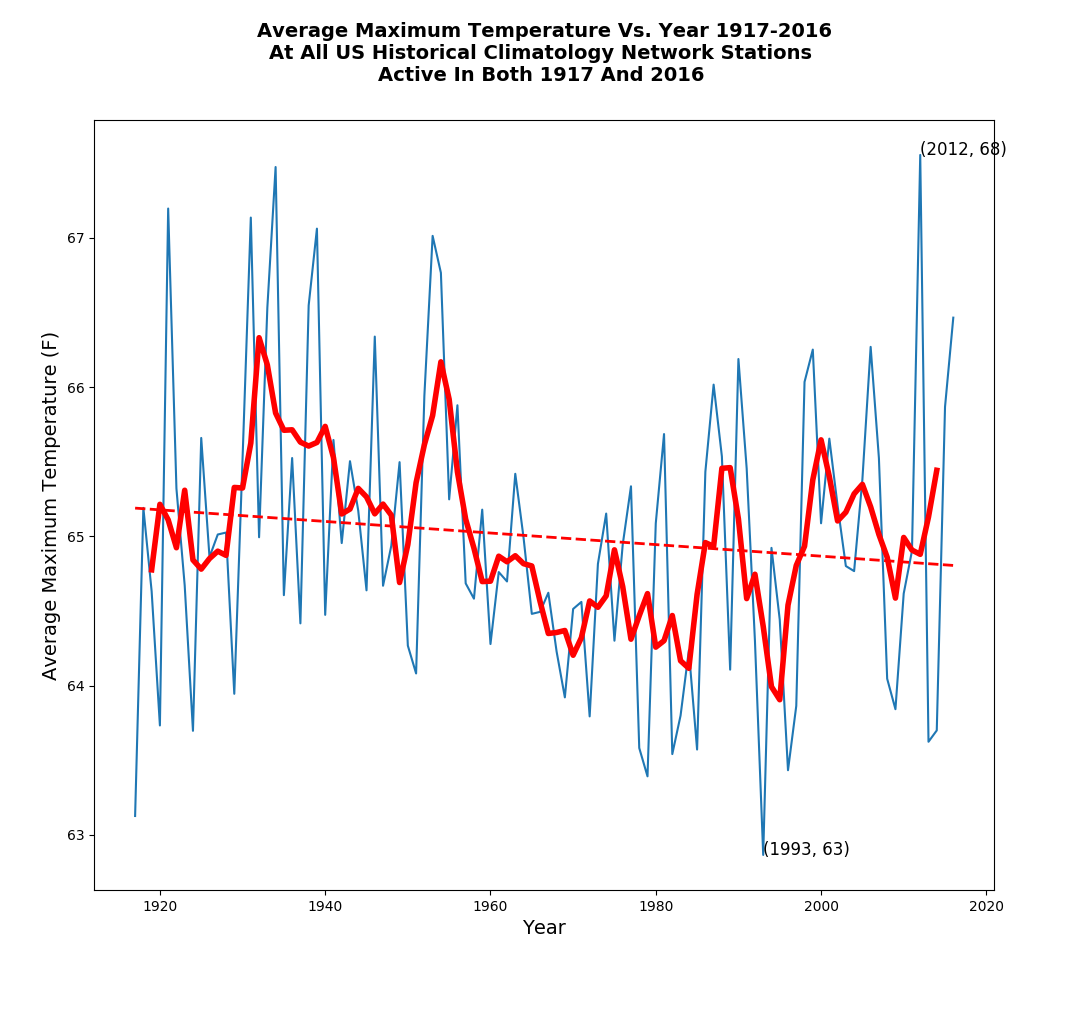
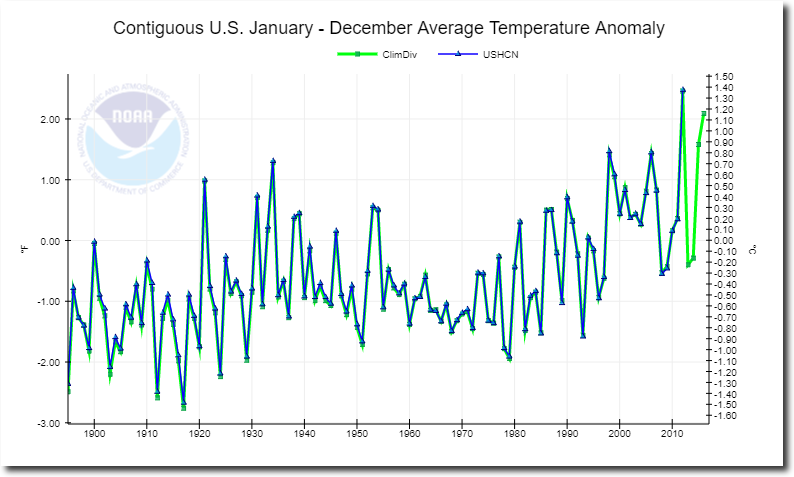
Here is the equivalent NOAA “adjusted” graph for all stations. NOAA has turned cooling into warming via data tampering.

Climate at a Glance | National Centers for Environmental Information (NCEI)
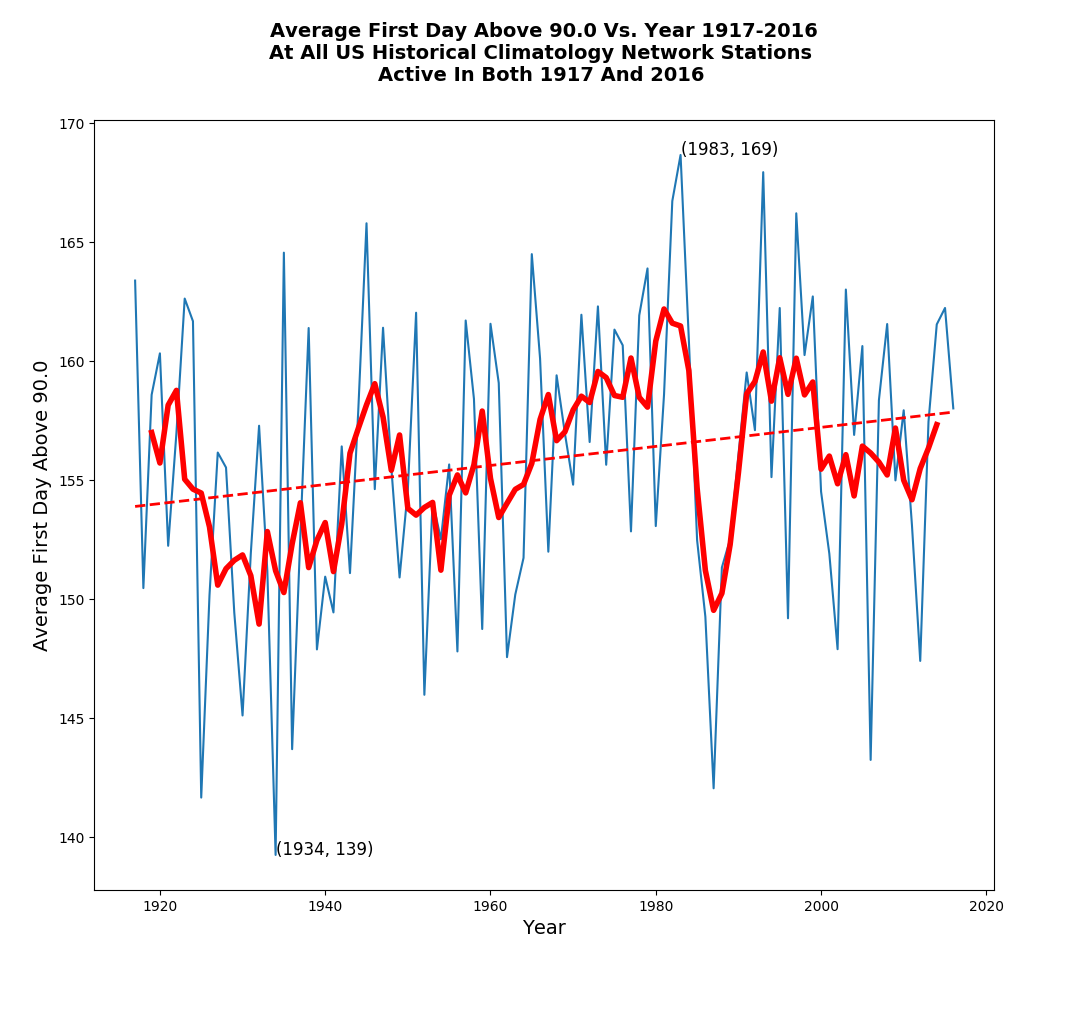
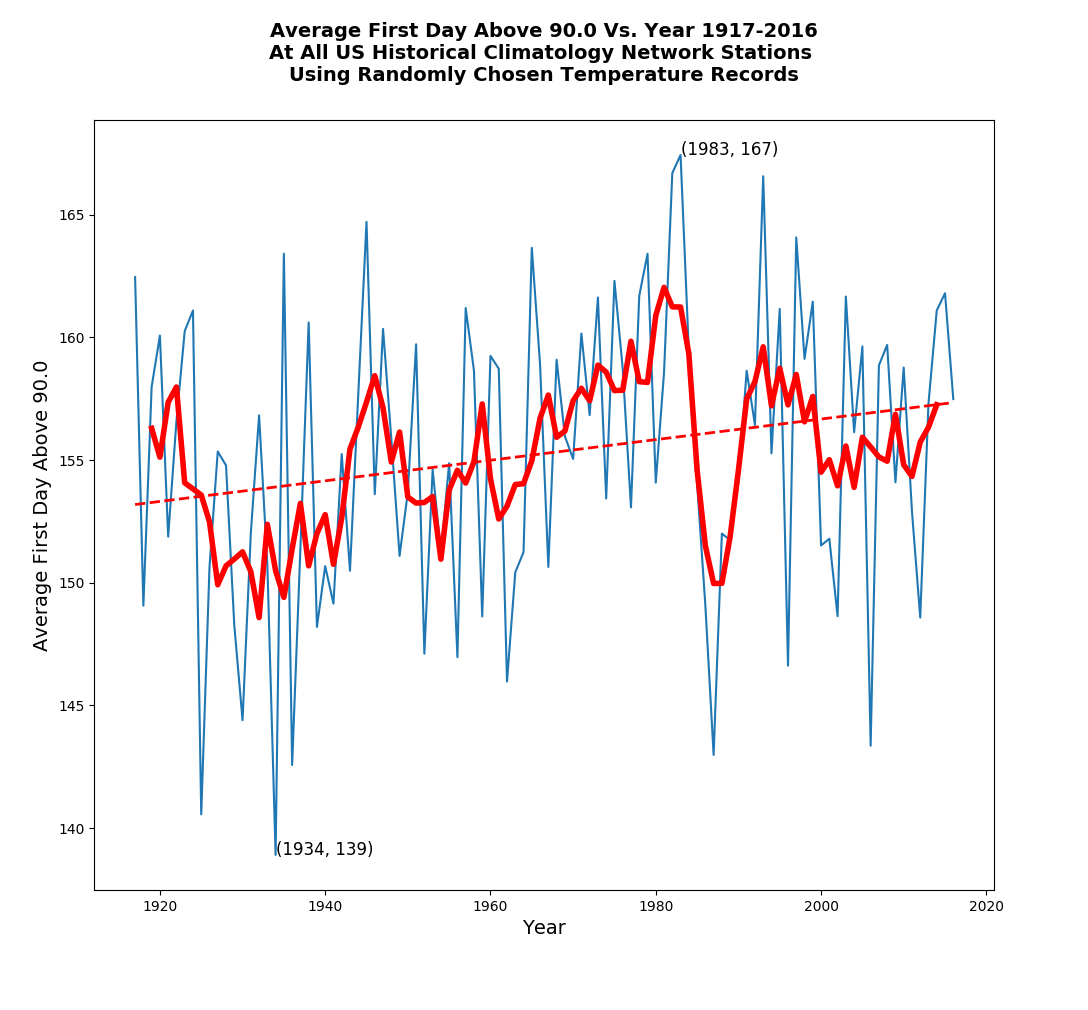
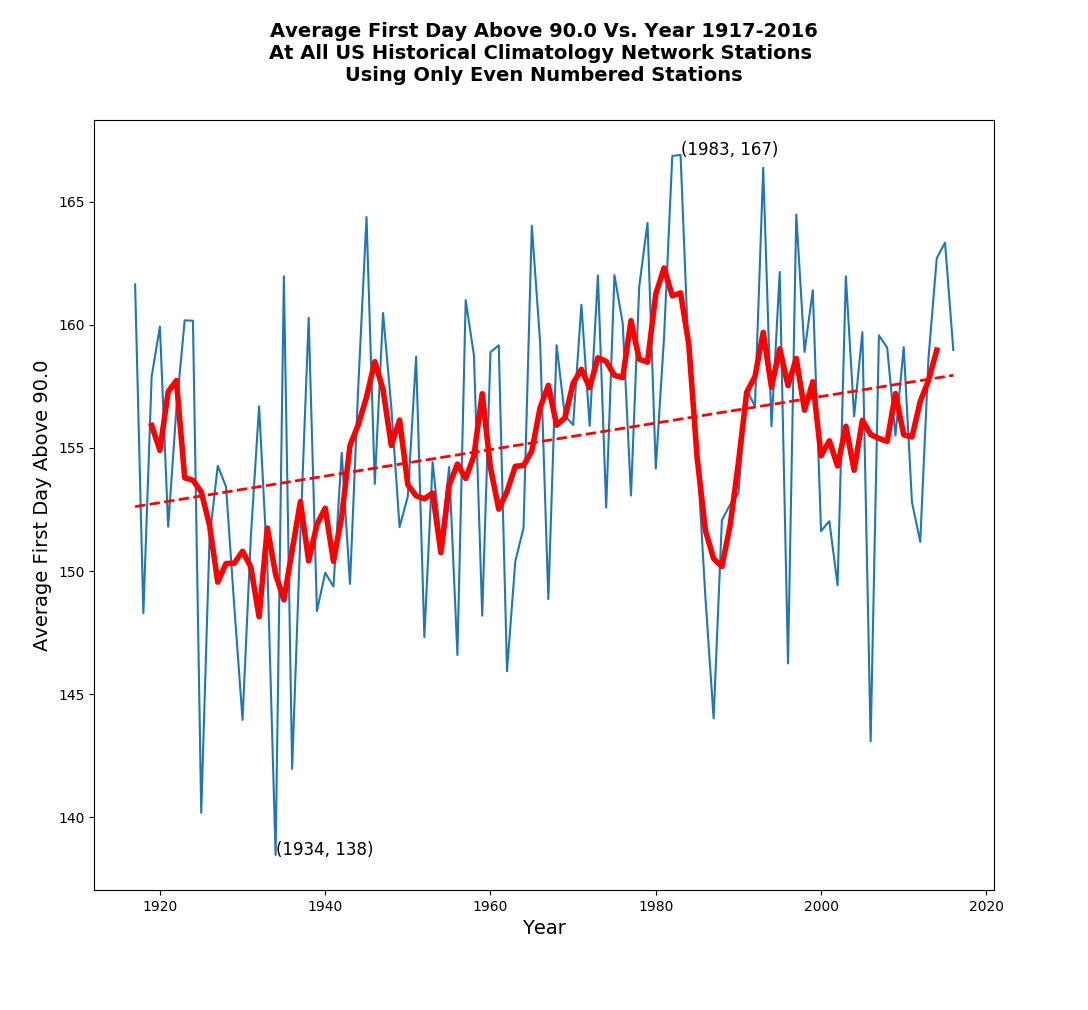
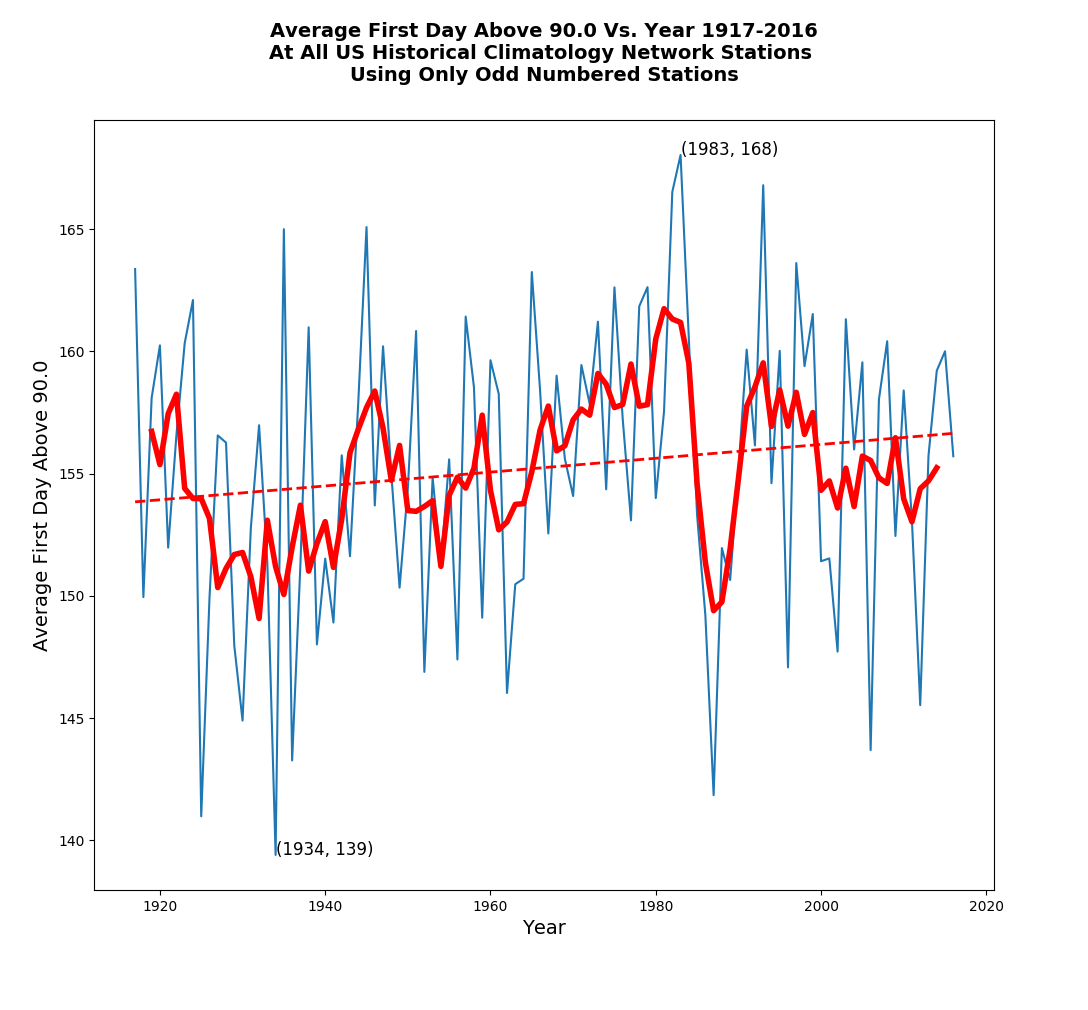
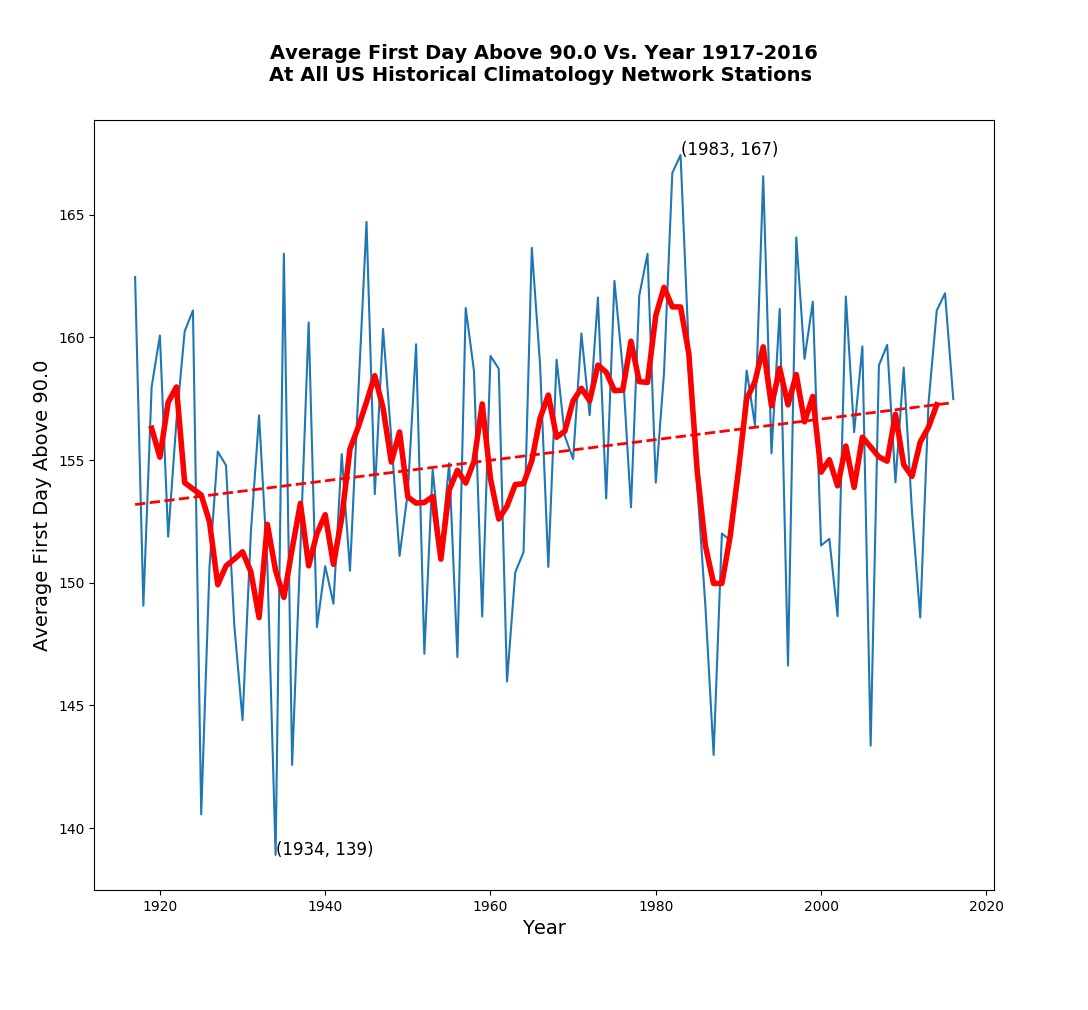
Looking at the set of 747 unchanging stations, the first hot day of summer is coming later.
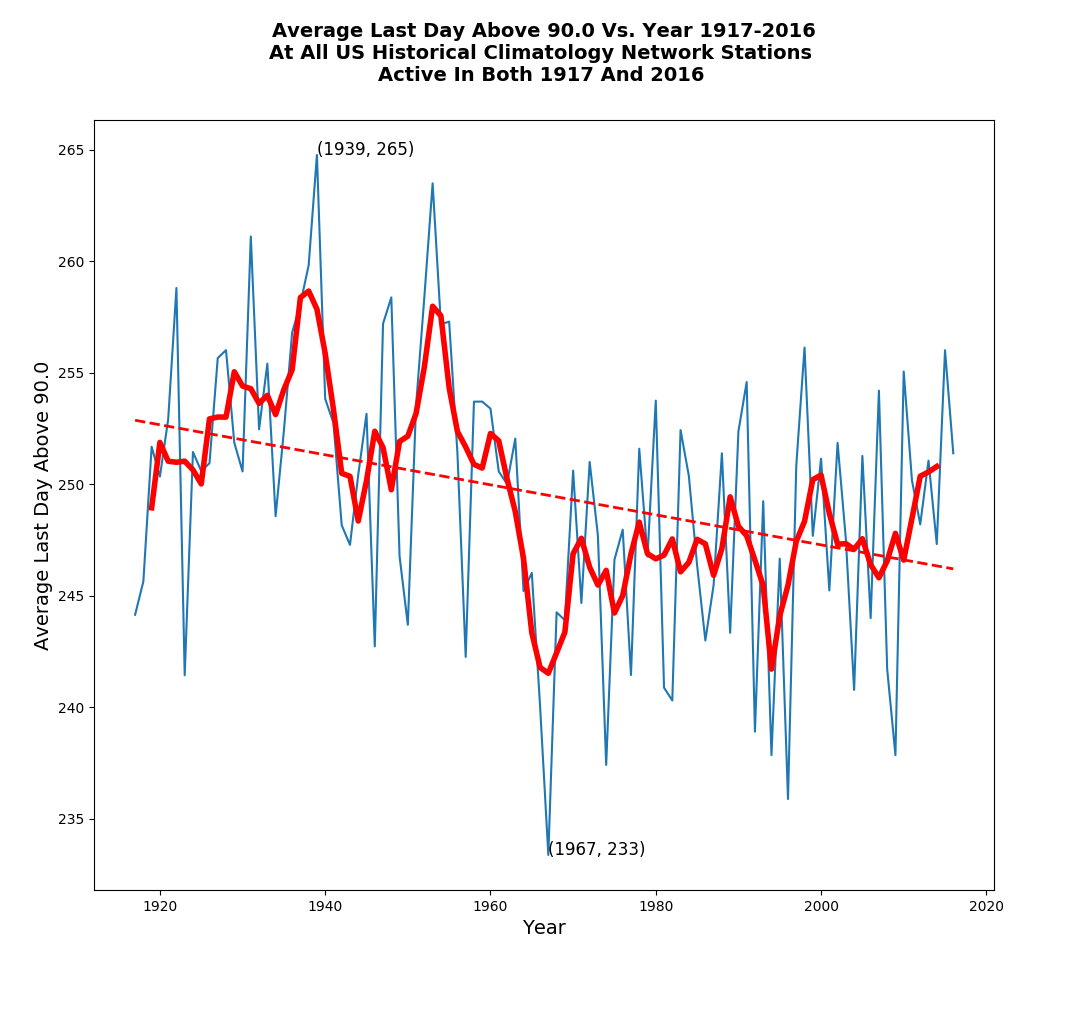
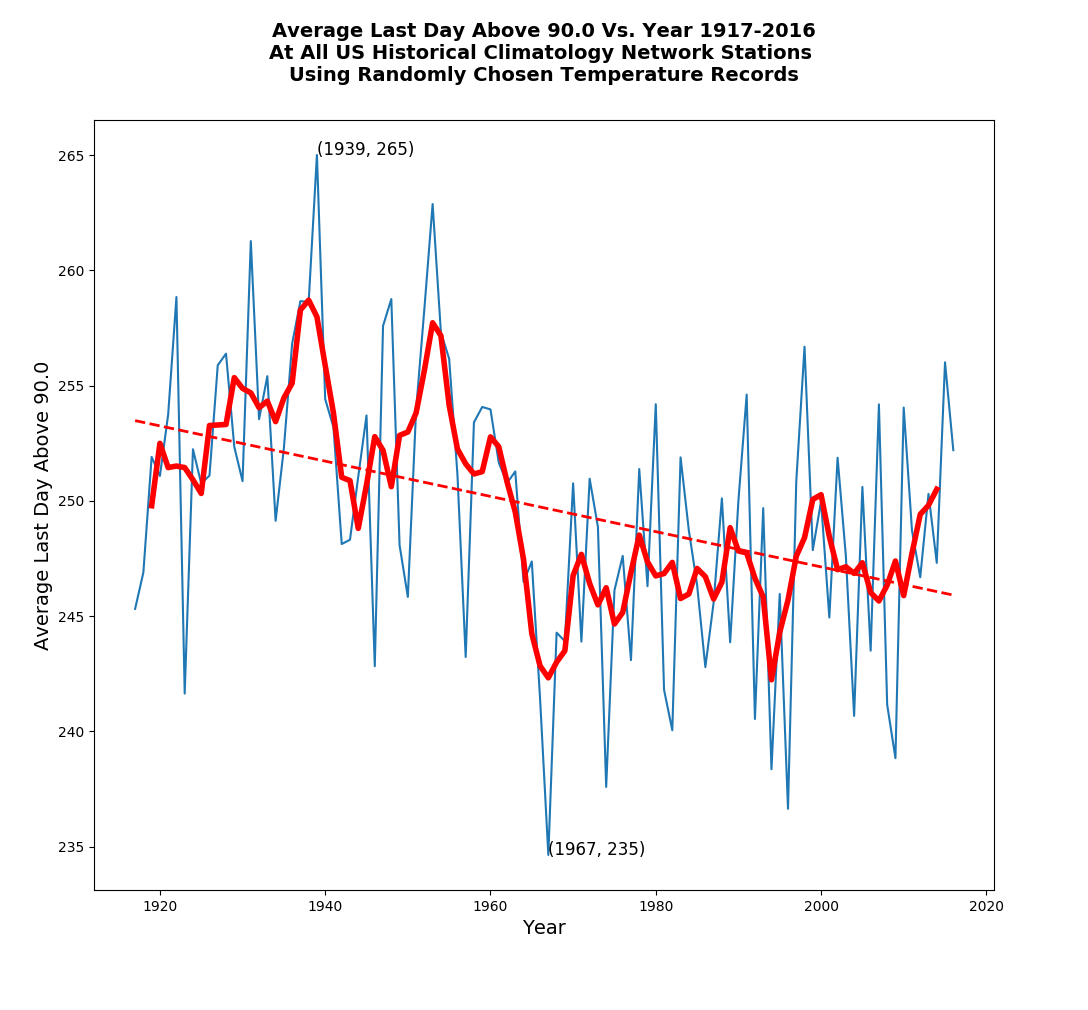
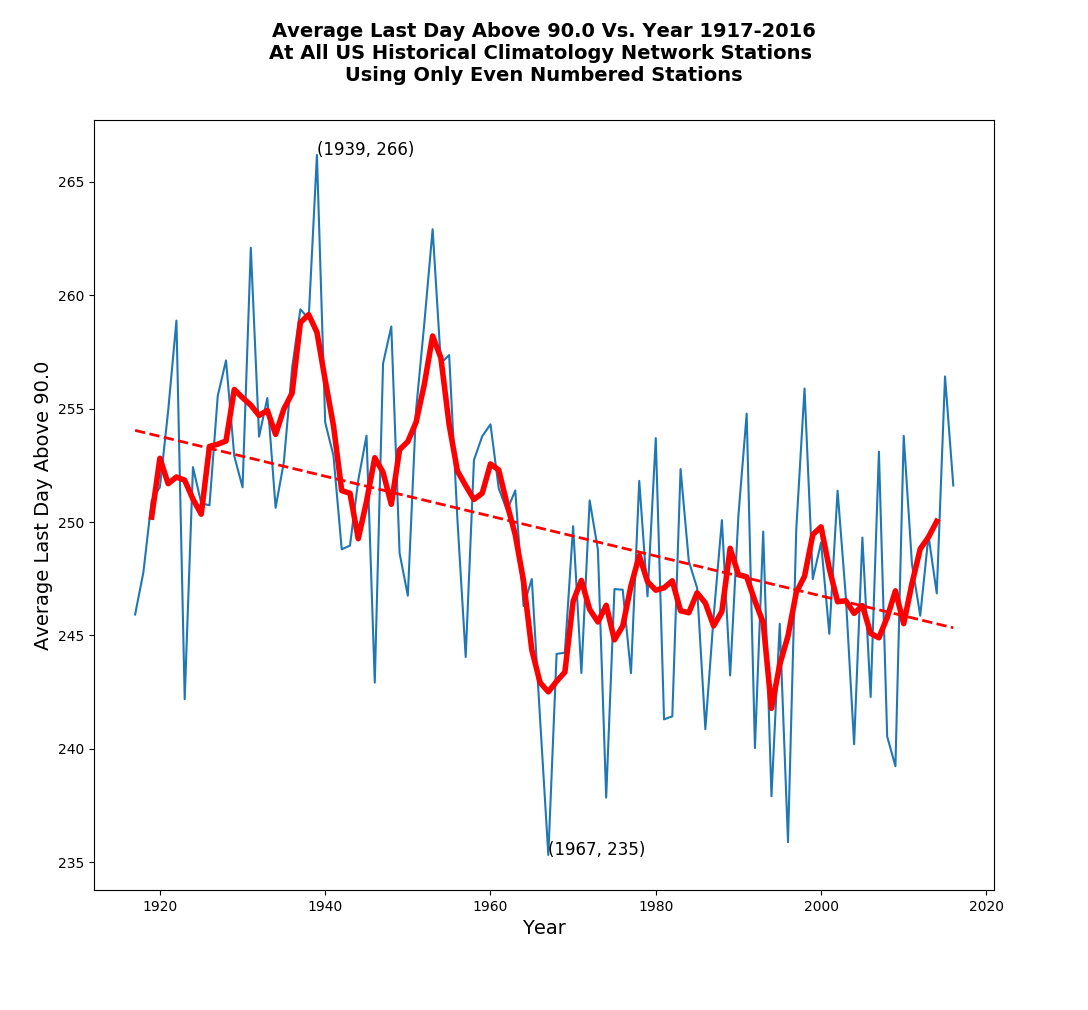
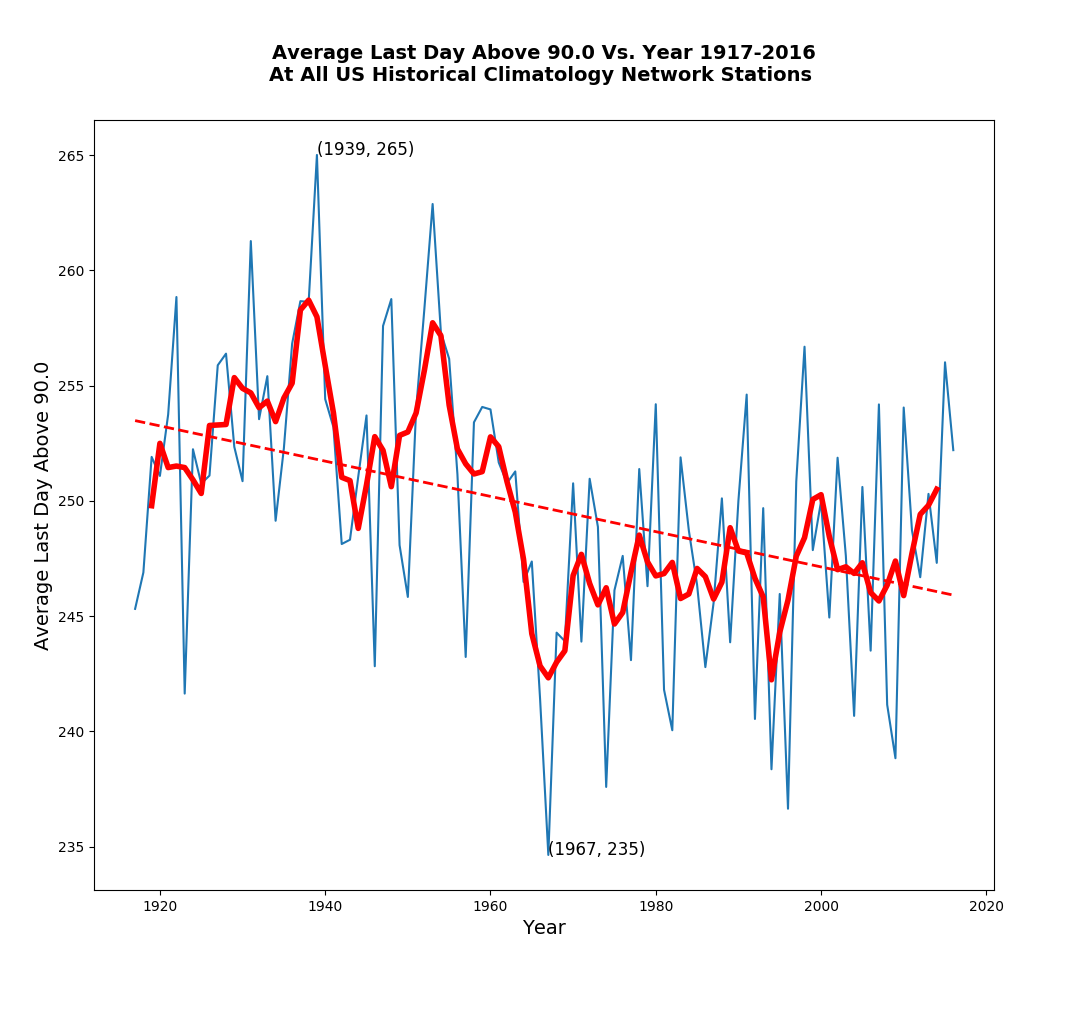
The last hot day of summer is coming earlier.
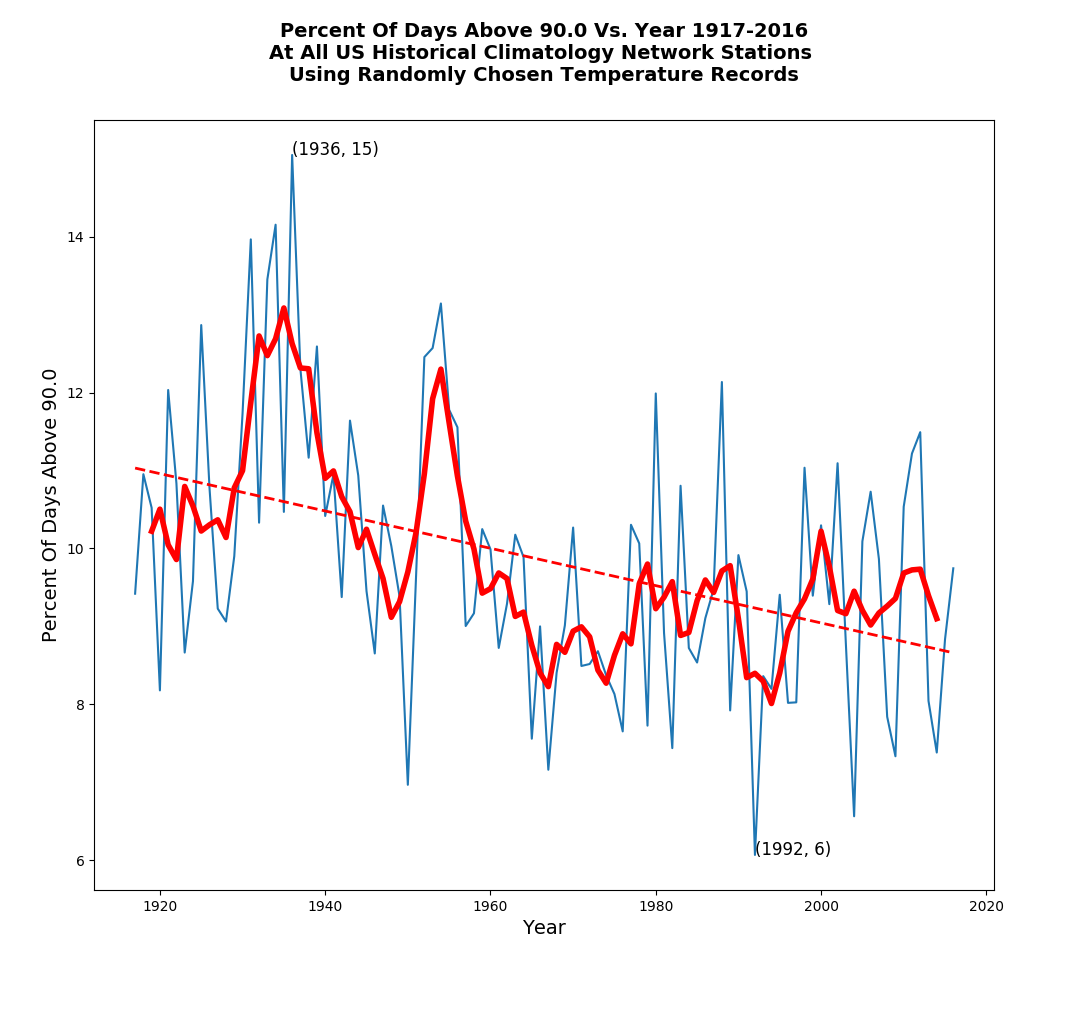
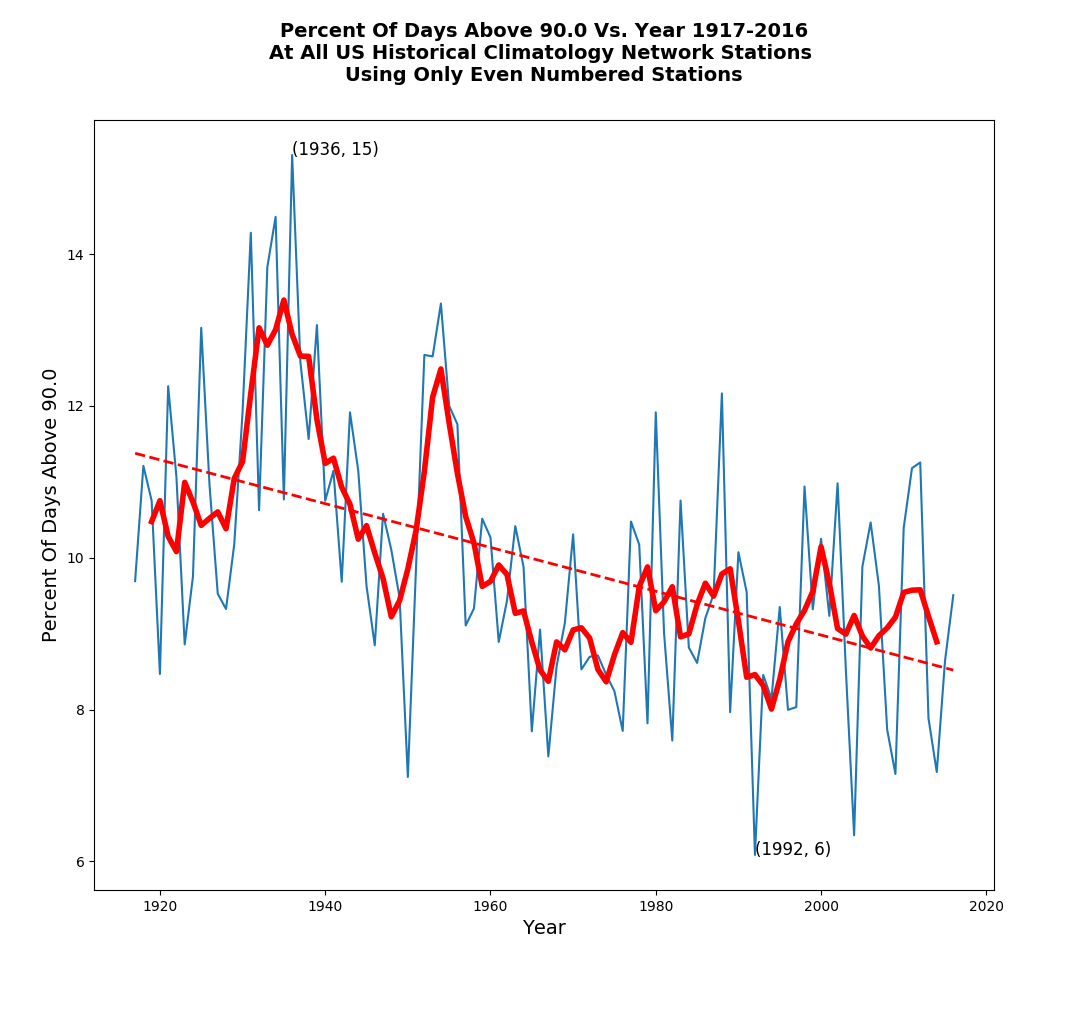
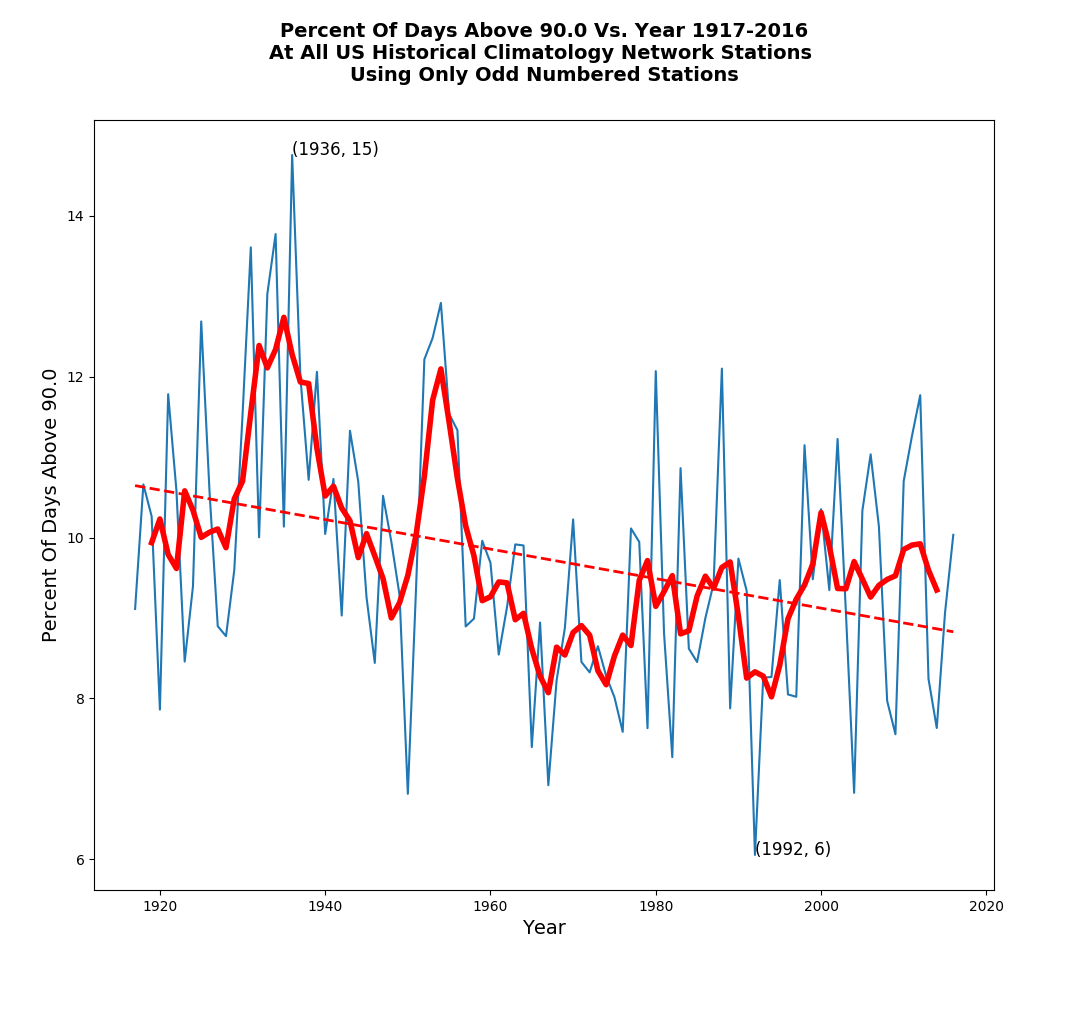
The frequency of hot days is declining.

We can already see that the adjustments are garbage. But lets’s proceed.
Now let’s try using a set of monthly data which is randomly chosen from month to month, so the station composition is changing dramatically every month. This experiment shows the exact same patterns as the set of all stations, indicating that the USHCN raw data is very robust, and changing station composition has little impact on patterns.
Now let’s try using only even numbered USHCN stations. Again, we see the same pattern as the set of all stations.

Now let’s do the same thing for odd numbered stations. Again, the same pattern.

Finally, let’s look at the same set of graphs for all USHCN stations. Again, exactly the same patterns.

In the past, Gavin Schmidt at NASA has stated that we don’t need very many US stations to make a robust temperature record – and he was correct. The USHCN stations were chosen precisely because they were robust.
Obviously there are deterministic ways we could force changing station composition to impact the trend (like intentionally removing southern states after the year 1970) – but the random changes to USHCN station composition over time have very little impact on the trend. Nick and Zeke are simply using that as a smokescreen for NOAA to hide their data tampering fraud.
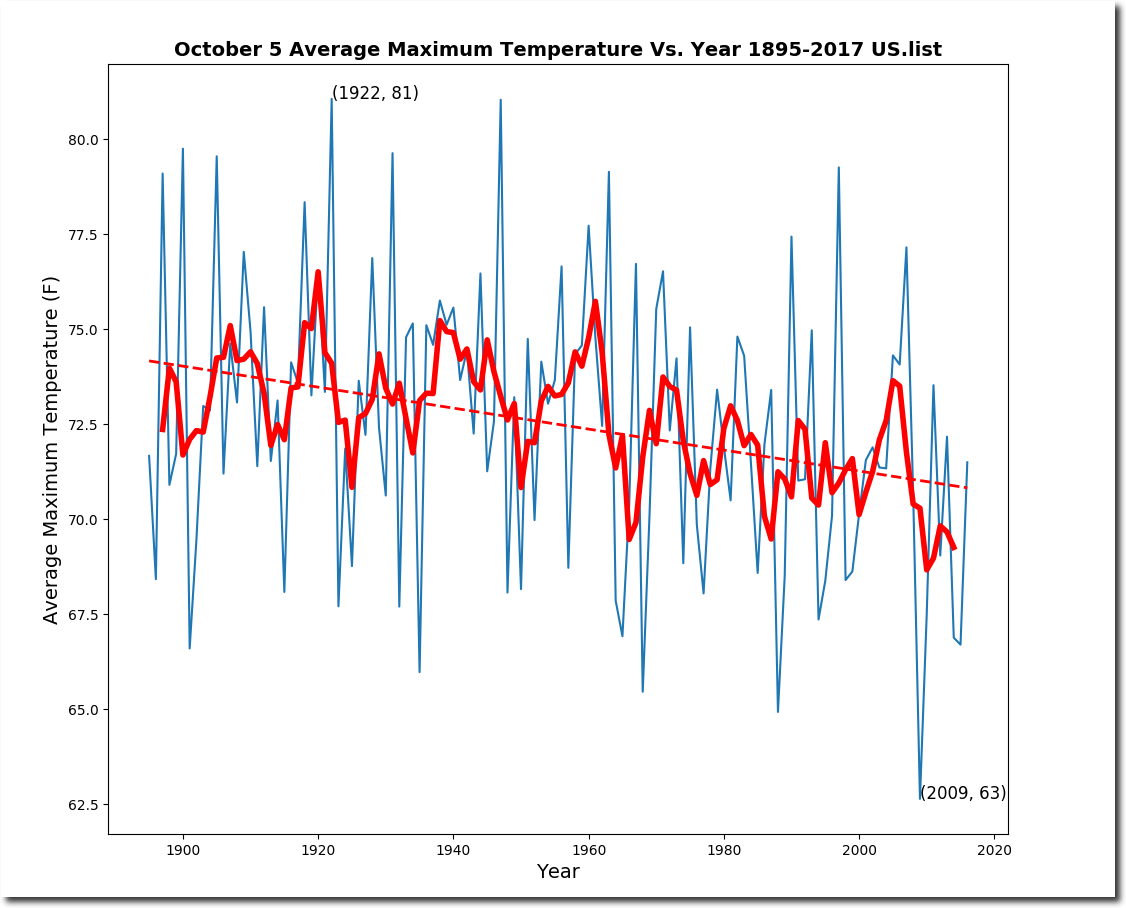
October 5 used to be a warm day in the US, but temperatures have plummeted nearly five degrees since the 19th century.
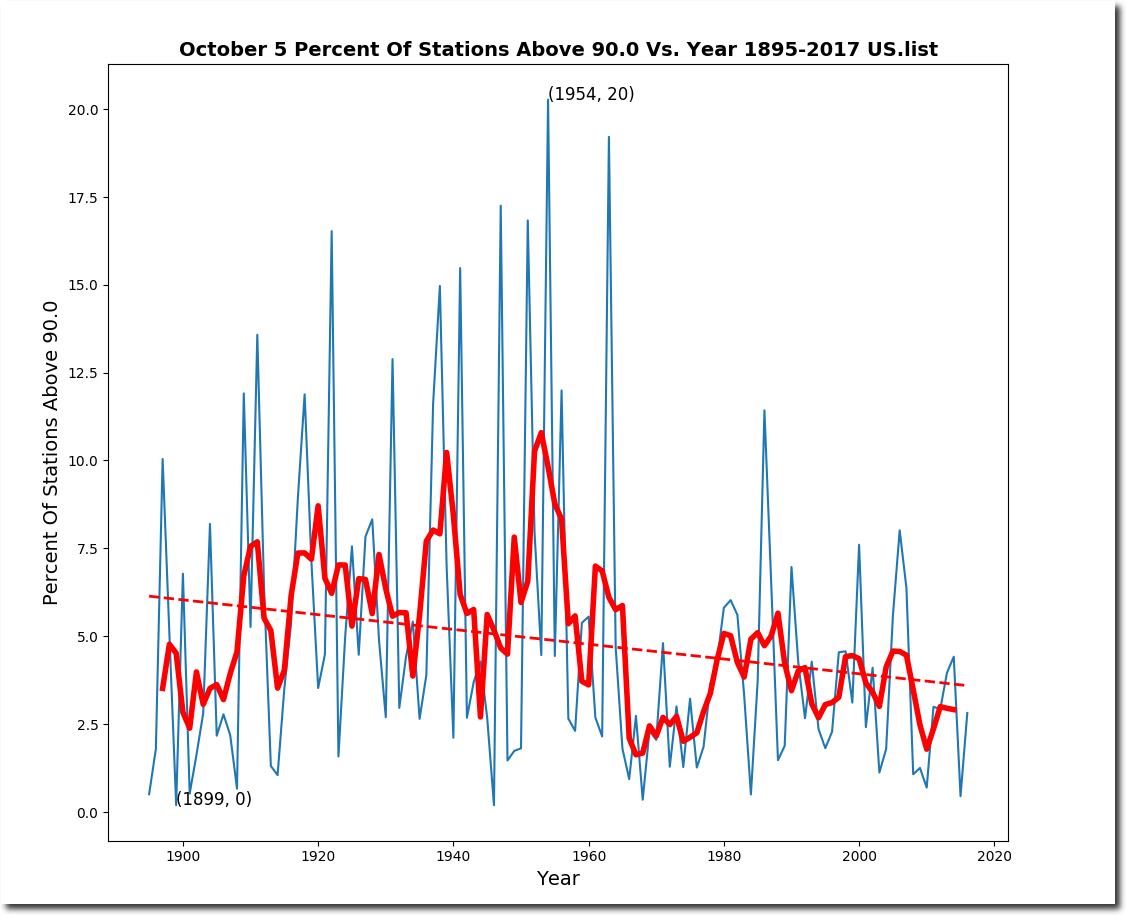
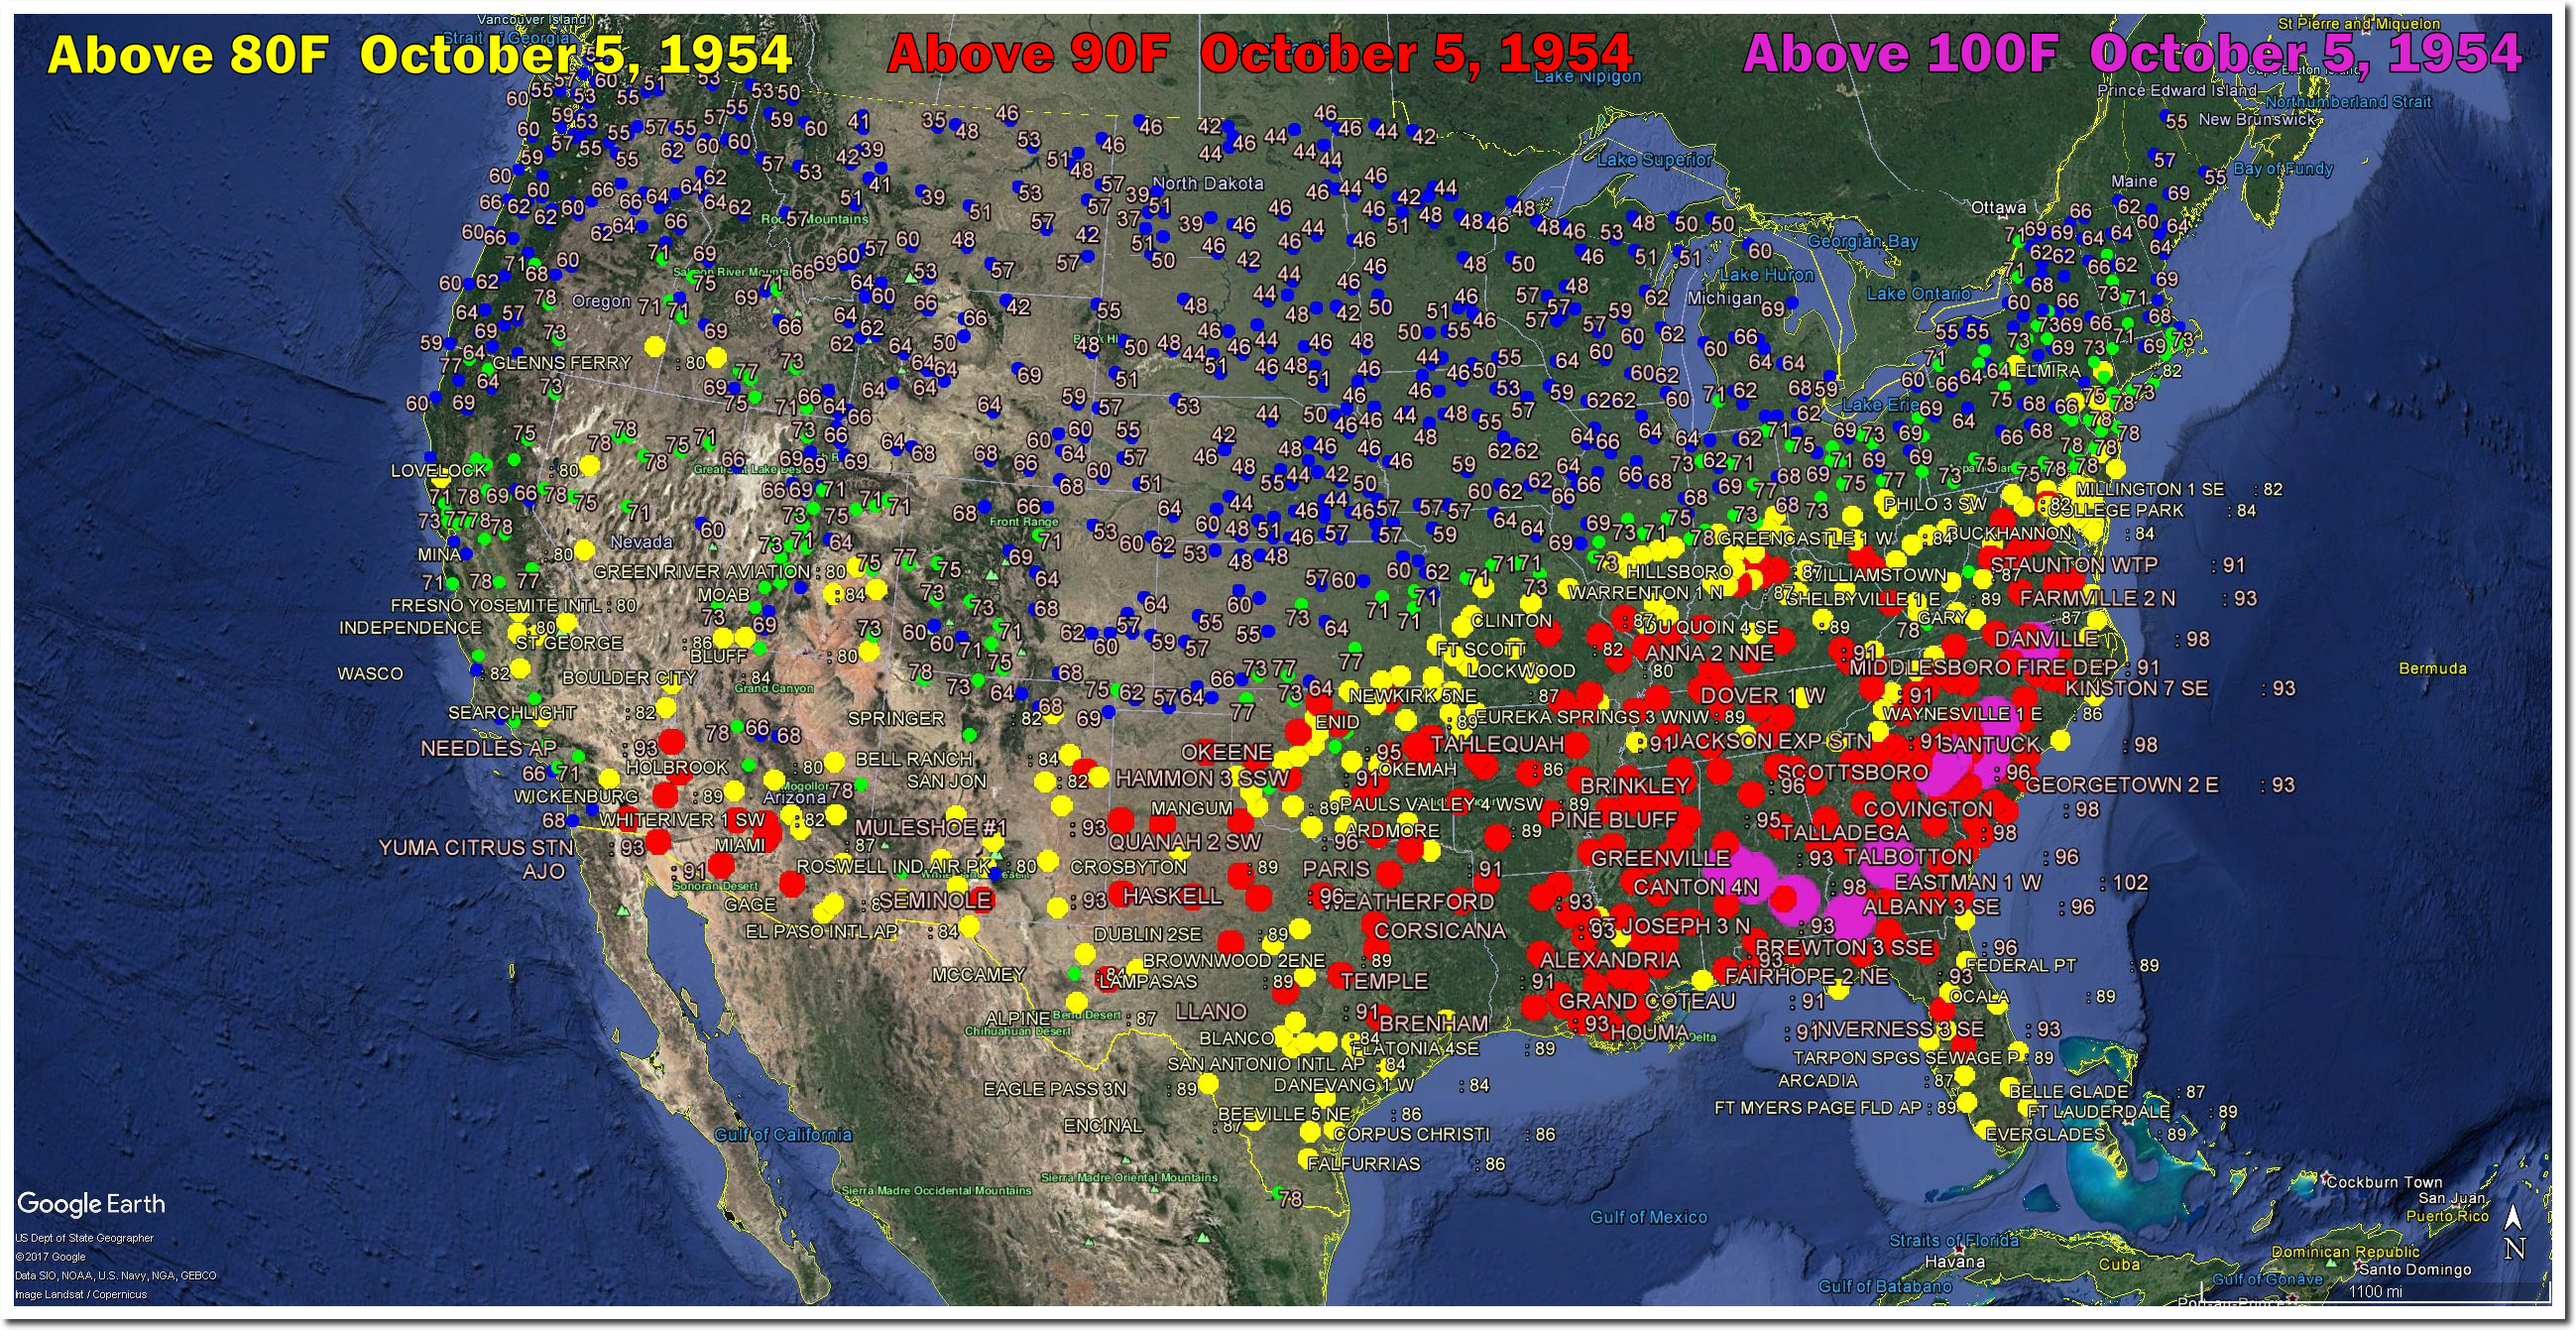
There was a big drop in the area of the US affected by hot weather after 1954.
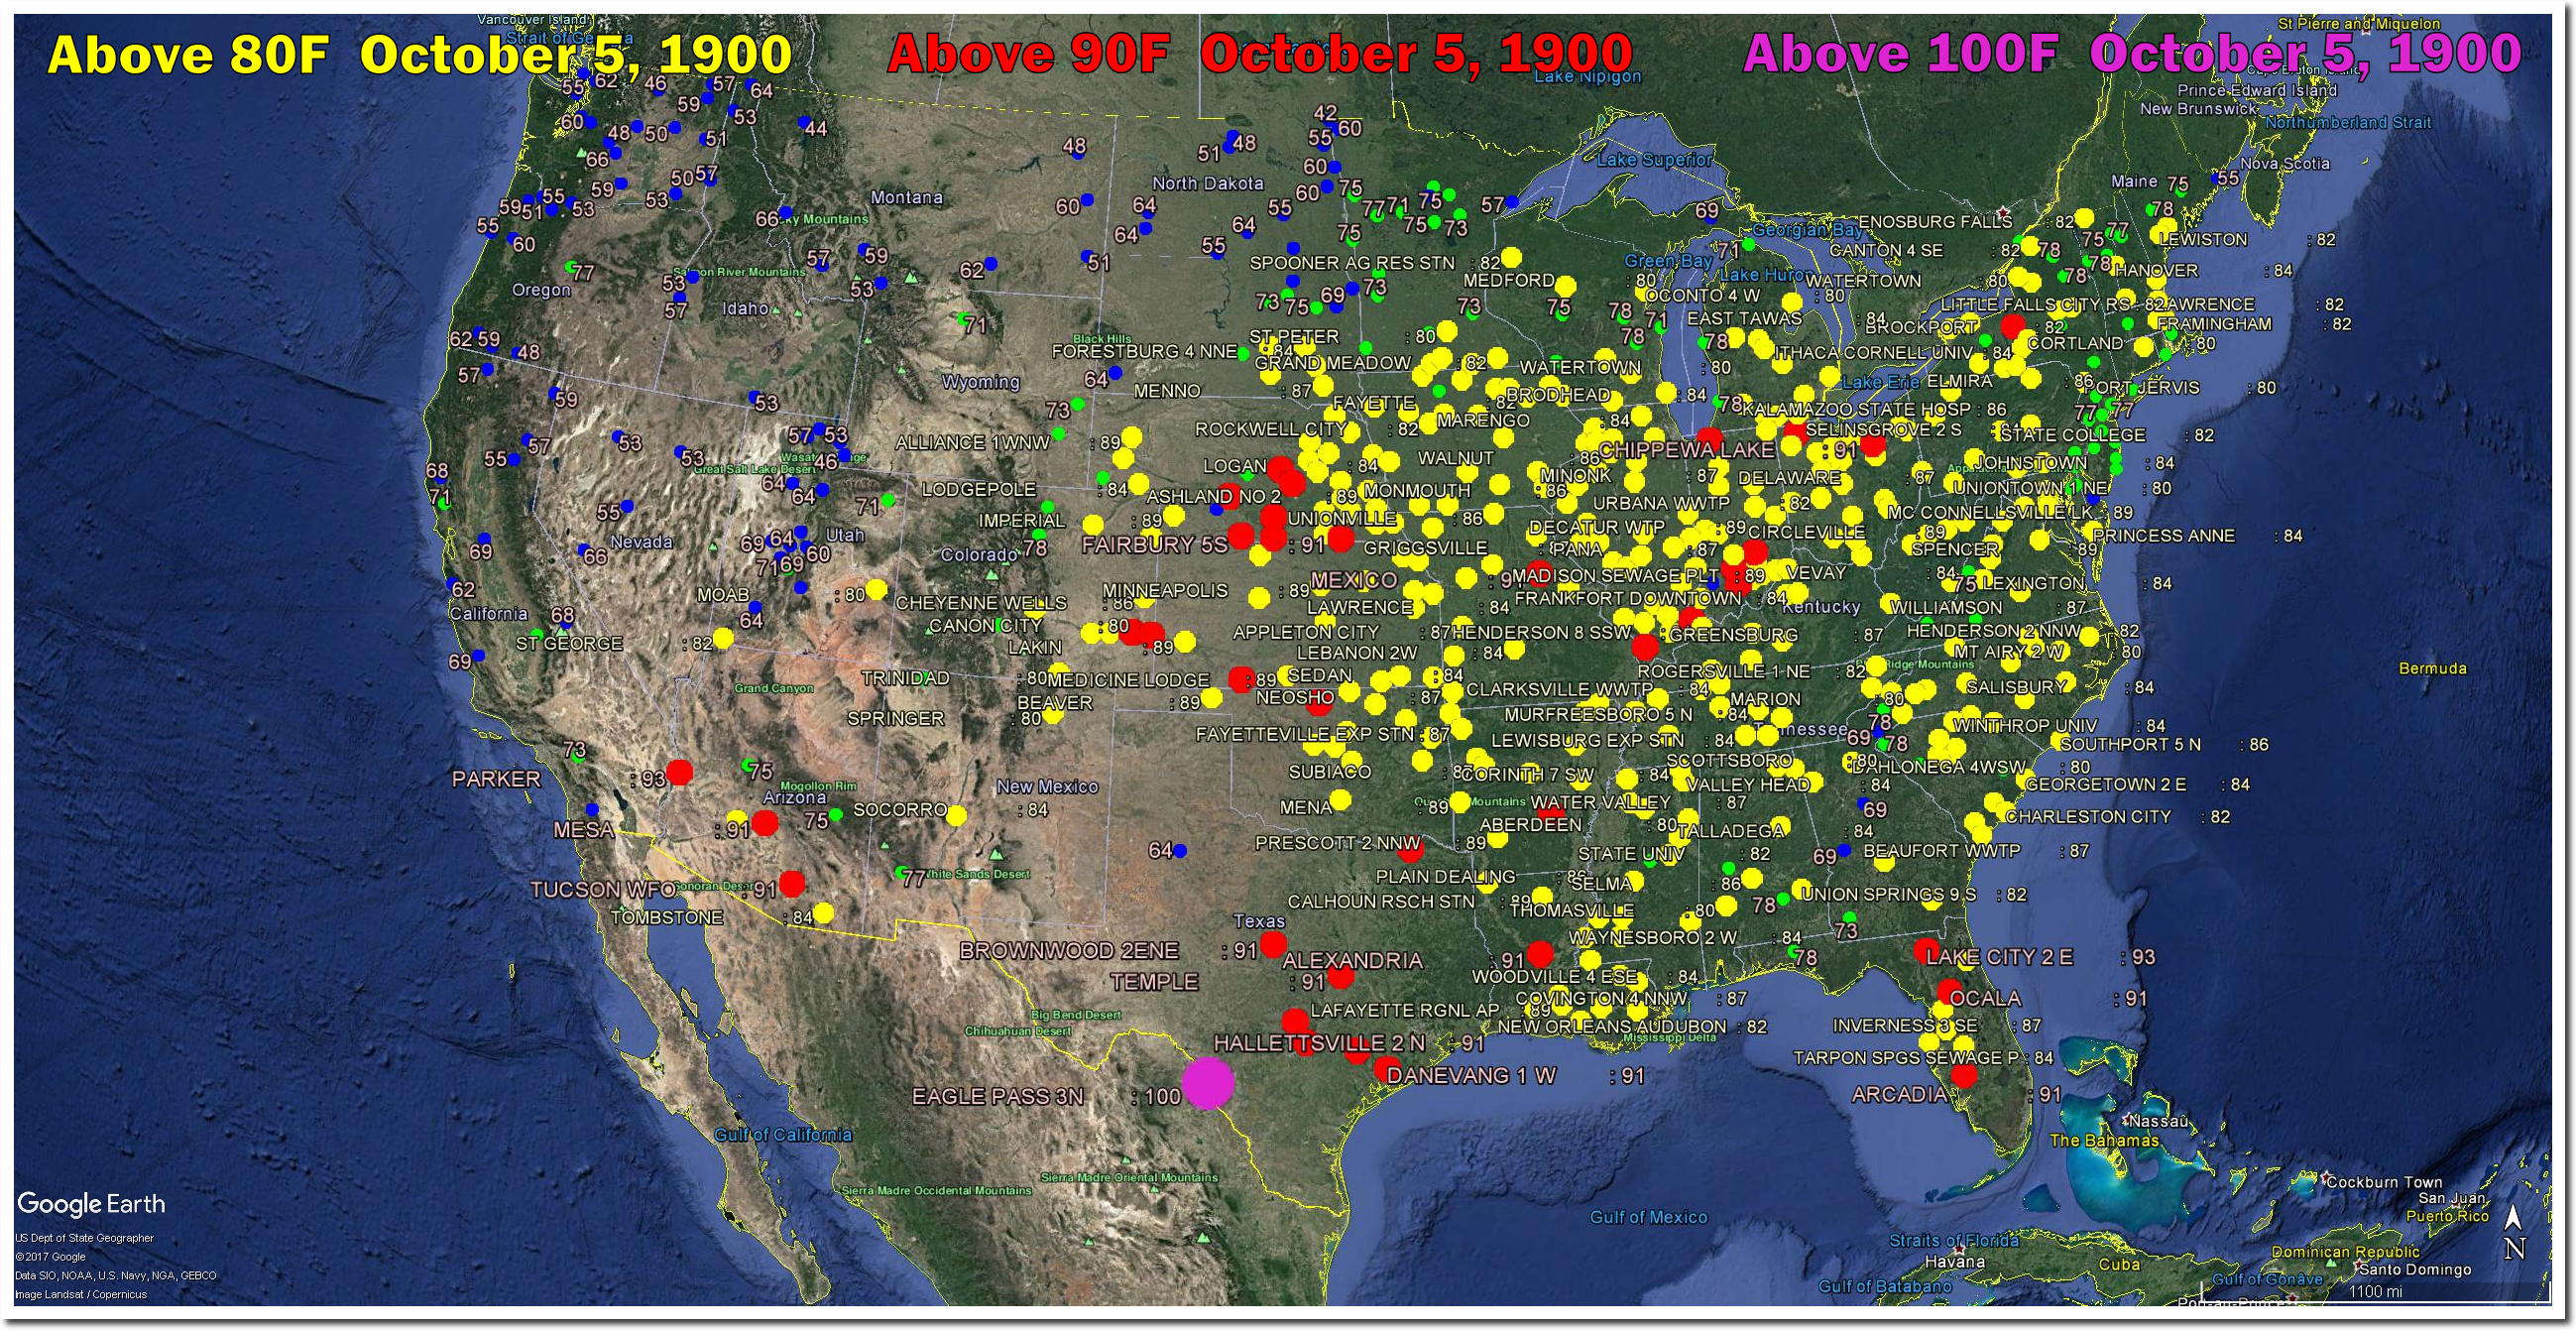
On this date in 1900, upstate New York was over 90 degrees.
On this date in 1922, much of the eastern half of the US was over 90 degrees.
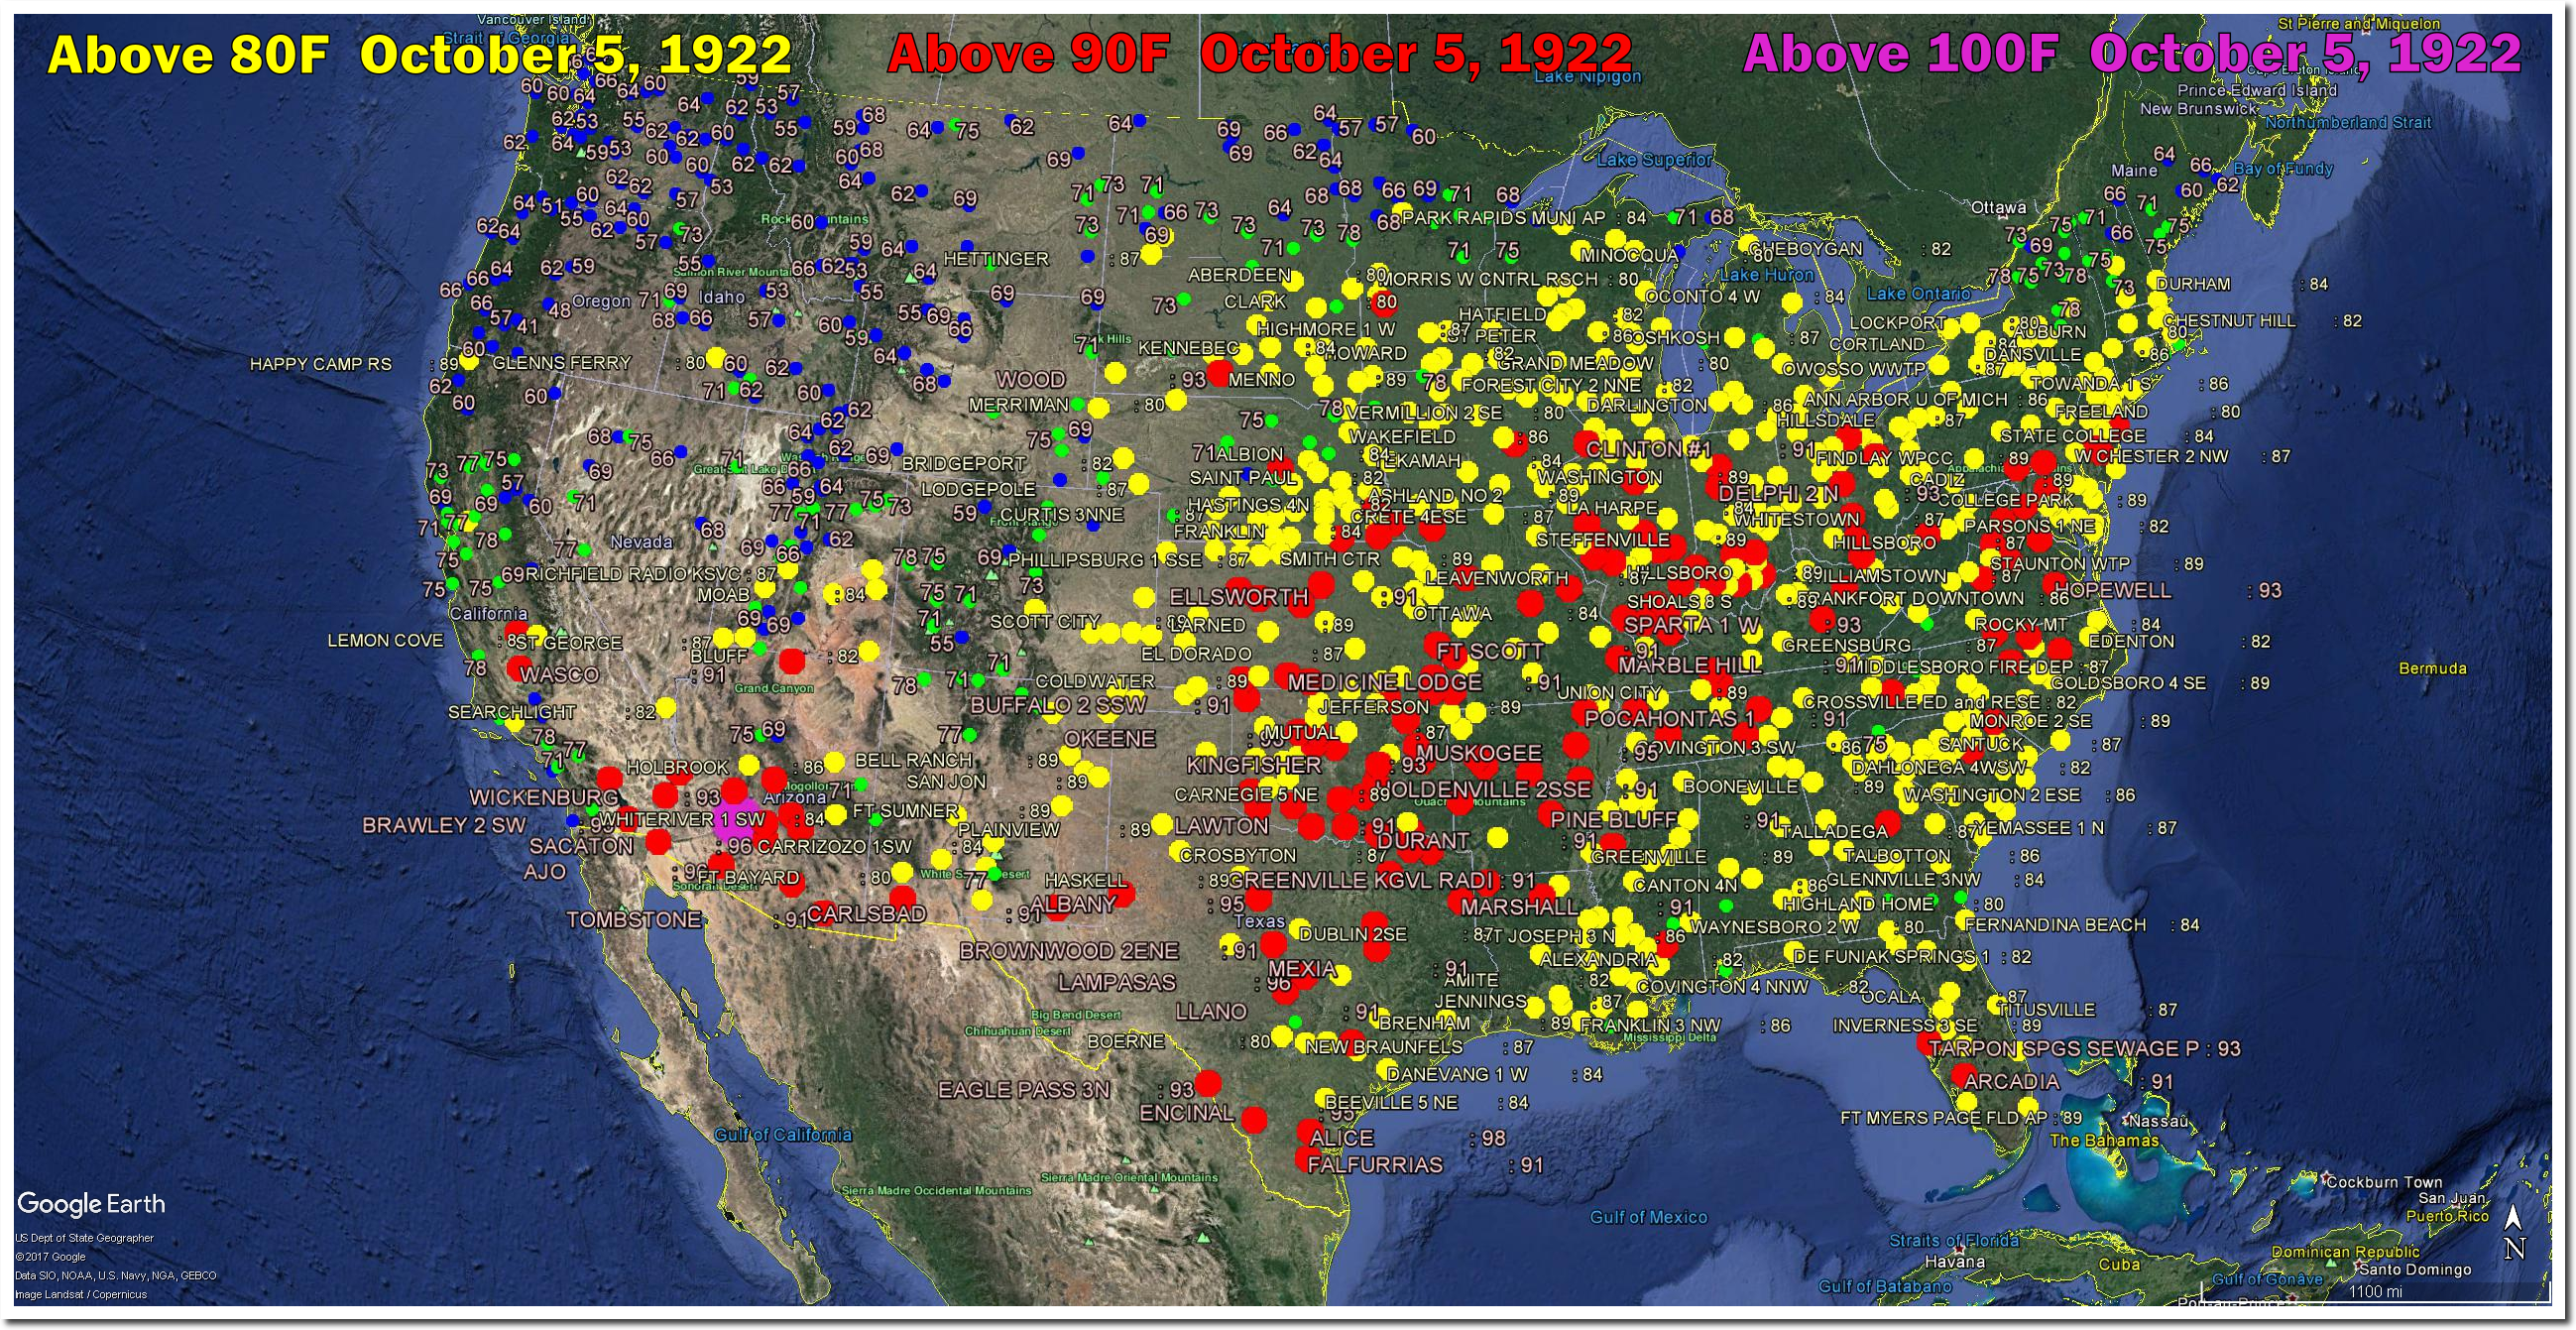
The Arctic was rapidly melting that year.
https://docs.lib.noaa.gov/rescue/mwr/050/mwr-050-11-0589a.pdf
On this date in 1954, much of the southeastern US was over 100 degrees, and Hurricane Hazel was forming out in the Atlantic.
The US is getting cooler, and has been for a long time. It is time for NOAA and NASA to stop tampering with data.
Nick is no longer trying to defend USHCN, and is now spreading mindless FUD about it. Perhaps he realizes that my assertions about USHCN adjustments are correct.
USHCN has not been discontinued, the data is updated every single day. Adjusted USHCN is essentially identical to what NCDC is reporting now.
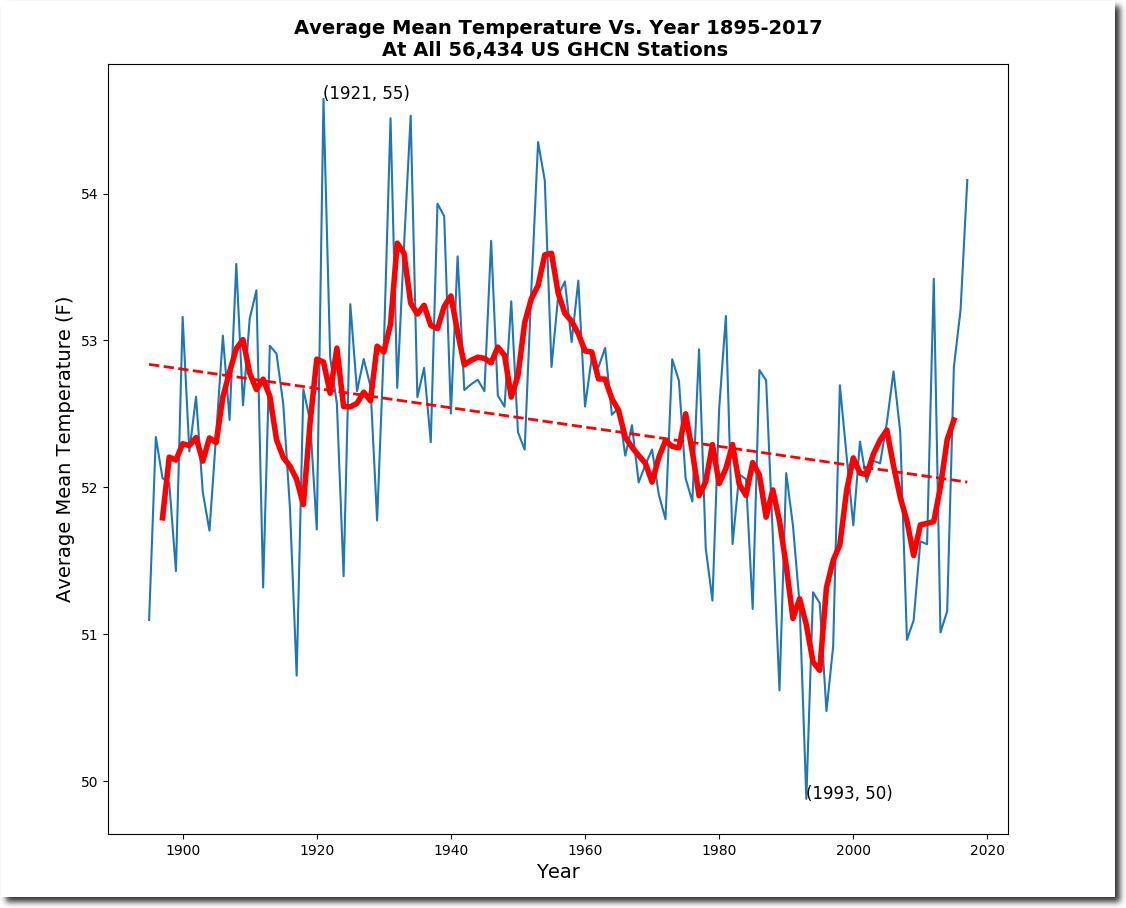
USHCN consists of 1,218 high quality stations. If we look at all 56,434 GHCN stations located in the US, we see a sharp cooling trend.
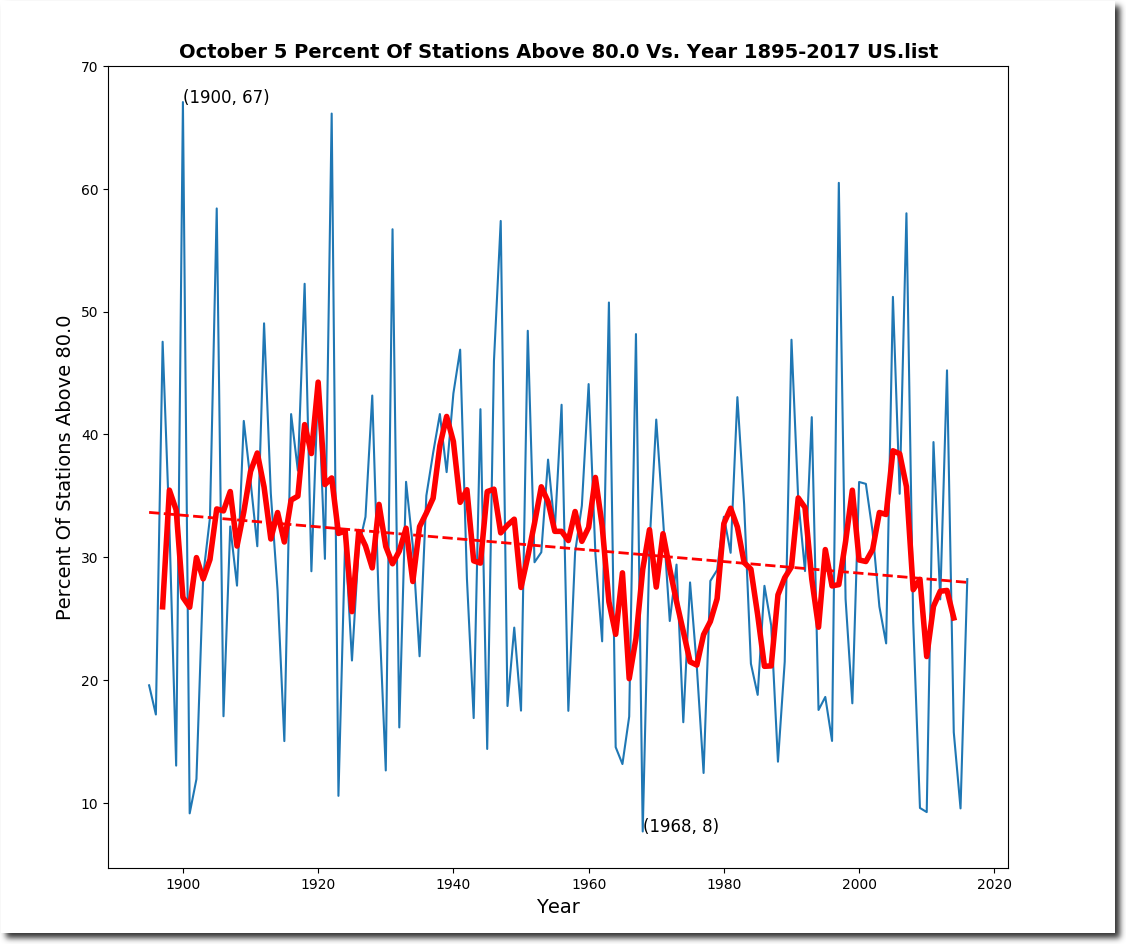
The frequency of hot days has also plummeted.
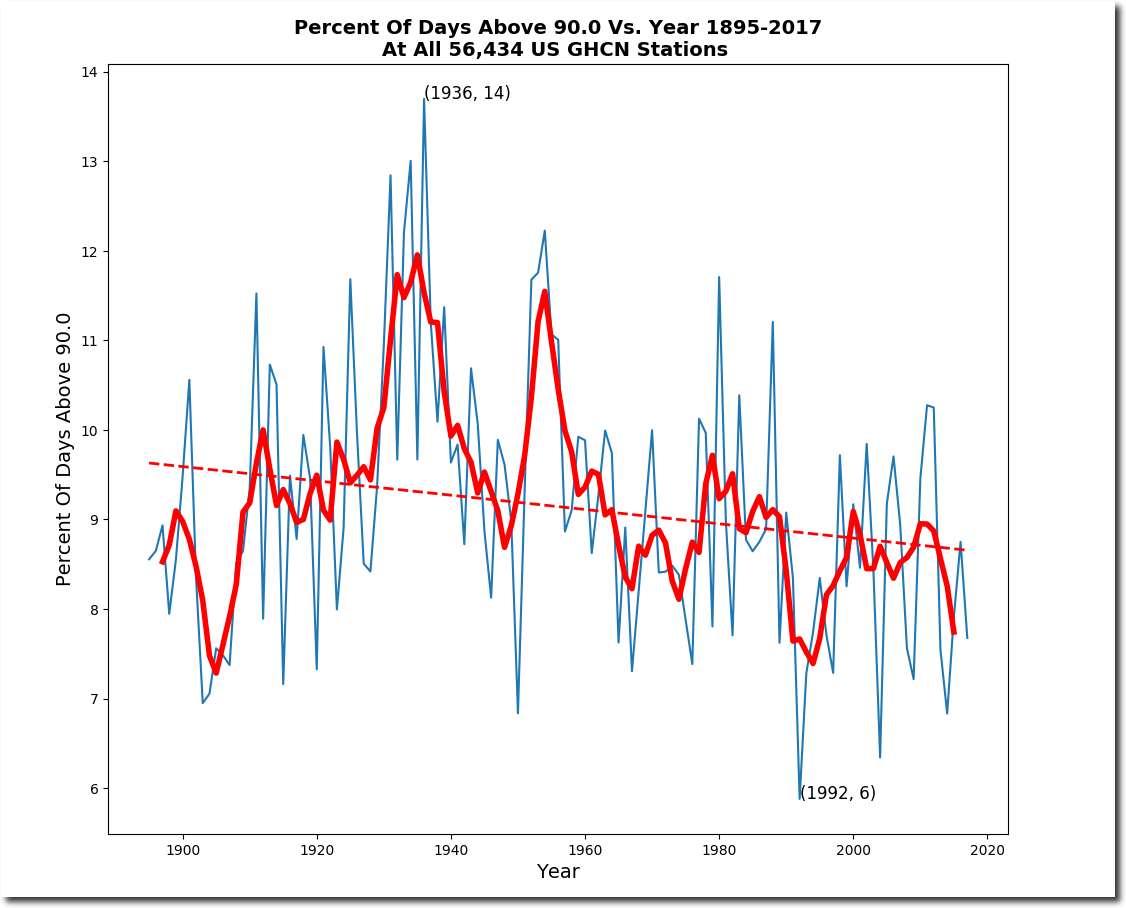
USHCN raw data is by far the best long term weather record on Earth. The bottom line is the US is cooling, and NOAA temperature adjustments are fraudulent.
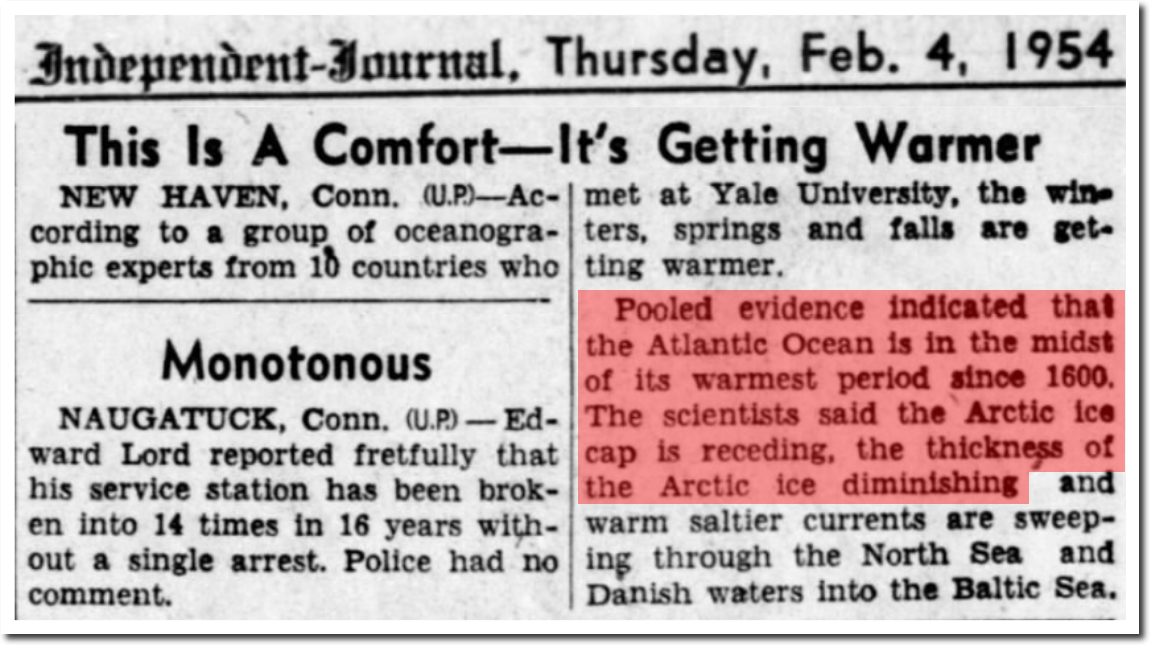
04 Feb 1954, Page 26 – Daily Independent Journal at Newspapers.com
1954 was the low point, and ice extent increased from 1954 to 1979. Climate scientists pretend they don’t have any data before 1979, because it destroys their multi-billion dollar global warming scam.
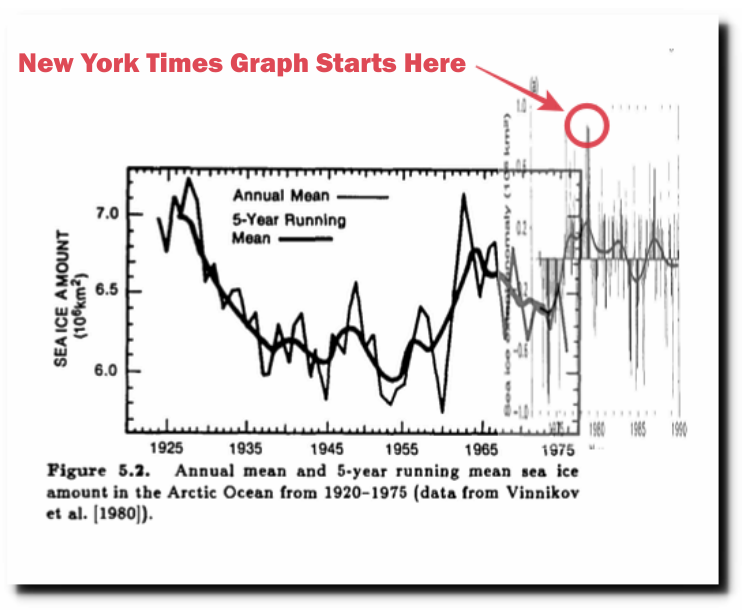
More Spectacular Arctic Fraud At The New York Times | The Deplorable Climate Science Blog