Progressives Believe Arithmetic Was Invented in 1960

“Modern record keeping began in 1960.”

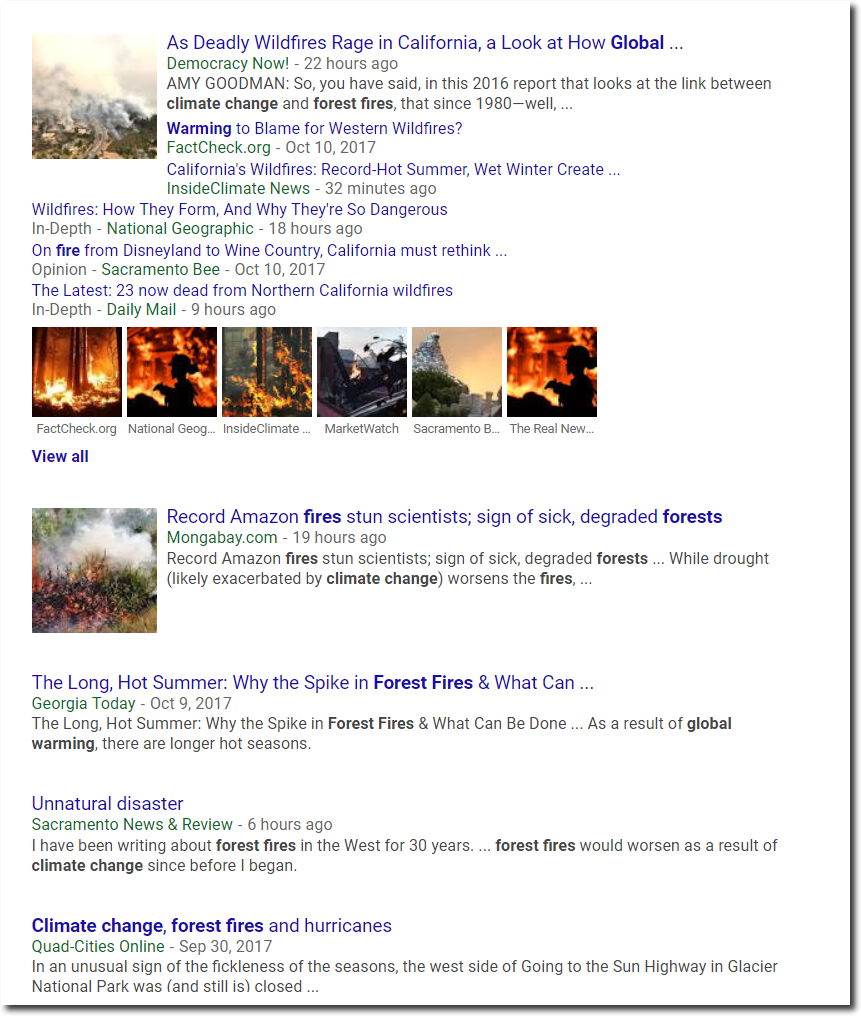
Forest fires are down 80%, but climate fraudsters want to push their scam, so they announce that humans didn’t know how to count before 1960.

2015 wildfires burned a record-breaking 10.1 million acres

The people who designed and built the atom bomb in 18 months during 1944-1945, were actually quite good at counting.

October 9, 1938 – NYTimes

There seems to be no limit to how much fraud climate alarmists are willing to push, or how dishonest they have to be to push their scam.

Posted in Uncategorized | Leave a comment

The Devastation Of Forest Fire

These incredible Aspen groves outside Santa Fe, are the result of forest fires in 1890.

Spokane Falls Daily Chronicle – Google News Archive Search

Climate experts say that forest fires are bad, and they are your fault. In fact, forest fires are essential to the ecosystem, and occur much less frequently than they did when CO2 was lower.

Indicator 3.16: Area and percent of forest affected by abiotic agents

Forest fires are down 90% since CO2 was at pre-industrial levels.

Fire Policy – Cover & TOC

Meanwhile, the usual batch of criminals in the press and scientific community say that forest fires are due to increased CO2..

Posted in Uncategorized | Leave a comment

Imagine If This Happened Now

The US used to be extremely hot. These sort of historical temperatures don’t happen any more.

http://lwf.ncdc.noaa.gov/img/climate/severeweather/a-thigh.gif

Twenty-five states set their all-time record maximum temperature during the 1930’s. The vast majority set their all-time record with CO2 below 350 PPM.

http://lwf.ncdc.noaa.gov:80/oa/pub/data/special/maxtemps.pdf

Wisconsin was 114 degrees in 1936. They haven’t reached 110 degrees since then.

The frequency of hot days has plummeted in Wisconsin over the past century.

The frequency of hot days has plummeted across the US during the past century.

If we had temperatures anywhere close to the 1930’s heat now, climate scientists would declare 100% certainty that it was due to atmospheric CO2. This would be based on nothing other than the usual fraud and lies – which are standard operating procedure among government funded climate scientists.

Posted in Uncategorized | Leave a comment

Featured Fake Climate Study Of The Day

“Researchers have struggled”

How global warming is drying up the North American monsoon

Latest idiocy from the team climate fraud, claims global warming is drying up the summer monsoons in the southwest.

I was born in the southwest and spent the majority of my life there. I’m just back from watching the cleanup from the latest flooding in Tesuque, New Mexico.  A ranger in Bandelier National Monument just told me about all the flood cleanup efforts they have had to do the last few years. Boulder had the worst floods in a century in 2013.

There is no indication that summer rains in the Southwest have changed.

Climate at a Glance | National Centers for Environmental Information (NCEI)


As always, climate scientists are simply making up alternative facts to keep their well funded climate scam alive. It is 0% science, 0% data, and 100% BS.

Posted in Uncategorized | Leave a comment

Polar Ice Fraud Update

War is peace. Freedom is slavery. Ignorance is strength.

  • George Orwell  1984

Arctic sea ice extent is normal, and is much higher than five or ten years ago.

Antarctic sea ice extent is normal.

Charctic Interactive Sea Ice Graph | Arctic Sea Ice News and Analysis

Greenland surface ice mass gain is above normal, and has been for two years.

Greenland Ice Sheet Surface Mass Budget: DMI

Meanwhile, climate scientists and the press continue to lie.

And Google continues to promote wildly fraudulent stories about climate. They are the Ministry of Truth which Orwell wrote about.

Posted in Uncategorized | Leave a comment

NASA : Doubling Warming By Data Tampering

Between 2001 and 2015, NASA doubled 1880-2000 warming, via good old-fashioned data tampering.

2001 version : Fig.A.ps   2015 version: Fig.A.gif 

The next graph normalizes the two NASA graphs to the most recent common decade. It shows the magnitude of the tampering.

Alternatively, we can normalize the graphs to the earliest decade, the 1880’s. This shows very clearly how total warming from 1880 to 2000 has doubled since 2001.

NASA, NOAA, Zeke, Mosher and Nick can generate any shape graph they want – because they don’t actually have any verifiable historical data for most of the Earth,.

Bottom line is that NASA/NOAA/CRU/Berkeley Earth global temperature graphs are meaningless garbage, put out by fake scientists.

Posted in Uncategorized | Leave a comment

More Pictures From Yesterday And Today

Posted in Uncategorized | Leave a comment

Flying With The Hawk

Best watched full screen in HD

This was the flexed branch he/she was sitting on.

Posted in Uncategorized | Leave a comment

Understanding Climate Change

The US was hit by dozens of major hurricanes from 1899 to 1996. Those were just weather, but two major hurricanes in the last 12 years is climate.

http://lwf.ncdc.noaa.gov:80/img/climate/severeweather/2hur9996.gif

Note that New England was hit by two major hurricanes in both 1944 and 1954, and none since then.

Posted in Uncategorized | Leave a comment

Declining October 11 Temperatures In The US

Prior to 1965, October 11 used to be a warm day in the US, but over the past century October 11 afternoon temperatures have fallen several degrees.

On this date in 1928, temperatures were in the 90’s as far north as Lake Erie.

Posted in Uncategorized | Leave a comment