
Hollywood people should probably stick with whatever they are good at. Drugs, fornication, etc.
Hollywood people should probably stick with whatever they are good at. Drugs, fornication, etc.
With OJ Simpson getting out of jail, he can join his NFL teammates protesting unfair incarceration of black people – by trashing the flag and national anthem. Nicole Simpson and Ron Goldman will not be in attendance however.

In this post I take down the second part of Nick Stokes idiotic claim :
Steven Goddard produces these plots, and they seem to circulate endlessly, with no attempt at fact-checking, or even sourcing. I try, but it’s wearing.
My source code has been out there for years. Nick has no excuse for his ignorance.
I just added it to UNHIDING THE DECLINE, to make it really easy for even the most clueless climate alarmist. (It is very wearing for me to have to deal with these clowns, who spread the same misinformation year after year.)
Download UNHIDING from here. Click on the DOWNLOAD ALL button.
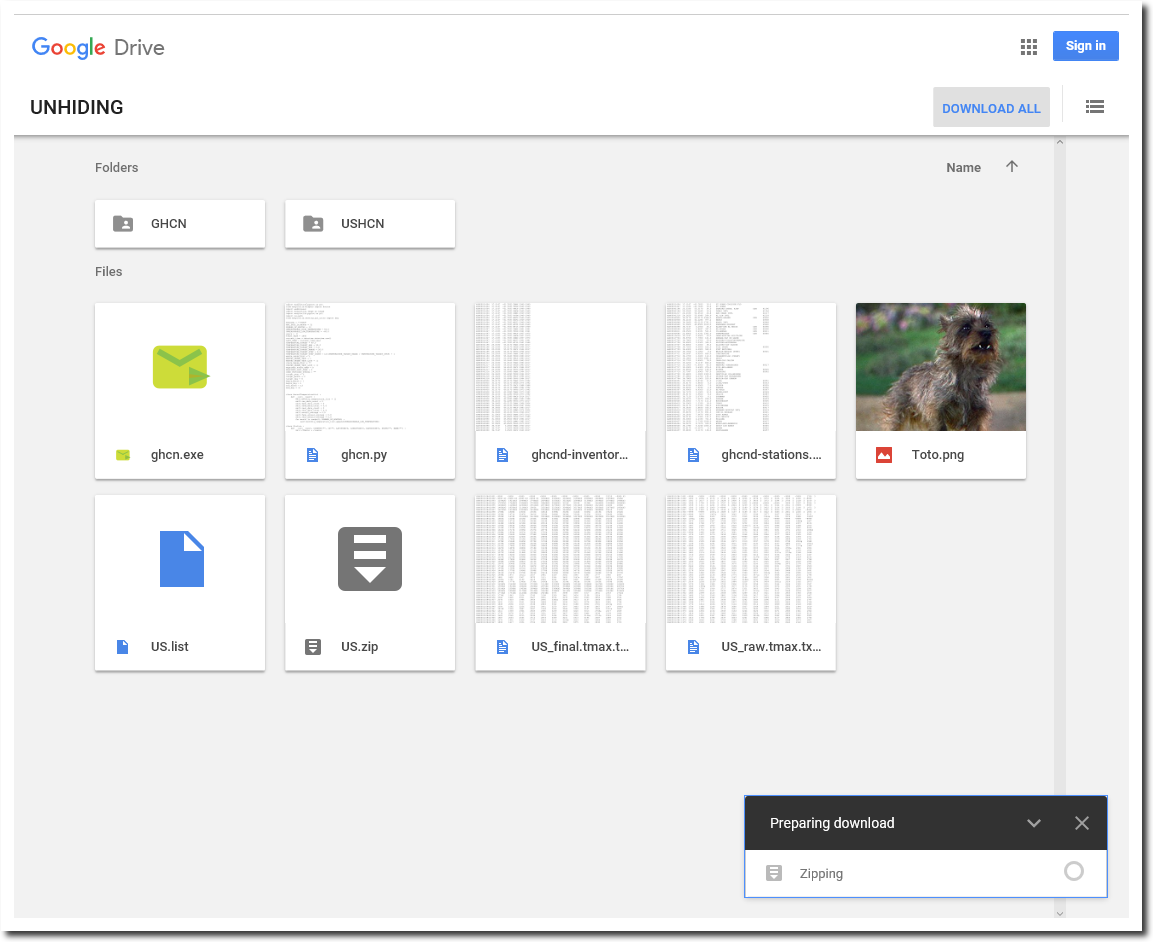
It will be downloaded as a very large zip file. The reason it is so large is because I have included the entire US daily temperature database. I did this is because Windows users might have a difficult time extracting the data from NOAA. I also have included everything you need to get the data directly from NOAA.
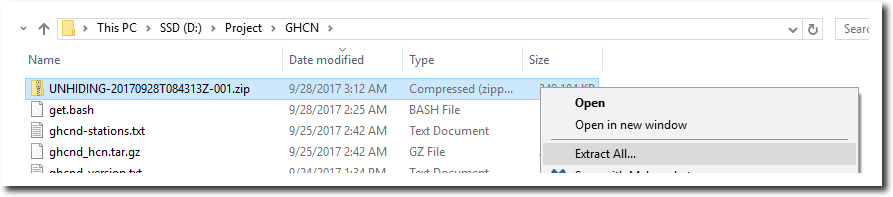
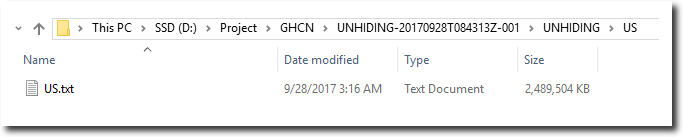
Unzip the file, and enter the UNHIDING directory. Unzip the US.zip file.
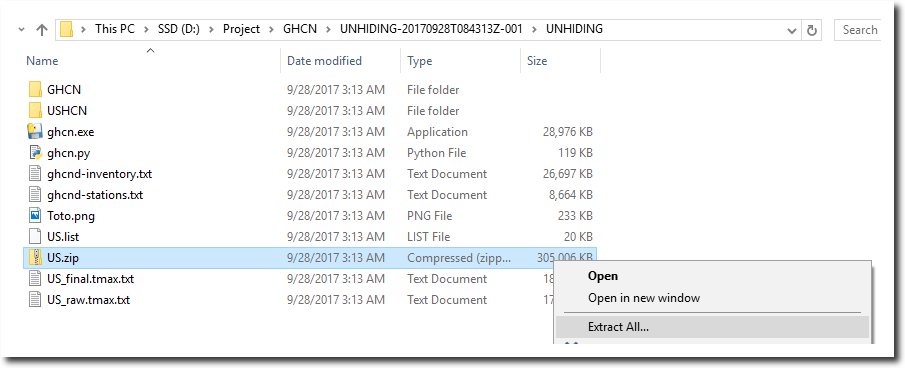
Then move the extracted US.txt file into the UNHIDING directory.
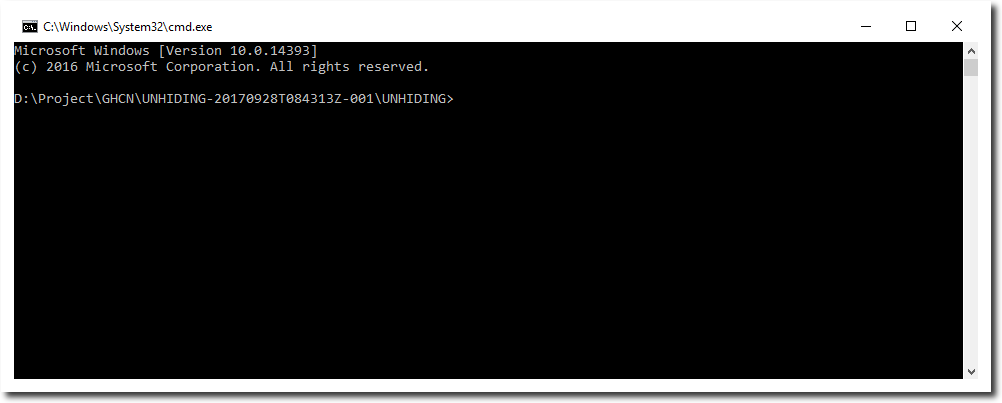
Enter the UNHIDING directory using a windows command prompt window or Linux/Mac terminal. Windows users can do this by navigating to the UNHIDING directory in Windows Explorer and typing cmd in the address bar.


That will bring up a command prompt window.
First time Linux/Mac users will need to run these commands. Windows users will not need to run them.
python3 -m pip install matplotlib
python3 -m pip uninstall numpy
python3 -m pip install numpy==1.12.1
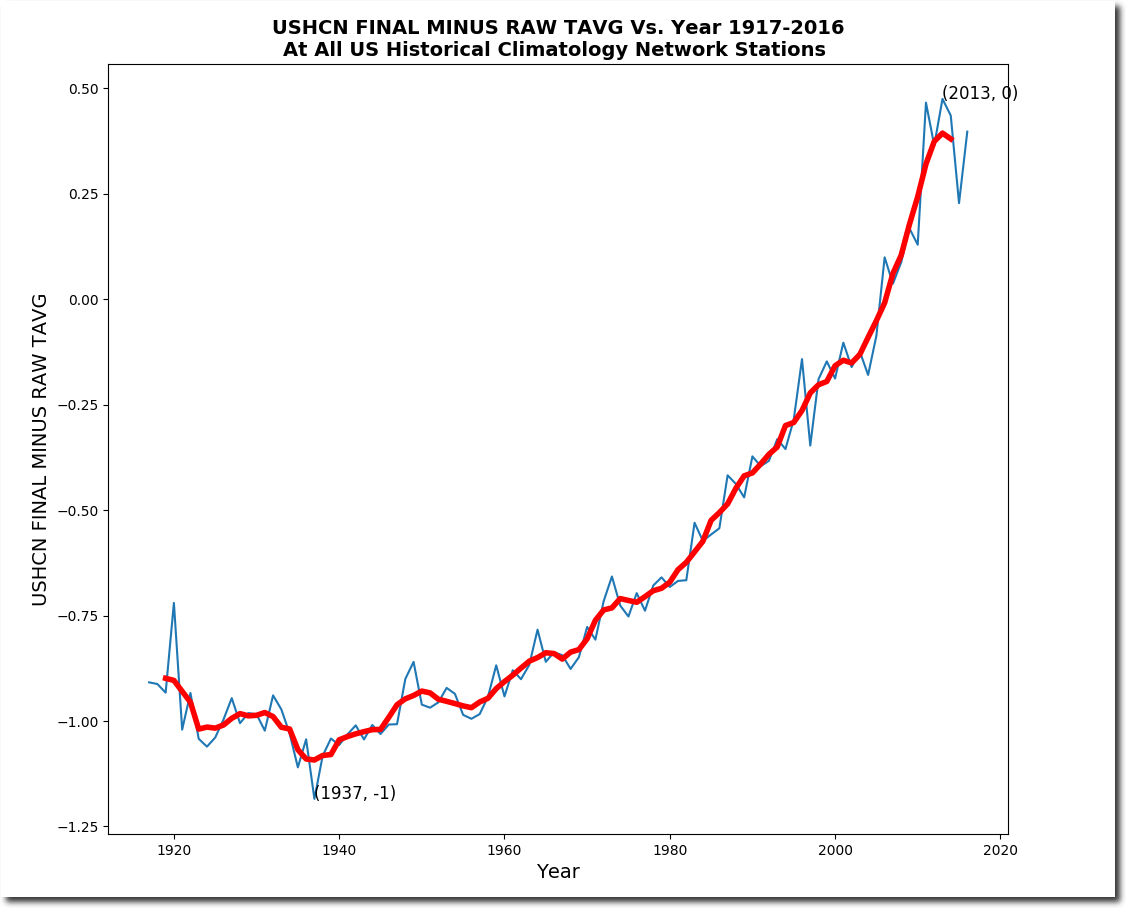
The plot was generated using the command :
python3 ghcn.py US.txt first_year=1917 last_year=2016 USHCN
or for Windows users :
.\ghcn.exe US.txt first_year=1917 last_year=2016 USHCN
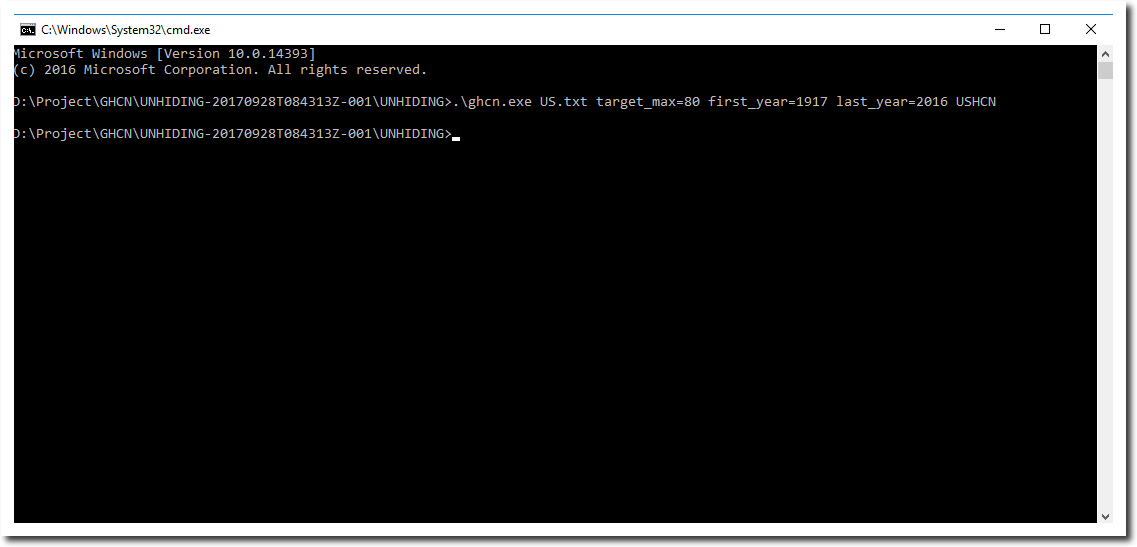
It takes a long time to run, and will appear like nothing is happening. Be patient. Your computer is processing several versions of the entire US daily and month temperature data sets.
Eventually a window will pop up like this. Select “CO2 “in the left column, and “USHCN FINAL MINUS RAW TAVG” in the right column. This will show how NOAA is tampering with the temperature data to precisely match their fake global warming theory.
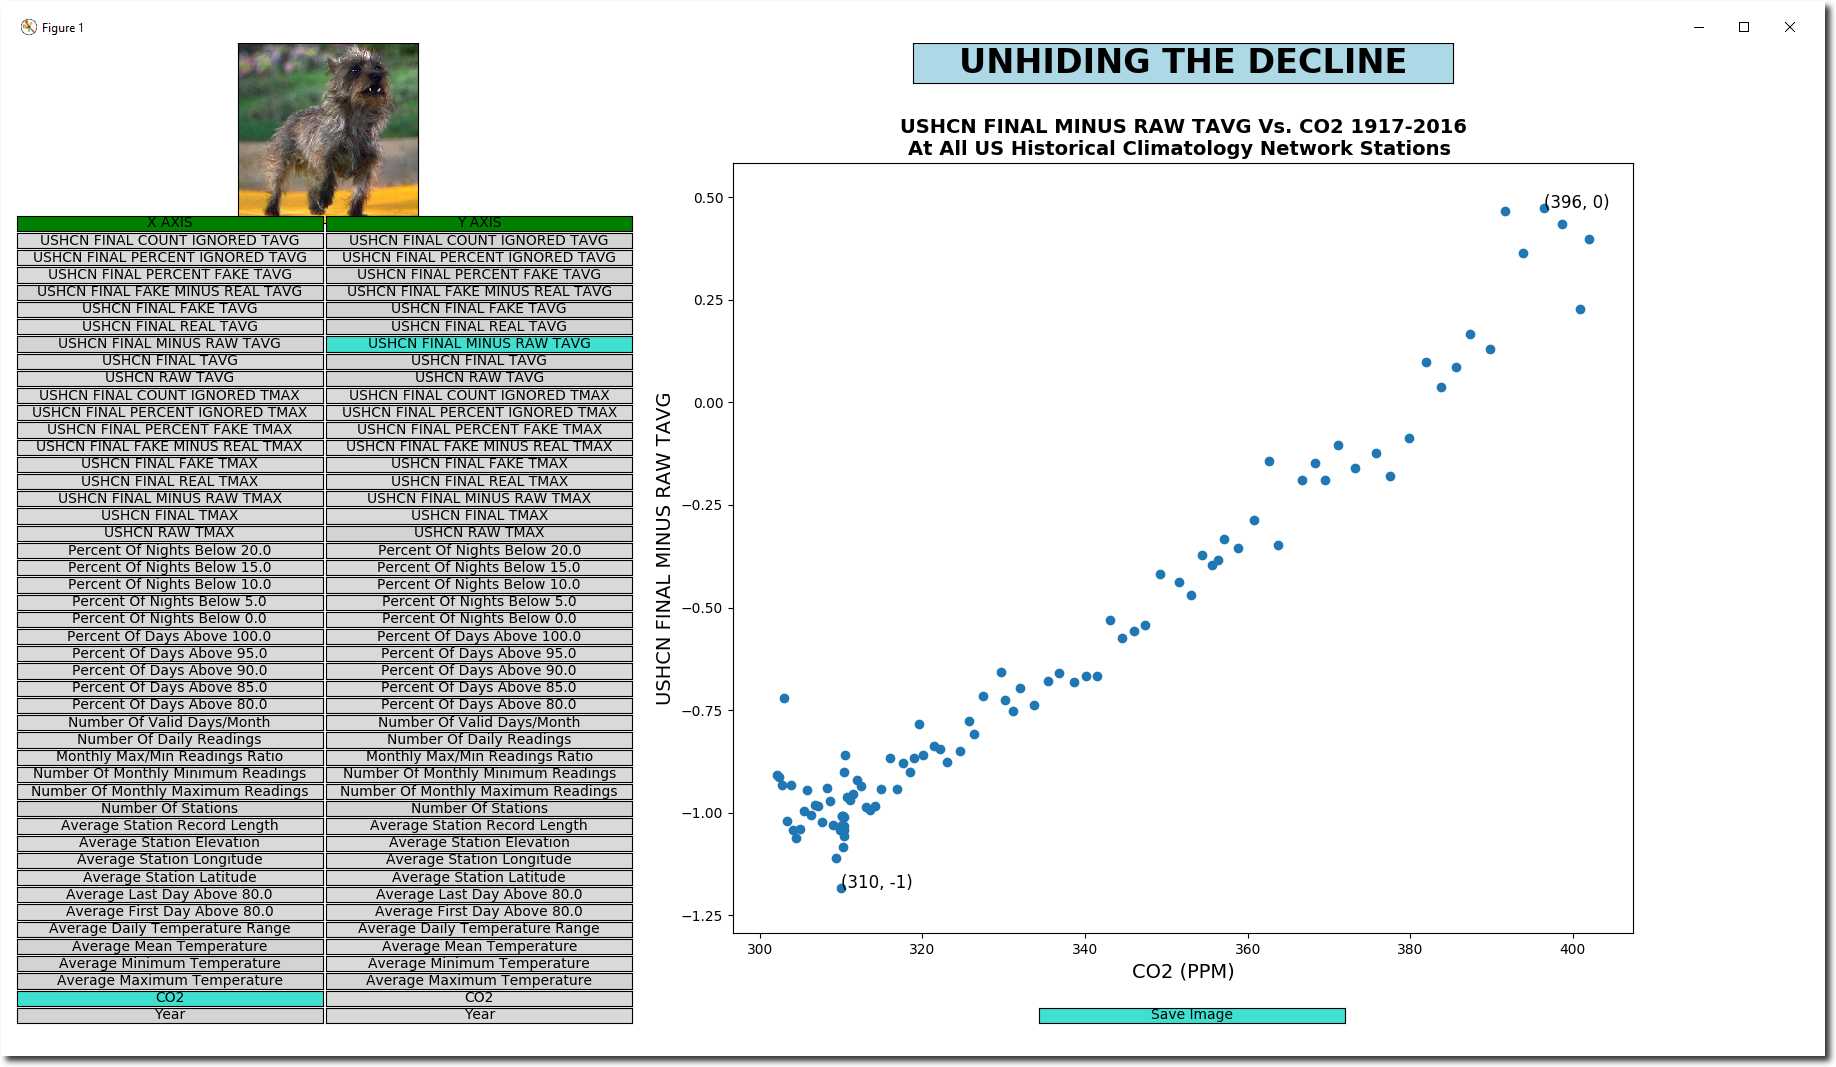
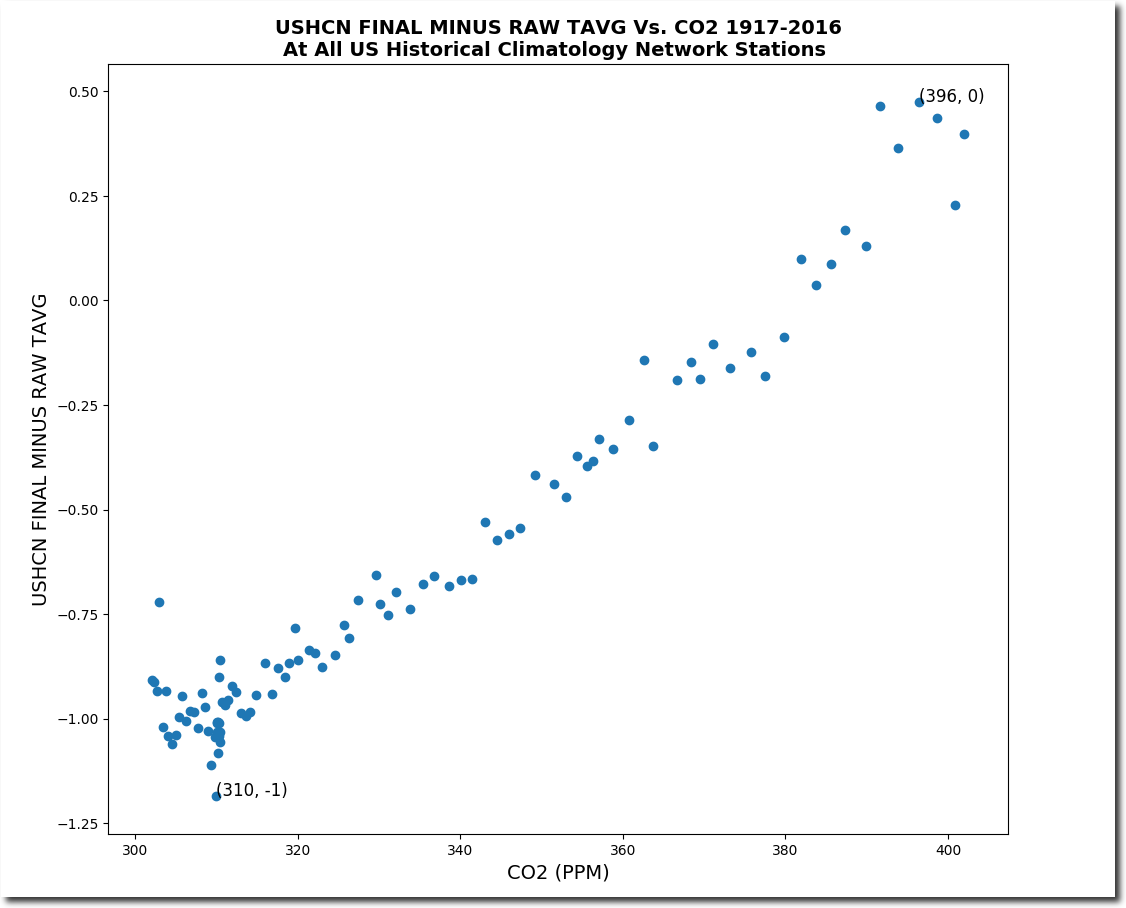
The source code is ghcn.py. Nick can see exactly how the calculations are done. They are a simple numerical average of the USHCN monthly final minus the numerical average of the monthly raw temperatures, per year. Math doesn’t get any simpler than that. A third grader should be able to understand.
Linux/Mac users can get the NOAA daily temperature data by entering the GHCN directory and typing ./get.bash
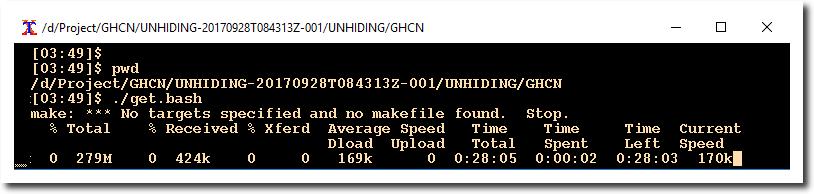
Them move GHCN/ghcnd_hcn/US.txt into the UNHIDING directory.
Linux/Mac users can get the the NOAA monthly temperature data by entering the USHCN directory and typing ./get.bash
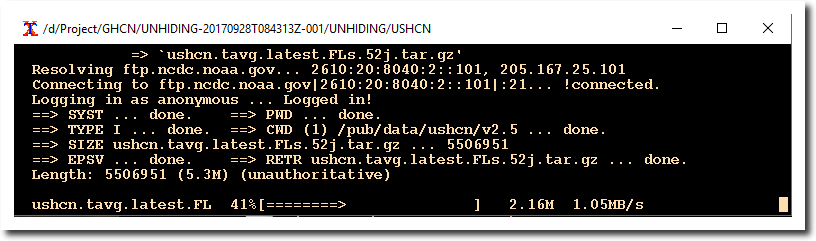
Then move US_final.tmax.txt US_raw.tmax.txt US_final.tavg.txt and US_raw.tavg.txt from the USHCN/ushcn.v2.5.5.[$DATE] directory into the UNHIDING directory.
Nick has no excuses for his ignorance or his ongoing attempts to misinform the public. Next time he or Mosher claim my work is not reproducible, tell them that they would need at least third grade math skills to accomplish that.
NOAA is precisely tampering with temperature data to match CO2 theory. Quite likely the most crooked, dishonest, corrupt science ever done.
In my next post I will take down Nick’s third idiotic claim :
The first GISS plot is not the usual land/ocean data; it’s a little used Met Stations only
As a kid, I used to dream of being able to do this.
Left wing hacks pretending to do science.

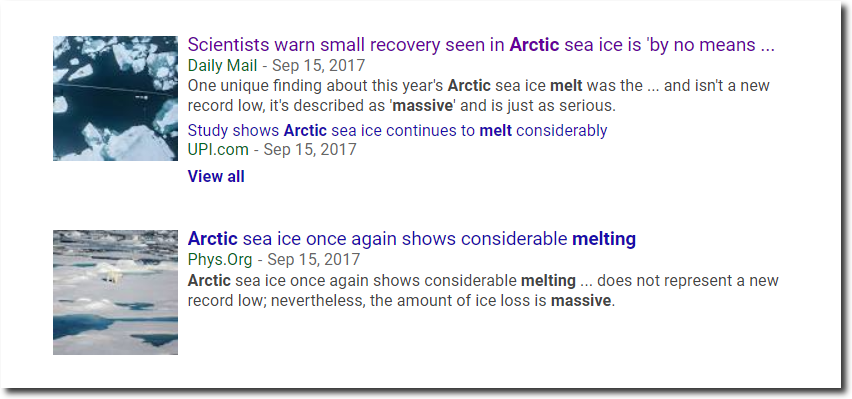
The amount of Arctic summer melt is down nearly 10% over the past decade, with 2017 being the lowest.

masie_4km_allyears_extent_sqkm.csv
Greenland had their fifth largest surface mass gain on record.
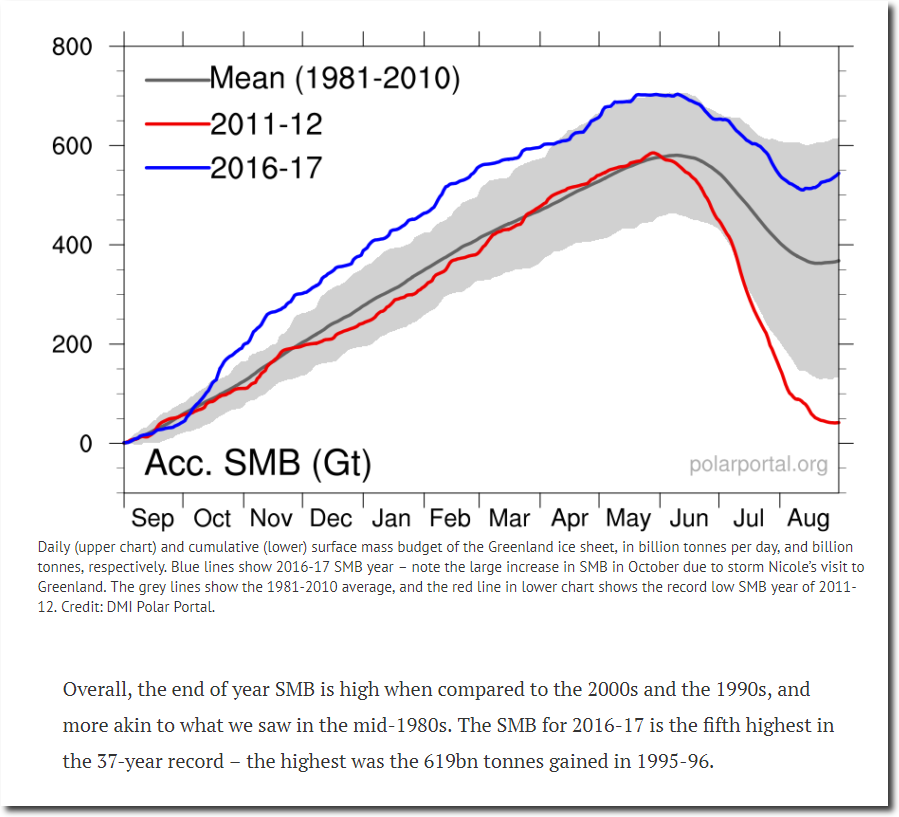
Guest post: How the Greenland ice sheet fared in 2017 | Carbon Brief
Greenland’s largest glaciers have been growing for five years.
Climate experts of course claim the exact opposite. They have funding to protect and their scam is endangered by reality, so they are ramping up their lies and fraud to spectacular new levels.
Satellites show that the troposphere has not warmed since 1997. The warming reported by NASA (red line below) has nothing to do with reality.
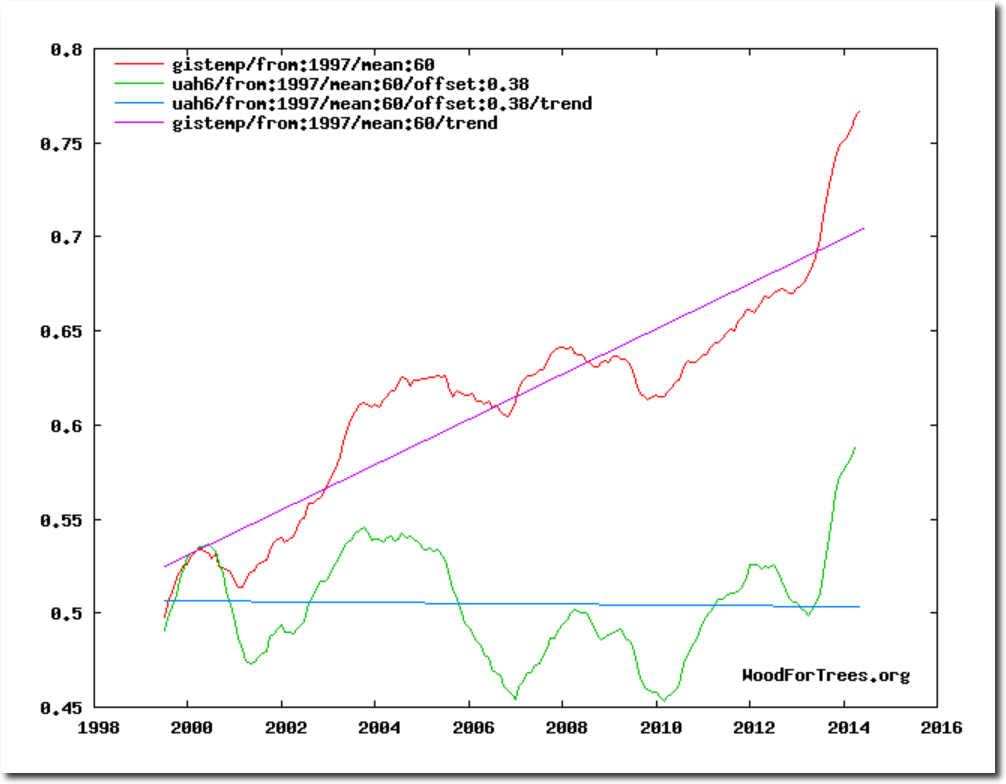
Wood for Trees: Interactive Graphs
The 1995 IPCC report showed no troposphere warming from 1958 to 1995.
The bottom line is that Earth is not warming, and is no warmer now than it was in 1940. Global warming is the biggest mass superstition and hysteria of modern times.
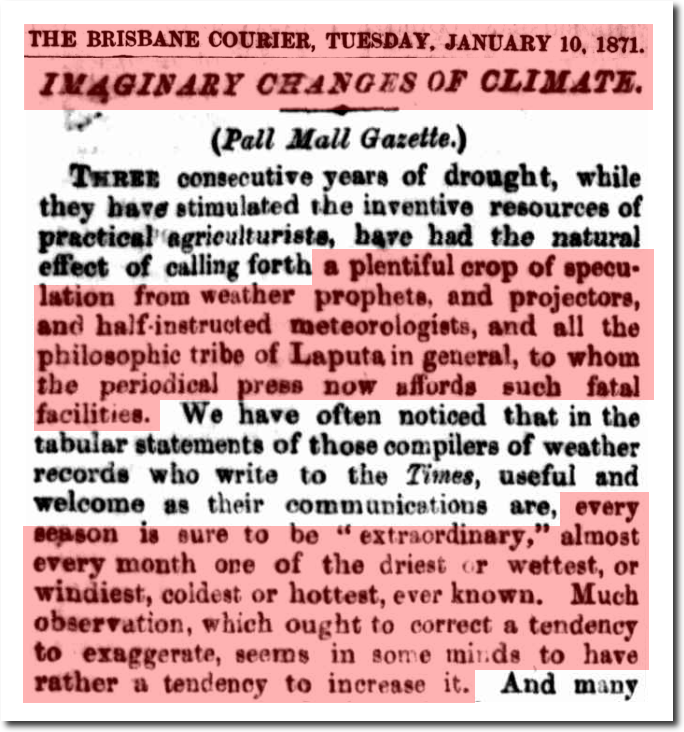
Nothing new about this idiocy though. Imagining climate change seems to be a fundamental human flaw .
Nick Stokes, like all climate alarmists, spews mindless gibberish without doing any fact checking.
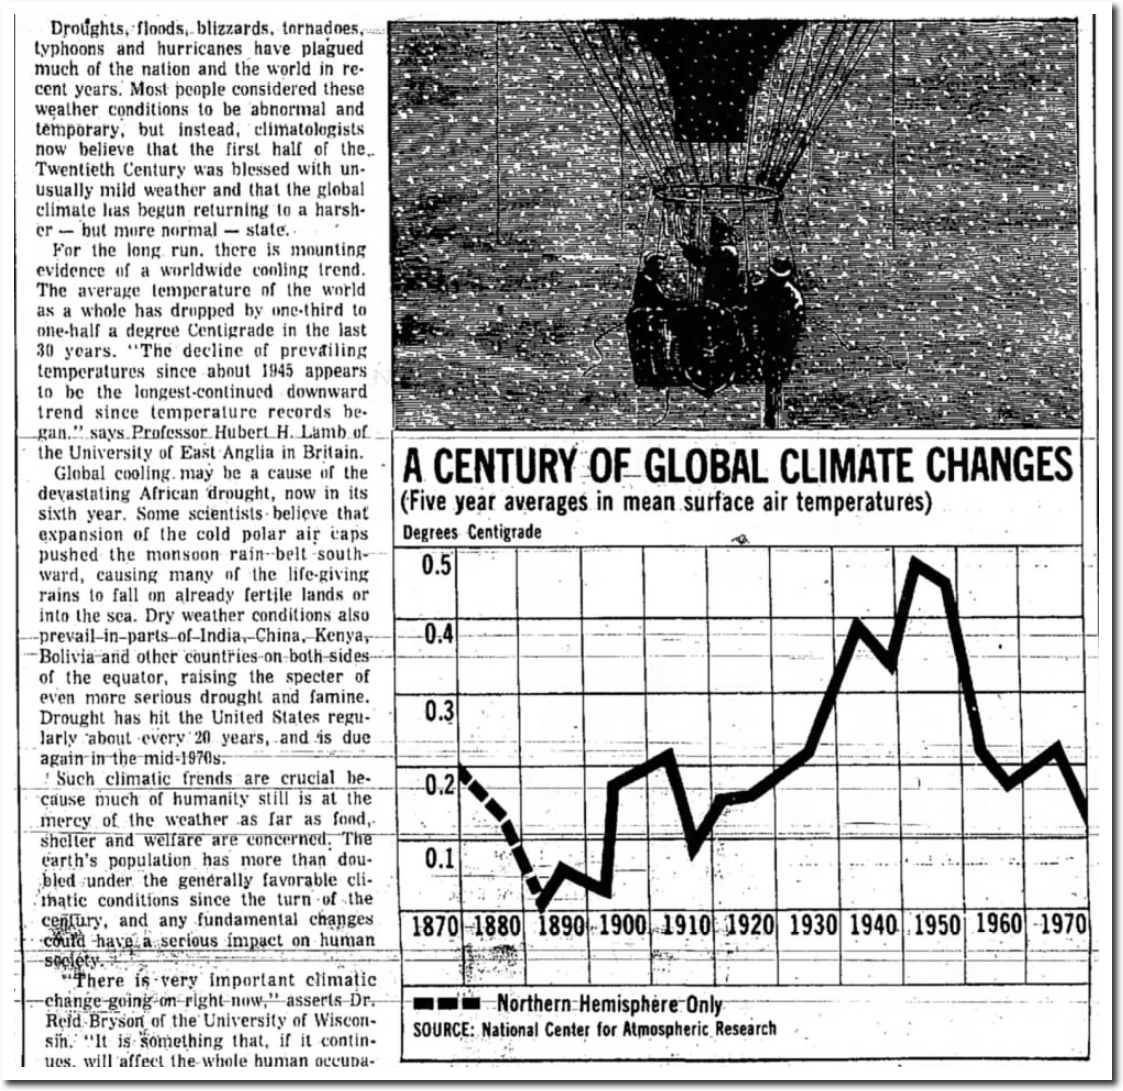
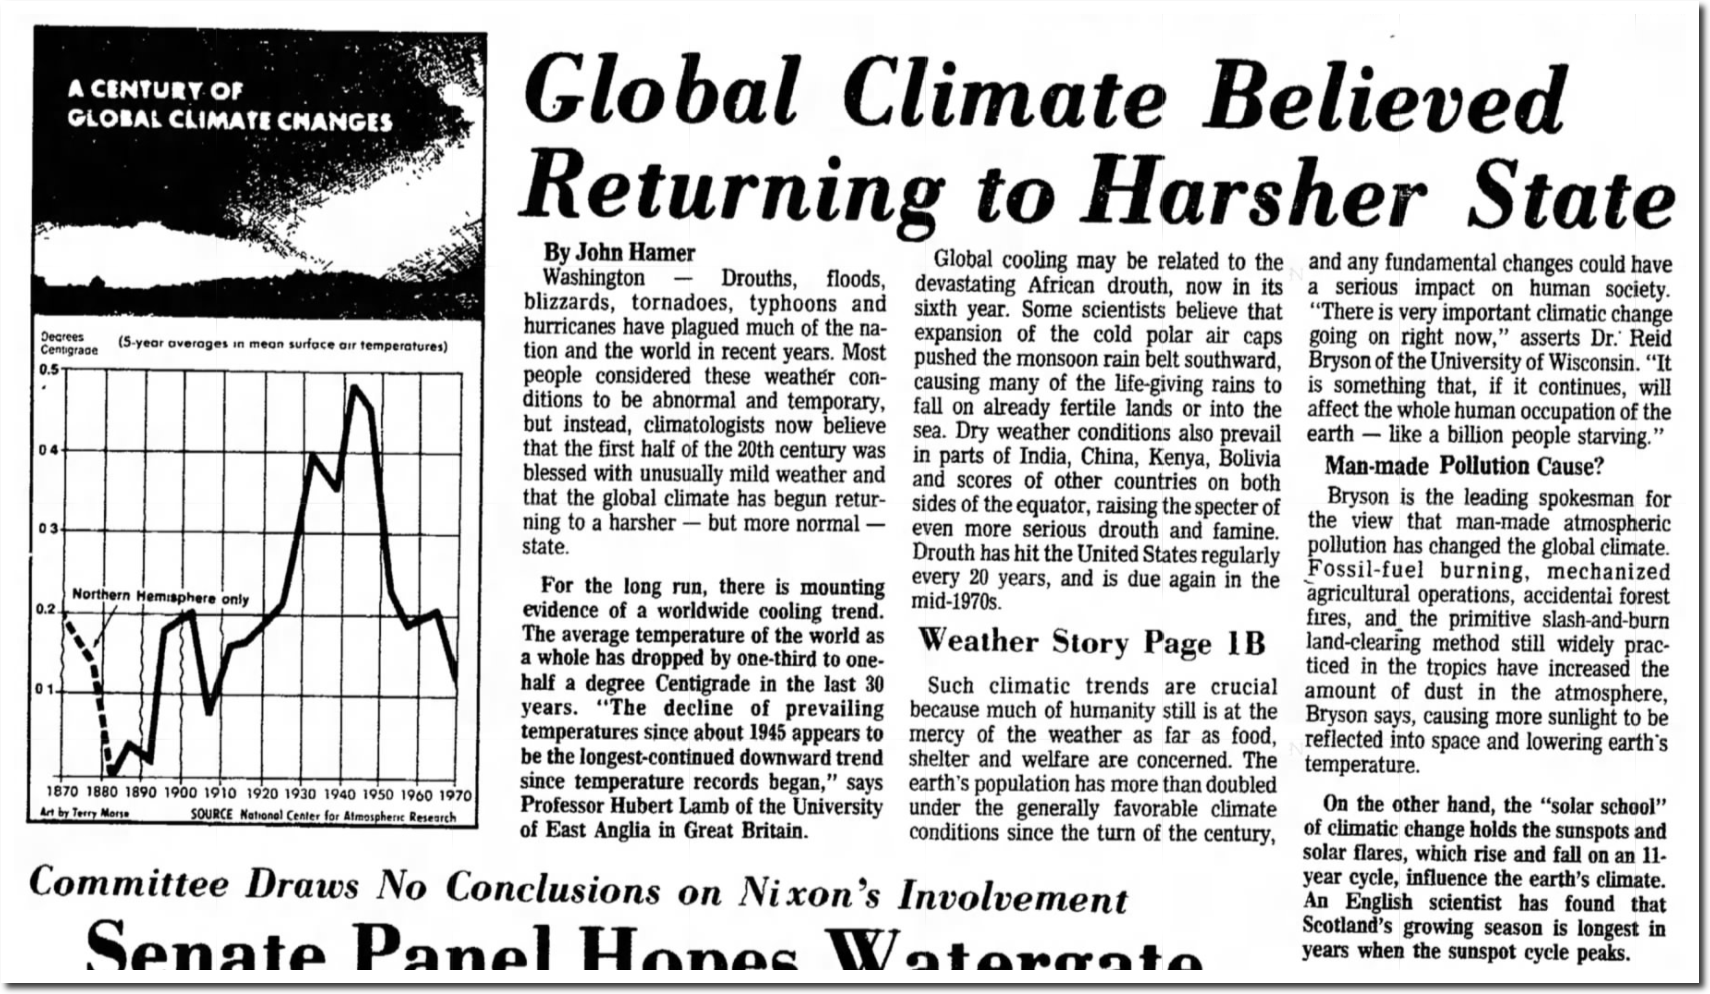
The NCAR graph is not from Newsweek, 1975. It was widely published in 1974. Here are a few examples. There are lots more out there.
Click on the images to zoom.
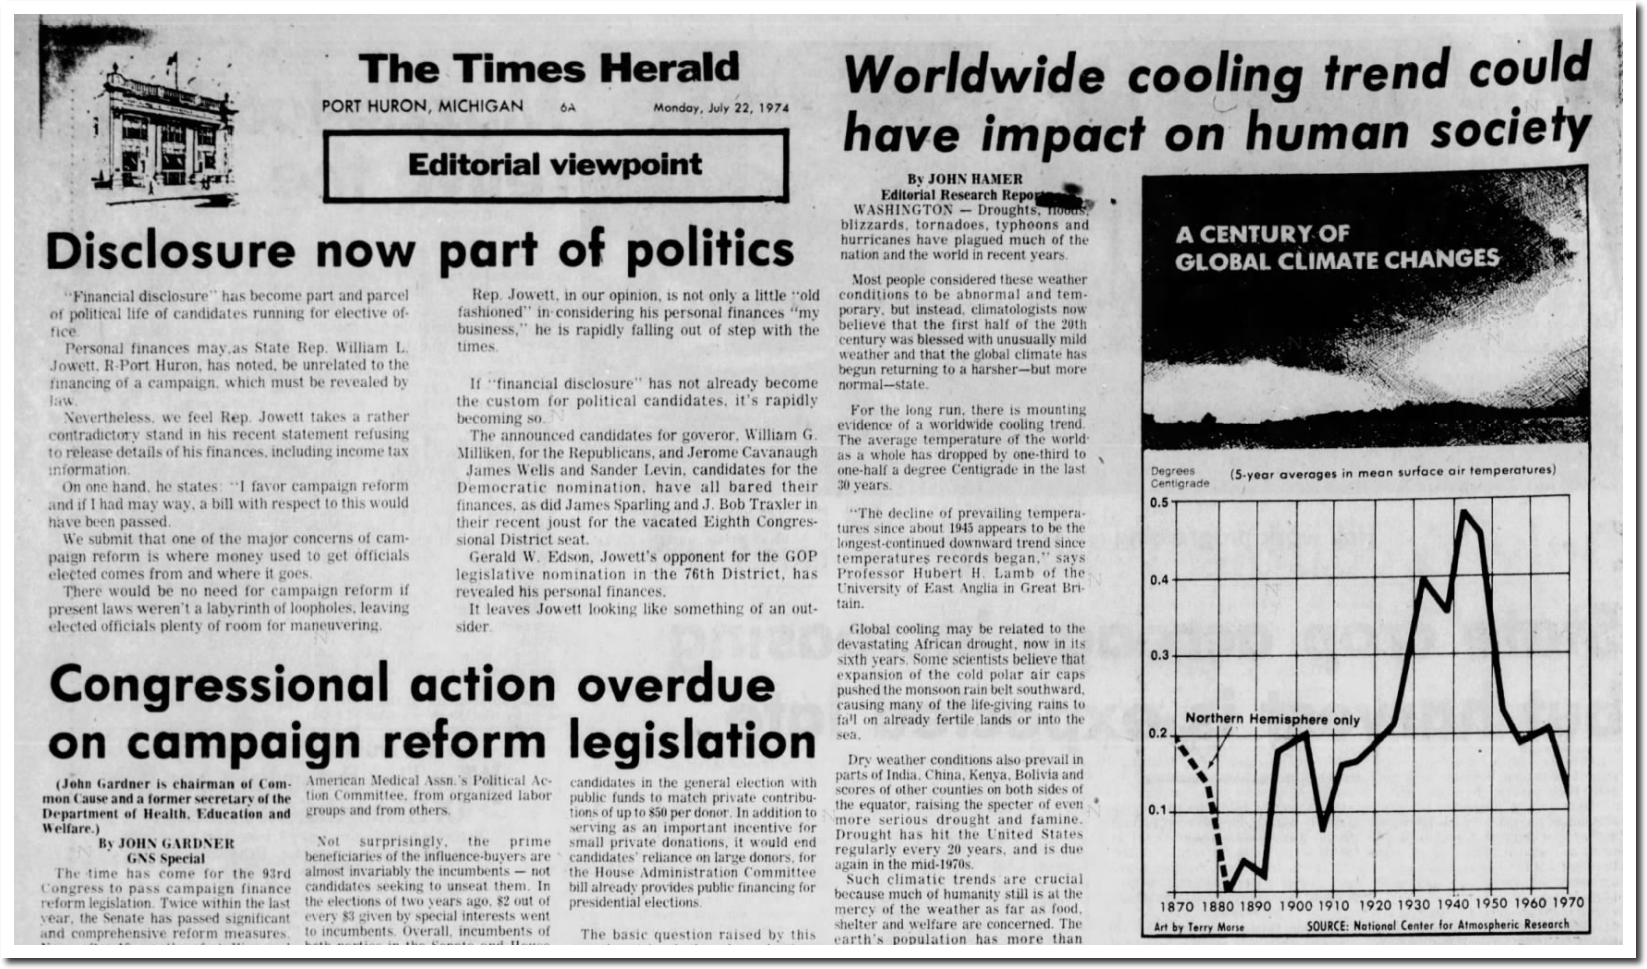
22 Jul 1974, Page 6 – The Times Herald at Newspapers.com
21 Jul 1974, Page 13 – The Des Moines Register at Newspapers.com
14 Jul 1974, Page 1 – Lincoln Evening Journal at Newspapers.com
The 1974 NCAR graph was completely consistent with what Steven Schneider and Walter Orr Roberts of NCAR were saying at the time. They were pushing global cooling – which was going to kill us all.
12 Jun 1974, Page 20 – at Newspapers.com
I will deal with Nick’s other idiotic claim in a different post.
Steven Goddard produces these plots, and they seem to circulate endlessly, with no attempt at fact-checking, or even sourcing. I try, but it’s wearing. The first GISS plot is not the usual land/ocean data; it’s a little used Met Stations only
The amount of misinformation in that claim is breathtaking. Nobody attempted to do land/ocean plots in 1974, because they weren’t willing to make up fake temperature data like modern climate fraudsters. GISS graphs were land only until about 2003.
date: Wed Apr 15 14:29:03 2009
from: Phil Jones <[email protected]> subject: Re: Fwd: Re: contribution to RealClimate.org
to: Thomas Crowley <[email protected]>Tom,
The issue Ray alludes to is that in addition to the issue
of many more drifters providing measurements over the last
5-10 years, the measurements are coming in from places where
we didn’t have much ship data in the past. For much of the SH between 40 and 60S the normals are mostly made up as there is very little ship data there.Cheers
Phil
Green energy is worthless. If Puerto Rico had to depend on it, they would be back to the Dark Ages.
