Systematic Destruction Of The Temperature Record Since 2000

There was plenty of data tampering to the temperature record prior to the year 2000, but since the year 2000 the tampering has become very systematic and cynical. Gavin Schmidt at NASA has more than doubled global warming by altering his own temperature data since 2000.

NASA data

Note the spectacular hockey stick of data tampering since the year 2000.

This presents a huge problem for Gavin, because satellite temperatures show little or no warming since the year 2000.

Wood for Trees: Interactive Graphs

Furthermore, Gavin is continuously tampering with data to make his hockey stick of temperature fraud even worse. Not the upwards change since before the election.

Wood for Trees: Interactive Graphs

Satellite data from RSS shows earth cooling at the fastest rate on record over the last ten months This graph shows the current temperature anomaly minus the anomaly ten months earlier.

RSS_TS_channel_TLT_Global_Land_And_Sea_v03_3.txt

Carl Mears at RSS has come to Gavin’s rescue however, by telling people not to use his lower troposphere data, and instead use his TTT data set which reaches all the way up to 50,000 feet – where temperatures are about minus 100 degrees.

?images.remss.com/papers/rsstech/Jan_5_2017_news_release.pdf

Carl’s new TTT data set shows a lot more warming than the lower troposphere data.

RSS / MSU and AMSU Data / Time Series Trend Browser

We see the same systematic hockey stick of data alteration, in an effort to make  satellite data match Gavin’s altered temperature data.

?TLT    TTT

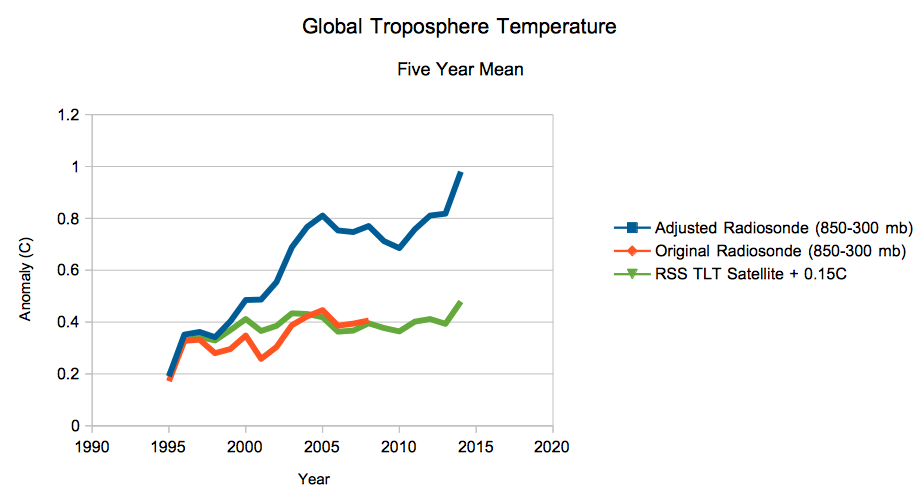
Are Carl Mears’ changes legitimate? A good way to test them is to compare versus radiosonde data of the troposphere. Unfortunately NOAA has done exactly the same data tampering to the radiosonde data. Their original radiosonde data showed only 0.2C warming since 1958, so they altered it to produce 0.8C warming.

Original data    Altered data

Once again, we see the same hockey stick of data tampering to bring radiosonde data in line with Gavin’s highly altered temperature data.

And NOAA has done exactly the same thing with US temperature data.  It didn’t match the altered global temperature data, so NOAA altered US temperatures to make them match fake global temperatures.

Adjusted Data   Raw Data

Again, we see the same hockey stick of data tampering.

All of the data sets have been massively tampered with since the year 2000, in an effort to bring them in line with the tampered NASA data set. And this doesn’t even include the massive tampering done prior to the year 2000 to erase the 1940’s temperature spike, and post-1940’s global cooling.

14 Jul 1974, Page 1 – Lincoln Evening Journal

All of this data tampering was committed intentionally, and in collusion between agencies.

?di2.nu/foia/1254108338.txt

Climate science depends on the accuracy of this data, which is neither accurate nor legitimate. Global warming is the biggest science scam in history.

Posted in Uncategorized | Leave a comment

Greenland Ice Growth Continues To Blow Away All Records

Experts say Greenland is melting down and unraveling.

As with everything else they say, the exact opposite is occurring. Greenland is blowing away all records for ice gain.

Greenland Ice Sheet Surface Mass Budget: DMI

This is what Greenland looked like a month ago. I didn’t see anything unraveling.

Posted in Uncategorized | Leave a comment

Desperation Rises Among Journalists As Their Scam Comes To An End

Two days ago, USA Today said the California drought is making global warming worse, and droughts are getting longer and more severe because of your SUV.

Side effect of California’s drought? More climate pollution

Northern California is actually having their wettest water year on record.

NWS: Northern California now on pace for ‘wettest water year on record’ – SFGate

Droughts have become much less common and less severe in California over the past millenium.

relatively wet periods like the 20th century have been the exception rather than the rule in California for at least the last 3,500 years

Severe Ancient Droughts – A Warning to California – NYTimes.com

California used to be in drought most of the time. Unusually wet conditions during the 20th century allowed tens of millions of hopelessly confused progressives to move there.

As is almost always the case, fake news journalists are reporting the exact opposite of what is occurring.

Posted in Uncategorized | Leave a comment

Too Cold To Snow

A common rumor among alarmists is that you can’t get much snow when it is cold, which is why they think global warming brings snow to Mississippi.

Boulder broke our all time January one day snowfall record today with 14 inches of snow.  The maximum temperature today was 8F. At 11PM it is -36F in Wyoming and -22F in Colorado.

Posted in Uncategorized | Leave a comment

Record Arctic Fraud Continues

Experts say Arctic sea ice is at a record low level and is rapidly disappearing.

As always, they are lying. Arctic sea ice extent is the highest in at least five years, and has been growing at a record rate over the past two weeks.

Ocean and Ice Services | Danmarks Meteorologiske Institut

The ice edge in the Barents Sea and along Newfoundland has grown hundreds of  miles since December 22.

These scientists crooks stand to lose huge amounts of money after January 20, and are ramping up the lies to spectacular new levels in a desperate effort to deceive the public.

Posted in Uncategorized | Leave a comment

“Super-hot” Arctic Air Arrives!

“If you thought that science was certain – well, that is just an error on your part.”

? Richard Feynman

Experts at the Washington Post say the Arctic is “super-hot.”

The North Pole is an insane 36 degrees warmer than normal as winter descends – The Washington Post

The super-hot Arctic air has arrived! It is -41F in Wyoming and -33F in Colorado right now.

And -19F just outside Boulder.

If you believe anything you read in the Washington Post, well that was just an error on your part.

Posted in Uncategorized | Leave a comment

Massive Decline In The Integrity Of NOAA

NOAA reports a massive decline Arctic sea ice and snow through late November, and that their satellite records for sea ice began in 1979.


Massive Decline in Arctic Sea Ice, Snow | Global Trade Magazine

NOAA satellite records actually extend back much further than 1979, but NOAA hides them because 1979 was the peak and the earlier records wreck their scam. Ice extent in 1974 was nearly two million km² lower in 1974 than it was in 1979.

The massive decline in snow reported by NOAA is actually a massive increase. Snow extent  this autumn was the second highest on record.

Rutgers University Climate Lab :: Global Snow Lab

For the entire year, snow extent has increased substantially over the past 30 years.

?climate.rutgers.edu/snowcover/files/moncov.nhland.txt

Basically, everything you hear about climate from the government and press is fake news. It is intended to mislead, not inform.

Posted in Uncategorized | Leave a comment

Coldest Weather I Have Ever Seen

It is currently -14F in Boulder and -41F across the border in Wyoming. I have never seen temperatures this cold before.

Posted in Uncategorized | Leave a comment

Researching The Thing Of The Past

Our leading climate experts say that snowfalls ended 17 years ago.

Snowfalls are now just a thing of the past – Environment – The Independent

My research assistants and I investigated that theory this morning, and came to the conclusion that climate scientists are complete morons.

Posted in Uncategorized | Leave a comment

The Progressive Data Tampering Continues Unabated

You can’t make this stuff up. One layer of temperature fraud piled on another.

RSS lower troposphere temperature data shows that cooling over the last 10 months has been the fastest on record.

RSS_TS_channel_TLT_Global_Land_And_Sea_v03_3.txt

So Carl Mears of RSS rushed out a press release today saying 2016 was the hottest year, not to use lower troposphere temperatures, and instead imagine we live at 20,000+ feet.

?images.remss.com/papers/rsstech/Jan_5_2017_news_release.pdf

Meanwhile, yesterday, Zeke Hausfather told the press that there never was a hiatus. (The same hiatus which experts made dozens of excuses for over the past decade, and Michael Mann says is real.)

Today, Zeke says we should compare GISS surface temperatures to Carl Mears upper troposphere temperatures, and ignore all those air temperatures down near where we live.

But here comes the fun part. Zeke then said to compare the upper troposphere temperatures with the “most commonly used sonde data (RATPAC)

So why is Zeke using RATPAC data?  Because it is heavily adjusted. RATPAC adjustments quadrupled warming relative to the raw radiosonde data generated by Jim Angell at NOAA since 1958


Angell     RATPAC

The hockey stick of adjustments to the radiosonde data mirrors all the fake adjustments done to surface temperature data sets by NASA and NOAA.

So how does this all tie together?  RSS lower troposphere data matches radiosonde data very closely, until they tamper with the radiosonde data. So they altered the radiosonde data and used the altered data as an excuse to ignore and eventually tamper with the lower troposphere data.

In the 1995 IPCC report, none of the data sets (surface, radiosonde, or satellite) showed any net warming from 1958 to 1995.

Essentially all of the warming since 1958 is due to data tampering. The game they play is to adjust one data set upwards, then use the adjusted data as an excuse to successively adjust all the other ones upwards to match, in a domino effect. This was aptly described in the Climategate E-mails as “hiding the decline.”

Posted in Uncategorized | Leave a comment