Mind-blowing incompetence or fraud from the 2007 IPCC report.
www.ipcc.ch/pdf/assessment-report/ar4/wg1/ar4-wg1-chapter5.pdf
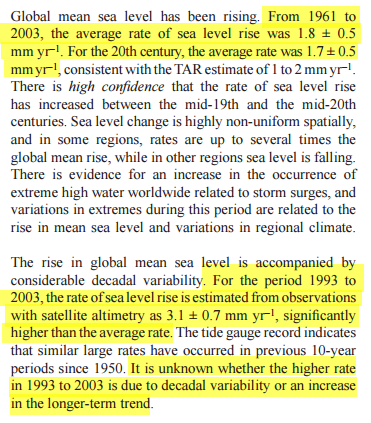
The IPCC switched measurement systems in 1993 from tide gauges to satellites, declared a huge increase in sea level rise rates, and didn’t consider the possibility that the increase in rate was due to their changing measurement systems – rather than the climate.
Any third grader trained in science would have cross-checked vs. their earlier measurement system to see if there actually was an increase in 1993, rather than just an instrumentation issue. There wasn’t – the authors and reviewers are completely incompetent.
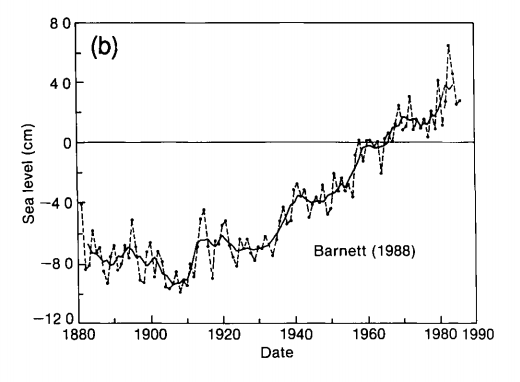
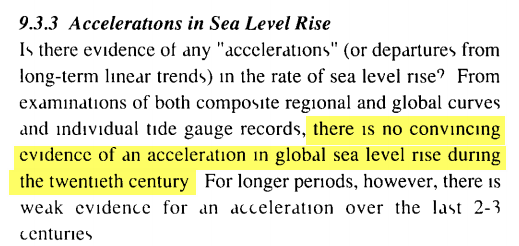
But the fraud is worse than it seems. The 1990 IPCC report showed around 1.2 mm/year and said there was no convincing evidence of acceleration during the 20th century.
https://www.ipcc.ch/ipccreports/far/wg_I/ipcc_far_wg_I_chapter_09.pdf
How did they go from 1.2 mm/yr to 3.1 mm/yr between 1990 and 2007? But the fraud is even worse than it seems. In 2004 the official rate of satellite sea level rise was only 2.8 mm/year.
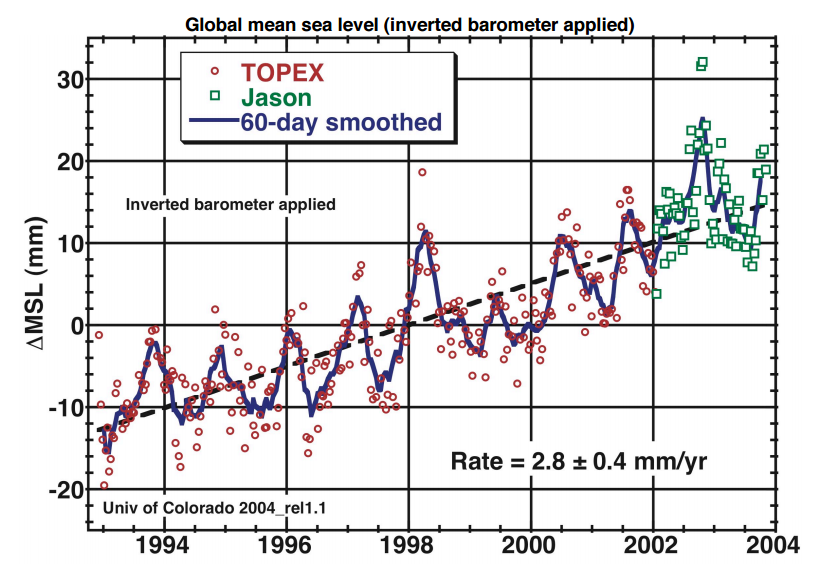
web.archive.org/web/20040613002139/http://sealevel.colorado.edu/2004_rel1.2/sl_cu2004_rel1.2.pdf
And now they have further bumped it up to 3.3 mm/year.
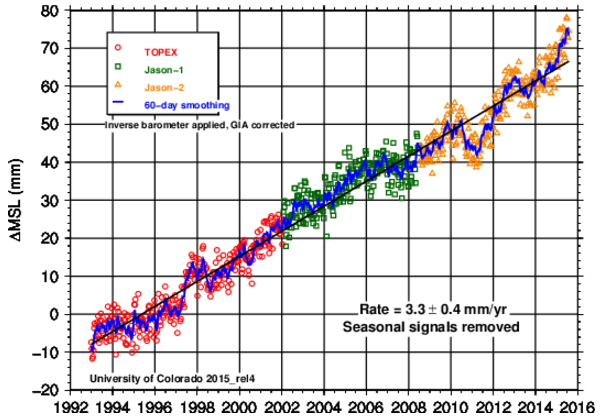
CU Sea Level Research Group | University of Colorado
Using tide gauges, NOAA reports just over half that much sea level rise.
the absolute global sea level rise is believed to be 1.7-1.8 millimeters/year.
Sea Level Trends – Global Regional Trends
Tide gauges show that sea level rise rates peaked in the 1950’s. East coast tide gauges report high rates due to land subsidence, but they have slowed down over the past 60 years – not accelerated.
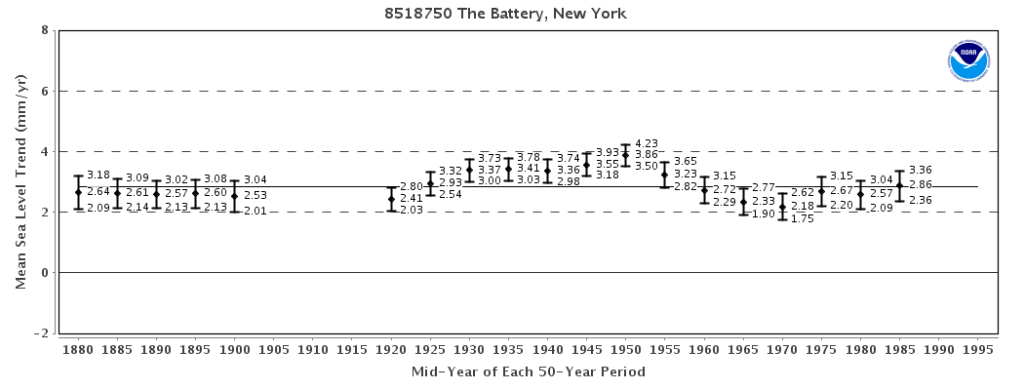
Sea Level Trends – Variation of 50-year Mean Sea Level Trends
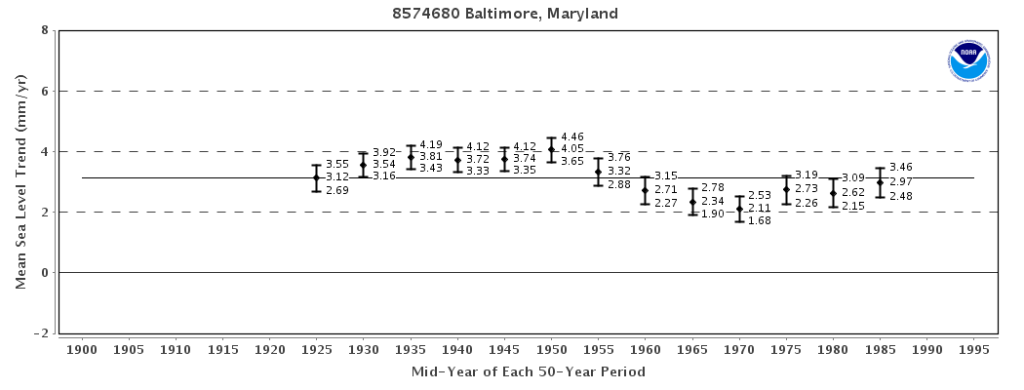
Sea Level Trends – Variation of 50-year Mean Sea Level Trends
Climate scientists have no training in signal processing, and have a clear conflict of interest. They are not qualified in any way to do this sort of analysis, and keep bumping the numbers up to keep their funding coming in.


