
Gavin has a new paper out explaining the cause of the hiatus (which he also just erased.) He says that burning fossil fuels is generating aerosols which are suppressing global warming.
“TCR is characteristic of short-term predictions, up to a century out, while ECS looks centuries further into the future, when the entire climate system has reached equilibrium and temperatures have stabilised.”
Climate change shock: Burning fossil fuels COOLS planet, says NASA | UK | News | Daily Express
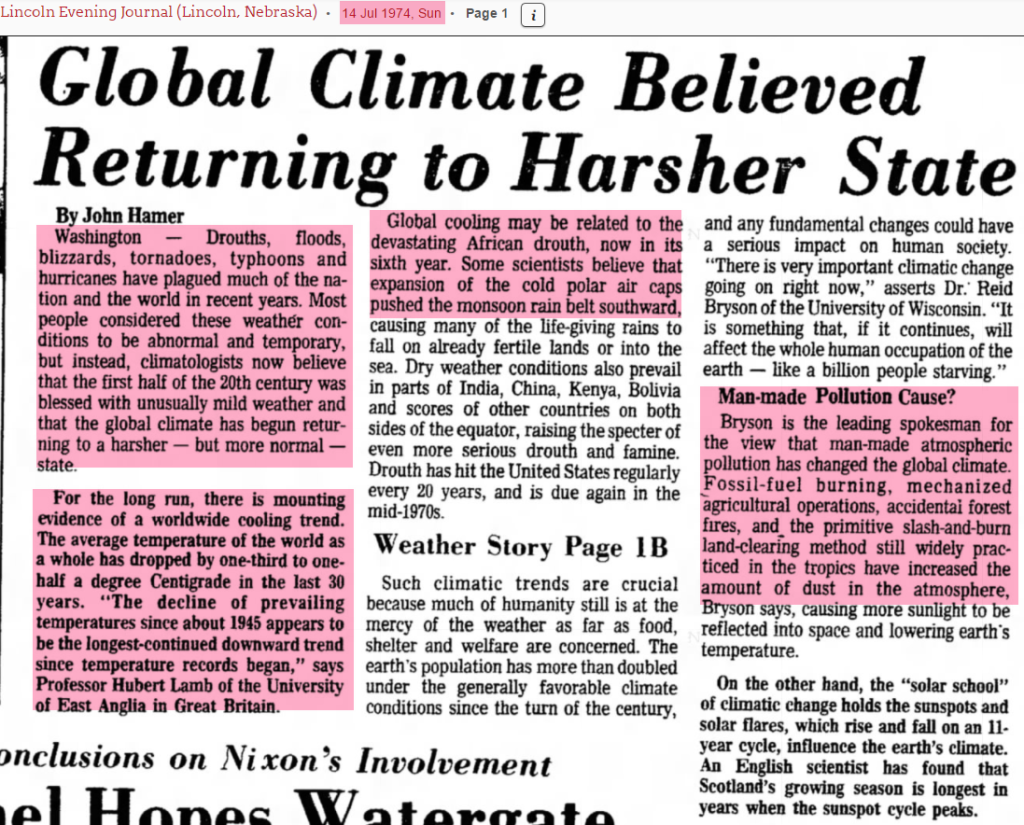
This is the identical argument which climate scientists used in their last ice age scare of the 1970’s – during Watergate.
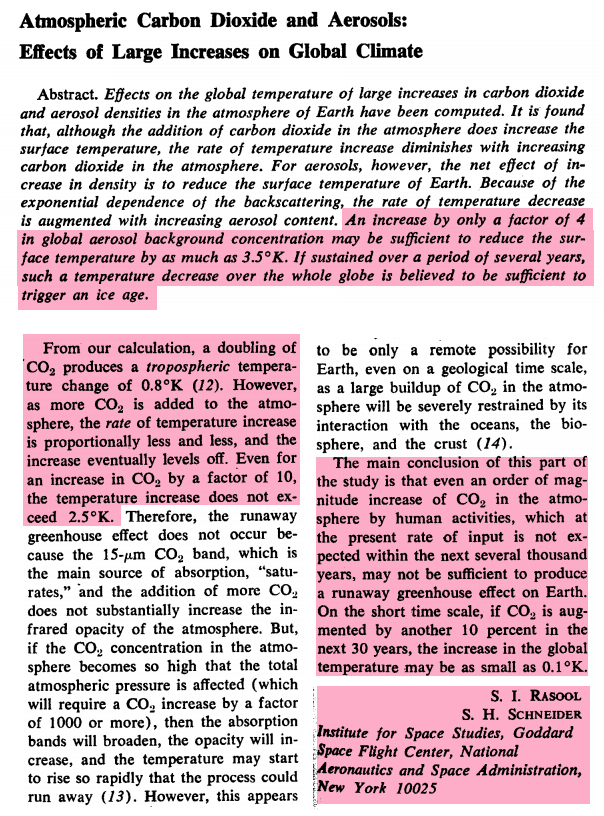
NASA’s top climatologists reported the same thing in 1971, and made it clear that the effects of CO2 are not dangerous, and never will be dangerous.
http://vademecum.brandenberger.eu/pdf/klima/rasool_schneider_1971.pdf
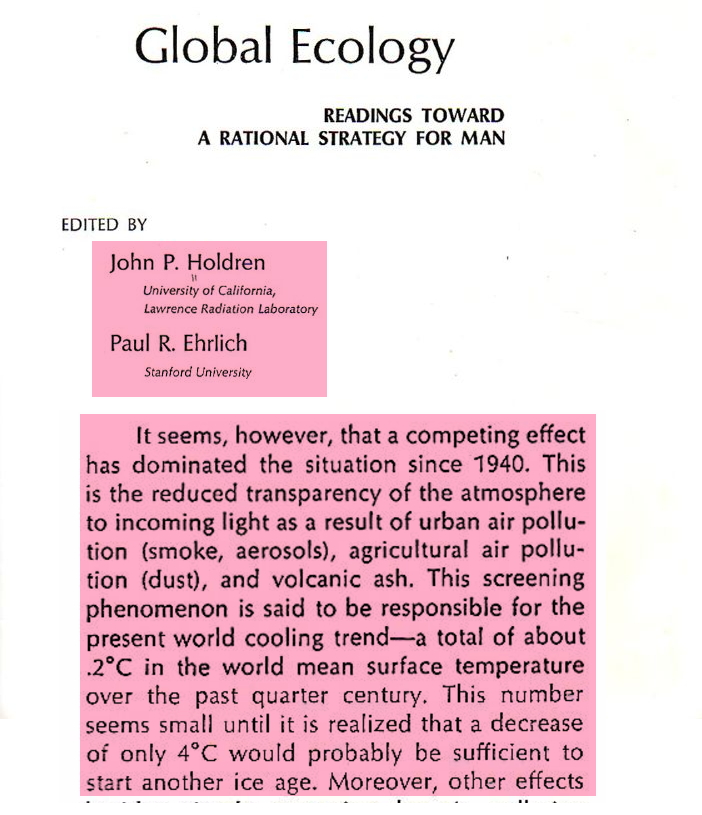
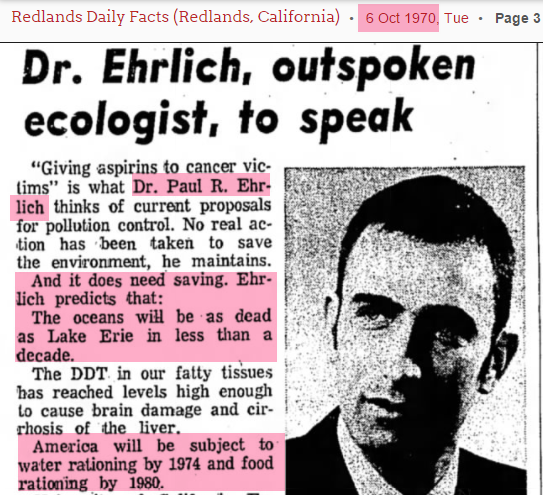
Obama’s science adviser John Holdren reported the same thing in 1971, and predicted a new ice age in a joint paper with Paul Ehrlich.
Ehrlich also reported that the US would have food and water rationing by 1980.
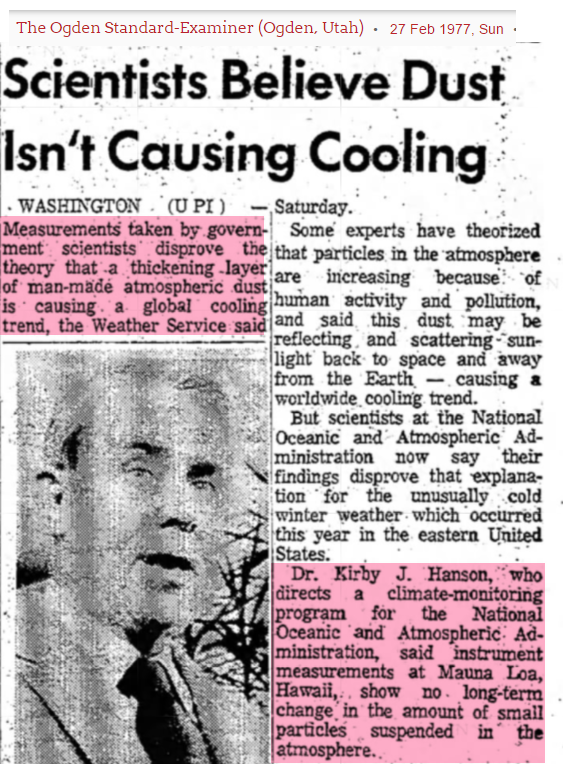
NOAA shot this theory down by the year 1977, so it is pretty remarkable that Gavin is trying to resurrect it in 2015.
This endless cycle of mindless climate insanity and lies is what President Obama calls “settled science” – and wants to silence anyone who disagrees.

The claims about the so-called “Global Cooling” of the ’70s has been thoroughly debunked. Get with the program already!
You are wrong, Steve. I think you know that, so why play the idiot? The cooling effect of aerosols is real. It was real in the 1970’s, but the EPA enforced the Clean Air Act and we and Europe eliminated most of it. Now China and India are the causes, as well as some increased volcanic activity, but once again, the volcanic activity will subside, and China and India will of necessity eliminate their air pollution. Then the cooling effect will diminish again.
[SG: Now our resident climate clown is claiming that 2% of the Earth’s surface controlled the global climate in the 1970s]
Steven, if you have to lie about what I write, what is the point of the discussion? No, I am not claiming 2% of the earth’s surface controlled the global climate in the 1970s, nor did I say anything like it. The cooling effect of aerosols in the 1970s was real. Air pollution in the US and Europe was heavy. There were about 10 volcanic eruptions contributing a lot of aerosols. The belief and the claim was that these were having a cooling effect, and they were. Gavin Schmidt’s claim is that aerosols are having a cooling effect now, and they are. There never was an ice age scare, and NASA certainly isn’t recycling it or claiming it will happen now. The claim is that the global average temperature is lower than it would be without the aerosols.
Your blog post is simply wrong.
[SG : Our resident clown is now claiming that he didn’t say what he said about the Clean Air act ending global cooling. Martin’s Alinsky routine is to kick dust up and then claim there is a cloud. Classic entertainment]
There never was an ice age scare, and there never was a warming scare. And the emperor was wearing clothes all along.
I don’t know how you want to define a “scare”, but whether there was a scare or not, there was well documented global cooling between 1940 and 1980. The three consecutive winters, 1977, 1978 and 1979 were the three consecutive coldest winters in US history. I lived through that and I can assure you that after massive paralysis from blizzards in many major cities, no one felt very sure that we were not going into a Ice Age.
Tony,
When are you pulling the plug on this guy? All he can do is make obnoxious snide remarks and regurgitate alarmist talking points that you have repeatedly discredited. It is getting tiresome.
Andy
Andy DC
I consider him the resident village idiot. He keeps pitching Alarmist Lies and we keep hitting them out of the ball park.
http://www.quickmeme.com/img/05/05de7cea80a94c30191e0da30a62df4571ba1ec419f44e11a3fefd44ca50daf2.jpg
Not that I get a vote, but my vote would be to keep him. I think banning anyone sets a bad precedent. The step from completely open to the first ban is much bigger than the step from one ban to banning anyone who disagrees. Martin’s favorite cartoonist runs his site that way, and both the discussion and the credibility suffer for it.
Also, when you read through the comments, the actual science presented (I can’t say discussed, since it’s entirely one sided) is much stronger when Martin and cfgjd pull their John Cleese Argument Clinic routine. The responses to those two have greatly increased my own understanding of climate science. It would be nice if either of them could also provide some sort of scientific argument, but we can’t get everything. On the whole, Tony’s arguments have been greatly strengthened by their presence.
I think it would be a mistake pulling a plug on an accomplished entertainer who can do it to himself every time he comments.
Martin Smith is this blog’s only known humanist Buddhist Christian individualist libertarian*) who wows to overthrow oppressive governments by force**) when he gets exhausted overthrowing them peacefully.
Martin Smith also denies having said many things he’d said but there is an open inquiry if he’s ever said:
***)
There is no controversy surrounding his quest for the right graph. The wrong graph gives him the heebeedee-geebees.
——————–
*) He’s not, however, a “rugged individualist libertarian”. He’s more relaxed and nuanced about the darn thing.
**) He’s also not a “part-time revolutionary militiaman”. It’s assumed he favors doing all that overthrowing in a more individualist ad-hoc way.
***) Some investigators assign this quote to Yogi Berra.
“Your blog post is simply wrong.”
BULLSHIT..
Even when the evidence is laid out in front of you.. for ALL to see.. you still DENY, DENY, DENY.
You are a very sad piece of human excrement, little goreboy.
Please keep him.. at least until the current El Nino subsides and global temps start to drop.
I so want to see him run and scurry like the cockroach he is.
..and here we go again with the AGW industry ‘science bloggers’ who insist on blaming the current cooling on anything BUT the waning sun, we just had had the weakest solar cycle in 100s of years and they just can’t let the argument go i that diresction; since the sun and ocean currents so obviously dominate the Earths climate..we just can’t talk about it.. they have to insist that its always ‘something we’re doing’ (burning stuff) and we have to stop doing it (not burning stuff) so that more money goes to AGW industry toys like windmills and solar panels that are so inadequate for modern energy needs that they are futile.
http://www.webweaver.nu/clipart/img/people/men/rotlmao.gif
The Marty Gorebot forgets the slash and burn primitive agriculture used in Africa and South America and the pollution belching of coal, dung and wood fires in the second and third world where pollution control devices were never used. China did not turn on some of the pollution control technology that was already built until recent air pollution protests. It adds over $16 billion/year to electricity prices
Today, China with the largest population and economy is belching out real pollution
From Mother Jones:
http://www.motherjones.com/environment/2015/06/china-coal-carbon-climate-guardian
Up until the 1850?s dung and wood were the major source of energy. It is the brown line (snicker) called ‘Traditional Renewables’
http://dieoff.org/page199_files/image002.gif
Interesting that a switch is made to cleaner energy and away from dung, wood and coal in the 1970s
The USA from same source
http://dieoff.org/synopsis_files/image004.gif
“so why play the idiot?”
Look deep inside yourself , and ask that question, Worthless little gorebot.
Are you play acting the idiot.. or are you really an idiot.?
Marty gets his kicks from all you people above wasting your time responding to his inane posts and, I am afraid, that includes Steven.
Once the troll gets no bites he tends to find another pond in which to fish.
True, but we do not write for the trolls we write for the fence sitters. At least I do and Marty the Gorebot does a great job of exposing the ClimAstrologists as con men hiding behind a very tattered curtain.
I agree with Gail.
These trolls are always putting forward AGW mis-information.
It needs to be corrected so other visitors to the forum can see just how mis-informed the trolls are.
https://whyamerica2015.files.wordpress.com/2015/09/image.jpg
Blame it on Ford.
Nis family gave a 30,000 cubic foot computer to Harvard GSD …biggest fastest, best. in 1975 when it opened with Graduate School of Design (GSD) building above it.
Now your cell phone is superior to GSD buzzer.
Harvidiots jumped to conclusions as they put in data.
Afiirmatives, Harvidiots, SocioComs, Bitters of all shapes & colors still seek revenge for old policies including those at both Cambridges..
DDT is poster Monster Child that has been replaced by CO2.
Obama actually mentioned “acid rain” & our success at scrubbing so efficiently that coal power plants sell sulfur as fertilizer.What he did not mention is politics punished common sense & desire of plant guys by changing the rules by political whim not looking for winners.
Cleaning our air & water is a nightmare for fear fraud industry….
High unemployment of fear feasters would be affirmative to climate and finally destroy an industry worthy of destruction.
Steven, if you are claiming that Gavin Schmidt is trying to raise fear of a looming ice age, then you can’t be serious. It appears that you are deliberately misrepresenting what Schmidt is talking about. Both sulfate and non-sulfate aerosol effects were added to the global climate models in the 1990s. Gavin Schmidt is drawing attention to the fact that aerosols are right now preventing some of the global warming that would be seen if the aerosols weren’t there. So that when China in particular deals with its huge pollution problem, that cooling effect will be removed.
You simply can not fault that argument without making yourself look like an ass.
[SG: Martin is getting increasingly desperate, and creating his usual brainless straw man arguments to fight against]
I can do that too:
[WS: Steven is getting increasingly desperate, and creating his usual brainless straw man arguments to fight against]
But it’s just as immature as when you do it. So I try to stick to the issue.
Martin, you got the front half of your initials upside down.
It’s my middle initial, wizz, my middle initial. Thanks for noticing.
Peer review 🙂
Wizzum, in no reality would I call MS your peer. I have too much respect for you.
I thought he actually got it right for once as ‘Winston’.
Global dimming vs global brightening.
http://journals.ametsoc.org/doi/pdf/10.1175/BAMS-D-11-00074.1
Steven, you appear to have deliberately misrepresented your 1977 newspaper article. The scientist does not claim that increasing aerosols in the atmosphere don’t cause cooling. The scientist claims aerosols are not increasing in the atmosphere. You neglected to highlight that statement. It makes a big difference and invalidates your claim that “NOAA shot this theory down by the year 1977…” NOAA made no such claim, and you know that.
[SG: Martin continues to spout his desperate lies. The NOAA study said quite explicitly that there was no long term increase in particulates and that they were not responsible for the trend]
Martin:: the NOAA for years, have made various claims of increasing aerosols:
http://www.noaanews.noaa.gov/stories2011/20110721_particles.html
………….
NASA also make similar such claims that get regurgitated over & over:
http://earthobservatory.nasa.gov/Features/Aerosols/page4.php
…………..
Of course there is a World of difference ; the effect of Aerosols is better understood and
has credibility ; whereas the CO2 “hypothesis” for AGW, is just Junk Science..!
…………..
I don’t get your point, Marsh. As far as I know, neither NOAA nor NASA has never claimed aerosol pollution would increase global warming. The claim is that aerosol pollution has a cooling effect. The CO2 hypothesis is much older than the aerosol one, and it’s basis in physics has been well understood for over a century, I think. In fact, heat seeking missile technology is based on it, so it definitely is settled. What isn’t settled is the sensitivity to increasing CO2, but there is very high confidence that even the minimum will cause a lot of damage. In any case, Steven’s blog post is wrong.
[SG : Our resident Alinskyite continues to kick dust up – and then screams “cloud”]
You know very well that the effects of CO2 on temperature are a log function and that there is extremely small increases in temperature attributable to it going forward no matter how much it increases.
You also know that increasing CO2 has a very beneficial effect on farming, especially in the more arid regions.
You are a liar.
The CO2 hypothesis is much older than the aerosol one, and it’s basis in physics has been well understood for over a century, I think. In fact, heat seeking missile technology is based on it, so it definitely is settled.
You seem to be saying that heat seeking missile tech is based on the CO2 hypothesis (suggested explanation for an observable phenomena), and then claim that because heat seeking missles work, that proves “the CO2 hypothesis”. You can’t be serious.
http://joannenova.com.au/globalwarming/graphs/log-co2/log-graph-lindzen-choi-web.gif
It takes 5.44 W/sq.m to raise the temperature 1 degree C according to the Stefan-Boltzmann law assuming the average surface temperature is 288K (15°C or 59°F.) The entire CO2 forcing is 32 to 44 W m–2 [cf., Reid, 1997]. and all but 5 to 6 W m–2 of that forcing occurs in the first 200 ppm CO2 (modtran) At 200 ppm CO2 plants barely survive.
The paper Can we predict the duration of an interglacial? gives the calculated solar insolation values @ 65N on June 22 for several glacial inceptions. (It is one of several recent peer-reviewed papers indicating high levels of CO2 are the only thing keeping the earth out of glacial inception)
Current value – insolation = 479W m?2 (from that paper)
MIS 7e – insolation = 463 W m?2,
MIS 11c – insolation = 466 W m?2,
MIS 13a – insolation = 500 W m?2,
MIS 15a – insolation = 480 W m?2,
MIS 17 – insolation = 477 W m?2
So the earth is in the correct ballpark for the start of a BIG ice age.
NOAA lists the Berger calculations for June solar insolation values @ 60°N (not 65°N)
http://www1.ncdc.noaa.gov/pub/data/paleo/climate_forcing/orbital_variations/berger_insolation/insol91.jun
Holocene peak insolation: 523 Wm-2
…………………..decreased = 47 Wm-2
to NOW (modern Warm Period) 476 Wm-2
………………….. decrease another = 12 Wm-2
to get to the Depth of the last ice age – around 464 Wm?2
Look at the amount of solar insolation it took to get out of the Wisconsin Ice Age and do not forget the Younger Dryas Cold Event aka The Big Freeze (ca. 12.9–11.6 ka) that flipped the earth back into the Ice Box despite the high insolation values.
11,000 years ago…………… 523.16 Wm-2 peak insolation
Wisconsin Ice age- Holocene transition
12,000 years ago…………… 522.50 Wm-2
In other words the earth barely made it out of the Ice Box at peak insolation and the earth has dropped an additional 47 Wm-2 since that peak and is now ONLY 12 Wm-2 above the bottom value for the Wisconsin Ice Age.
The Holocene interglacial is now 11,717 years old. That’s two centuries or so beyond half the present precession cycle (or 23,000/2=11,500). So the little Ice Age was about the right time for glacial inception. However we had the Modern Grand Solar Minimum starting in 1850 that dragged the earth into the modern warm period. That has now ended.- A History of Solar Activity over Millennia
Politicians and fools like Marty want to REDUCE the CO2 that might just keep us out of the Ice Box? Are they crazy or do they have a death wish!?
http://www.clipartbest.com/cliparts/dc8/a96/dc8a96pce.png
pinroot, you wouldn’t have to guess what I am saying if you just investigate the physics we are talking about. The physics of the greenhouse effect are settled science. It has been settled science for a very long time. Heat seeking missile sensors are based on those same laws of physics.
wizz, you are deliberately ignoring the positive feedbacks.
Martin…global warming theory (physics) was that CO2 had very little effect…
CO2 was supposed to increase temps a little…which was supposed to increase humidity
It was always water vapor……run away humidity
Since when did CO2 become the primary driver?
As the effect of CO2 on temperature decreases so too will the amount of any feedback. Unless you are going to start sprouting off about tipping points.
Ahhhh, yes. The magical feedbacks. So you’re finally admitting that this “settled science” you keep harping on is NOT the primary cause of the warming you claim. Those feedbacks, one of which this post is about, are NOT based on “settled science.” They’re based on constantly changing guesses, but they’re claimed to have an effect totaling 300-600% more than that of CO2. Even if your “settled science” is entirely correct, there’s 100% agreement (not 97%) in the scientific community that CO2 doesn’t have nearly enough effect, by itself, to cause the predicted changes.
Your entire argument is based on those completely hypothetical feedbacks. But you waive your hands, point to CO2, and scream, “SETTLED SCIENCE!” This proves it. You’re not just a misinformed pawn. You’re a politically motivated liar.
MS aka WS, why don’t you research your statements so that you don’t make so many obvious errors? And please quit lying.
On aerosols, they can have either warming or cooling effects depending on the type of aerosols, where and how they are emitted. ” The researchers found that the mid and high latitudes are especially responsive to changes in the level of aerosols. Indeed, the model suggests aerosols likely account for 45 percent or more of the warming that has occurred in the Arctic during the last three decades. The results were published in the April issue of Nature Geoscience.” http://www.nasa.gov/topics/earth/features/warming_aerosols.html
Heat seeking missiles rely on the detection of IR emissions against a cooler background, global warming hypothesis is quite different, warming of entire background from IR absorption followed by IR emission.
“you are deliberately ignoring the positive feedbacks.”
List them all…… and all the negative feedbacks
You are a brainless ignorant twit, goreboy, and getting more and more ignorant by each post.
“warming of entire background from IR absorption followed by IR emission.”
And its been shown that CO2 does not emit in the troposphere.
http://s19.postimg.org/6bv57dpo3/stratospheric_cooling.jpg
but….
it [CO2] does emit outwards (cooling)
e.g
various investigations into the earthshine spectrum
via the moon
The Earthshine spectrum, from 0.3 to 2.5 microns, is presented and used to illustrate the spatially unresolved spectrum of a planet with abundant water and life. Water vapor, oxygen, ozone, methane, and carbon dioxide are unambiguously detected, while the vegetation signature is less certain. Chapter 6 explores possibilities for extending the earthshine work and submits recommendations for improving the TPF database content and etc
——-The CO2 hypothesis is much older than the aerosol one, and it’s basis in physics has been well understood for over a century, I think.——-
You?? ……… think?
The emissivity of Gas’s drops as a function of a fourth power temp increase…. Stefans Law …. NOT Universal as claimed by “basic” Physics . Thanks though for your contributions to SG’s Happy Hour , more fun poking trolls than feeding them 🙂
“In fact, heat seeking missile technology is based on it, so it definitely is settled.”
Let’s see what the CO2 laser guys say about it shall we……
http://lasersparkpluginc.com/uploads/CO2_Absorption_Data.pdf
And then remember that CO2 does not re-emit below about 15km
http://s19.postimg.org/6bv57dpo3/stratospheric_cooling.jpg
That is because that tiny absorption in the lower atmosphere is immediately passed to the other 99.96% of the atmosphere and dealt with as any other energy, by conduction and convection and changes in radiation frequency.
And we KNOW from direct measurement that the LWOR has increased as the Earth has warmed from the series of strong solar cycles in the latter half of last century.
THERE IS NO PHYSICAL MECHANISM THAT ALLOWS CO2 TO TRAP HEAT IN THE ATMOSPHERE.
Martin Smith says:
“pinroot, you wouldn’t have to guess what I am saying if you just investigate the physics we are talking about. The physics of the greenhouse effect are settled science. “
Utter bollocks.
You haven’t the first idea, you scientifically illiterate little buffoon.
Do you get some sort of perverse kick about being an object of ridicule?
Have you considered seeking psychiatric assistance?
catweazle666 : has Martin considered seeking psychiatric assistance? Obviously not!
A wrong sense of reality & not realizing it from ridicule; indicates a form of psychosis.
I don’t believe Martin is a Troll either ; he honestly believes his own nonsense…
Marsh says: “I don’t believe Martin is a Troll either ; he honestly believes his own nonsense…”
Oh dear!
Clearly, it’s worse than we thought™!
Steven, for crying out loud. You claim the study said “The NOAA study said quite explicitly that there was no long term increase in particulates and that they were not responsible for the trend,” but you did not prove that. You posted a newspaper article in which a scientist claims there was no increase in aerosols. Nowhere does anyone claim that aerosols don’t have a cooling effect. If “the study” proved aerosols… wait… WHAT TREND? The news article talks about an unusually cold winter in the easter US. NO TREND.
You have been caught out again. Your blog post is wrong.
Martin-
YOU STUPID, F**KING IMBECILE.
No change in particulate levels means their effect is stable. Flat line. NO TREND. They can’t possibly be masking any more of this mythical warming today than they did 40 years ago. Your excuses are as full of shit as you are.
Ted, Martin is saying that global temperatures are so sensitive to particulates……that we should be in an ice age any minute
CO2 levels have increased….particulate levels are stable
Then obviously CO2 effects are very weak….compared to particulates
….according to Martin 😉
Ted, I guess you are holding back but one day you’ll tell us what you really think of him.
Martin-
Sorry. I lose my temper on occasion, because you refuse to discuss actual science, while calling anyone who does a liar. I apologize for my language, but I stand by the sentiment.
Yet more evidence you never even bother to read the posts you comment on, you just spout complete mendacious tripe in the hope that someone as scientifically illiterate as you are will believe your BS.
You are a complete moron, Smith.
Oops, I must apologise for that post.
I entirely overlooked the feelings of complete morons, who would justifiably feel deeply offended by being likened to MS.
The problem with peddling a scam/hoax like the CatastrophicAGW-by-CO2 religion is that eventually the chickens come home to roost and reality exposes the scam/hoax/fraud for what it is. The reality-denying global warming fraudsters get all tangled up in their lies, desperately trying to keep the scam alive.
The climate alarmists dismissed the most significant ghg, water vapor, as being a significant factor that controls global temperature because they said it was was very short-lived, condensed/precipitated out of the atmosphere.
Well, they also said: “Most aerosols from anthropogenic sources are found in the lower troposphere (below 2km). Aerosols undergo chemical and physical transformations in the atmosphere, especially within clouds, and are removed largely by precipitation. Consequently aerosols in the lower troposphere typically have residence times of a few days.” – IPCC, SAR, WG1, p.20
So that means they have no long term impact like aerosols from major volcanoes which reach the stratosphere and remain for up to a couple years because they don’t precipitate out.
Marvel/Schmidt are merely making another ‘dog-ate-my-homework’ excuse to deny the reality that global temperatures haven’t been rising because their ‘CO2-is-the-Earth’s-thermostat’ hypothesis is false as it has failed the real world test. In the last ~19 years humans have added more CO2 to the atmosphere than any other 19 year period in history, 570 billion tons worth, which is 1/3 of all the human CO2 added to the atmosphere since 1750, and it has caused no increase in the temperature of the atmosphere. http://www.woodfortrees.org/plot/rss/from:1997.2/to:2015.95/plot/rss/from:1997.2/to:2015.95/trend
Real, get real. We are now in the warmest year in recorded history, and 14 of the 15 hottest years have occurred since the year 2000. It is now 2015.
Yes that’s true. And next year will be even warmer, but only until Schmidt is fired in January 2017 and the new staff at GISS reverts all the data to the actual data, and we find out again that 1934 was the warmest year all along.
That’s real dumb, Morgan. Real dumb.
Sorry Martin, but CAGW theory say the global troposphere is supposed to warm at 1.2 times the surface rate. The tropical troposphere is suppose to warm even faster.
Neither has happened. CAGW is failed. The ajustments are wrong.
Even if an imbecil assumes that hundreds of billions of political funds do not corrupt, and the adjustments are perfect, then CO2 has ZERO to do with the surface warming!
I feel for you Martin. You may have to let go of something you very clearly hold close to your heart.
mpcraig, you make an important point. The average CAGW enthusiast does not get thoughtful when contradicted; he gets angry. Though I will say, that Martin Smith has, for the most part, been polite — even more polite than many of the responding sceptics. Maddening, yes, I would even say highly illogical, but mostly polite, and for that I think he deserves some credit. Still, my experience with most CAGW supporters is that they get angry. This leads me to think that they have an emotional attachment to the belief, more-so than rational. My unverified opinion is that the CAGW anger is used to mask some more personal issue for them. Maybe an unhappy marriage, maybe a job that is unfulfilling, maybe a dying parent — the issues are personal and varied. What CAGW does is to give them a good reason to feel anger without having to face what is actually bothering them. Take away their CAGW and they will have to face their own personal issues.
Jason ; I agree with your psycho analysis of most CAGW followers. There appears to be some substitution that masks their own “personal dramas” in life. These people can present, not unlike religious extremists ; beyond logic or any rational argument.
……………….
We know, Martin is not in the substitution guise… but did you notice that many of the responses are robotic? Most of those that are on the spectrum, are intelligent but with a low emotional IQ ; they are also prone to miss the nuances in a debate & get the translations wrong… all the evidence is there.
……………….
Yeah, they can be maddening & polite at the same time ; interesting world it is…
Hey Marsh, that robotic quality is something that I find creepy at times. I have actually wondered whether at least some of the CAGW supporters are just bots. Not all the responses, but certainly some of them have that same feel that the old Eliza psychologist program had way back when; almost huamn but not really sentient, not actually thinking. It is odd.
Jason, there are bots and sockpuppets.
I do not have the links handy.
Yes Gail, there are bots and sockpuppets but of course, there is a third group that have strings attached and with long noses…
Marsh,
you forgot the pockets full of blood money.
“We are now in the warmest year in recorded history”
Wrong. They are not comparing to recorded temperatures, but corrupt-by-adjustment fake numbers.
The satellites show that 1998, 2002, 2003, 2005, 2010 were all hotter than the last full year of data we have in 2014. And 2015 will be no more than the 3rd highest: http://www.drroyspencer.com/2014/10/why-2014-wont-be-the-warmest-year-on-record/
That’s real dumb, Real. Real dumb. Get real, Real.
Martin-
Do you have any evidence proving that the satellite measurements are wrong? We have increasingly divergent data sets. In science, that’s generally considered a serious problem. Why do you feel that it not only doesn’t warrant an explanation, but anyone noticing it deserves to be mocked?
Yes Martin.. you are REALLY REALLY DUMB
The data from ROO2 is totally correct.
Gees, even you could access RSS data (from a group of warmista who have remained scientists) and calculate the values.. IF you had the capability.. as if !!
Here are the RSS average yearly anomalies on degrees C.
1998 — 0.550
2010 — 0.469
2005 — 0.330
2003 — 0.320
2002 — 0.315
2014 — 0.255
2015 will almost certainly slot into 3rd place, could be 4th, but 2nd is not possible.
Even the El Ninos are have less effect each time, it seems.
So AGAIN you have proven your ABJECT FEAR of accepting any REAL DATA.
Speaking of El Ninos, the current one may be starting to collapse earlier than expected
http://notrickszone.com/2015/12/21/the-super-collapsing-el-nino-ncep-cfsv2-n-hemisphere-temps-plummet-1c-in-a-single-week/#sthash.93klHPFt.dpbs
And if we combine RSS and UAH, this is how things will pan out (deg C anomaly)
1998 — 0.516
2010 — 0.405
2015 — 0.296 **
2005 — 0.265
2002 — 0.264
2003 — 0.252
2014 — 0.220
2007 — 0.207
2001 — 0.181
2013 — 0.178
** 2015 value is average as end of November. It will change slightly
It cannot jump above 2010, and is highly unlikely to drop below 2005, 2002
What happens next year will depend on what happens with the current El Nino.
If it drops off soon, 2016 will be somewhere down the bottom or off the list, like 1999, and 2011
If it hangs around, 2016 could be somewhere towards the top.
Marty the Gorebot again proves he twists the English language. A favorite technique in Progressive Propaganda.
RECORD
Bureau of Meteorology officials, meanwhile, told Senate estimates on Monday that Australia was on a clear warming path, with temperatures rising between 0.71 and 0.76 degrees since 1960, depending on the methods used.
Threat of air pollution to worsen along with global warming, warns Climate Council
http://www.smh.com.au/environment/climate-change/threat-of-air-pollution-to-worsen-along-with-global-warming-warns-climate-council-20141020-118u3k.html
Melbourne changes monitoring site from city to park, new max temperature averages 1.2C cooler
http://www.theage.com.au/victoria/melbourne-weather-summer-2015-still-hot-just-last-year-was-hotter-20150119-12tbhi.html
and 14 of the 15 hottest years have occurred since the year 2000. It is now 2015.
====
Which makes perfect sense when you realize temps have been stable for the past ~2 decades………might as well claim the past 20 years as the hottest in recorded history
Not even close. The Medieval Warm Period was warmer than the past 20 years, and the Roman WP was much warmer than that.
talking 14-20 years here….
And way less than the optimum of the first 3/4 of the Holocene
http://wattsupwiththat.com/2015/12/21/the-holocene-thermal-optimum/
We are very much at the COLD end of the current interglacial, not that much above the coldest period of the last 10,000 years.
It’s amazing how many new records you can set when you continually increase the amount you “adjust” the data.
Martian I am now 5’10” tall have been since I was 17 years old so I have been the tallest I will ever get for 39 years your point is ???????
But the trend is up. You’re taller today than you were when you were born. Therefore, if we linearly interpolate your height out another 56 years, you’ll be somewhere around 10 feet tall. You’re just in a “pause” right now. Start buying those 61″ inseam pants right now, before the rush. With most of the world currently experiencing a similar pause, the growth already in the pipeline is astronomical. By 2100, everyone will be 10 feet tall. It’ll be the new normal.
I’m about the same age and height. Not only are the last 40 years the tallest I’ve ever been, according to the long term trend I’ll be 7’7″ at age 80. Hoping to keep my knees in good shape and supplement my SS check with basketball.
Lorne & Ted the correct GISS method / scenario on record height is to 1st – get a pair of KISS band platform boots. 2nd – measure yourself. 3rd – claim your height is still going up.
Your not really, but do appear that way on MTV.
Indeed, I have noticed I am getting taller then my hair.
When you start from the coldest period in the whole 10,000 of the current interglacial, you should be darn thankful of the small amount of warming we have had.
The LIA was bleak and full of pestilence.
This is where Martin comes from, and he has adopted that character.
You all seem very giddy about your growth but nobody mentioned the alarming relationship to rising CO2 concentrations. Not only does the trend show your growth will resume after the hiatus but it is obviously caused by anthropogenic CO2. As you get bigger you will emit even more CO2 and I’m afraid you will reach a tipping point when you start growing out of control. It’s a frightening thought.
I’m 5′ 11 and 1/2″ tall. Down from the touch over 6′ I was 15 years ago. Age, years of heavy rucksacks and stuff like that does make a difference. Gravity is forever. Since I have been declining in height with age as most folks do once they pass middle age, the trend line would slope down from some point 15 to 20 years ago. An offensive lineman in the NFL will lose on average 1/4″ of height during a season. They regain it in the off season and their cartilage decompresses from the repeated heavy impacts.
Sighhhh, I have lost a full two inches in height. 5ft 6 to 5 ft 4
Only in the massively CORRUPTED and FABRICATED junk from NOAA and its stable.
But you know that… Its one of the MANY LIES you continue to hang onto.
2015 cannot be more than 3rd warmest in the short term record, and is far colder than the MWP, RWP and far far colder than the first 3/4 of the current interglacial
http://wattsupwiththat.com/2015/12/21/the-holocene-thermal-optimum/
If we had any uncorrupted data left, the late 1930’s would also be warmer.
Prof. Phil Jones, Leader of CRU East Anglia stated in an interview in 2010 that there has been no statistically significant increase in average global temperature since 1997.
How does that square with “14 of the 15 hottest years have occurred since the year 2000. It is now 2015.”…?
Following my various investigations, I have never excluded the possibility that the net effect of more CO2 in the air is that of cooling rather than warming. The problem is that, as far as I know, nobody has actually done a large scale experiment to determine the net effect…..
Namely, like H2O, absorption by CO2 in the 4-5 um range is very high.
So as we stand in the hot sun, a lot of the hot IR is being back radiated to space by the CO2 in the air.
I actually tested the effect of high humidity/ (note: no clouds)
you will find that as the humidity in the air goes up, the heat effected by the sun on a standard metal plate for a certain time at a particular time of day is lower.
Go figure. [more] CO2 does the same as [more] humidity.
So, who says the net effect of more CO2 is that of warming?
Luckily it appears from my results that there is no man made warming:
https://i0.wp.com/oi62.tinypic.com/33kd6k2.jpg
or man made cooling.
The sun [God] rules everything.
Just so you know/
HenryP, Sleepalot looked at the same thing a different way and I took the idea further.
This data is from May (2012)
Barcelos, Brazil
….monthly min 20C, monthly max 33C, monthly average 26C
Average humidity 90%
Adrar, Algeria
…..monthly min 9C monthly max 44C, monthly average 30C
Average humidity around 0%
The effect of the addition of water vapor (~ 4%) is not to raise the temperature but to even the temperature out. The monthly high is 10C lower and the monthly low is ~ 10C higher when the GHG H2O is added to the atmosphere in this example. The average temperature is about 4C lower in Brazil despite the fact Algeria is further north above the tropic of Cancer. Some of the difference is from the effect of clouds/albedo but the dramatic effect on the temperature extremes is also from the humidity.
I took a rough look at the data from Brazil. Twelve days were sunny. I had to toss the data for two days because it was bogus. The average humidity was 80% for those ten days. The high was 32 with a range of 1.7C and the low was 22.7C with a range of 2.8C. Given the small range in values over the month the data is probably a pretty good estimate for the effects of humidity only.
You still get the day-night variation of ~ 10C with a high humidity vs a day-night variation of 35C without and the average temp is STILL going to be lower when the humidity is high and the effect of clouds is removed.
DATA from: classic(DOT)wunderground.com/history/station/82113/2012/5/22/MonthlyHistory.html
This data would indicate GHGs have two effects. One is to even out the temperature and the second is to act as a “coolant” at least if the GHG is H2O, the most significant GHG.
The latent heat of evaporation could be why the average is 4C lower when in Brazil vs Algeria. As one commenter mentioned, using temperature without humidity to estimate the global heat content is just plain bad physics. Also Barcelos is much near the ocean than Adrar so there may be a ‘Lake effect’ with the large body of water moderating the temperature.
apollo(DOT)lsc.vsc.edu/classes/met130/notes/chapter2/lat_heat2.html
ALTITUDE:
Barcelos, Brazil elevation ~ 30 meters (100 ft)
Adrar, Algeria ~ Elevation: 280 metres (920 feet)
One would expect a drop in temperature of ~ 4C due to altitude for Adrar, Algeria so the difference between locations, taking into account altitude is ~ 8C higher in Adrar which is further north but with much lower humidity. – (wwwDOT)engineeringtoolbox.com/air-altitude-temperature-d_461.html
Hi Gail
very interesting comment
let me think a bit more about this
I am busy preparing the food now
[and you know what that means]
Yes, Burnt eggplant Lasagna. Luckily it was eatable but I have to clean the oven.
RACookPE1978 was kind enough to
So lets add Solar energy into the picture.
Barcelos – 0.9750° S, “Direct Radiation Horizontal Surface” @ noon for 0S= 1150 watts/meter^2
Adrar – 27.8667° N, “Direct Radiation Horizontal Surface” @ noon for 30S= 970 watts/meter^2
Adrar, Algeria for September 2012:
monthly min 24C, monthly max 40C, monthly average 33C
Average humidity 22% (Humidity increased through the month)
classic(dot)wunderground.com/history/airport/DAUA/2012/9/29/MonthlyHistory.html
Barcelos, Brazil for September 2012:
monthly min 22C, monthly max 33C, monthly average 26C
Average humidity 81%
classicDot)wunderground.com/history/station/82113/2012/9/29/MonthlyHistory.html
There were 11 sunny days in
Barcelos…………… Adrar
min 22 °C………… min 24°C
max 34 °C……………max 40 °C
Avg 29 °C…………… Avg 33 °C
humidity 76%……….. 22 %
So Barcelos, with 180 watts/meter^2 extra solar energy is still ‘cooler’ than Adar by the same 4 °C.
I wonder just how much of the GHG effect is actually the effect of latent heat of evaporation or sublimation?
W/V alone, clear sky prevents close to 30 percent of insolation from reading the surface.
David
please elaborate
you mean the opposite?
Henry P
Water vapor grabs energy coming in from the sun and leaving earth because it has a lot more absorption bands compared to the other gases.
http://www.globalwarmingart.com/images/7/7c/Atmospheric_Transmission.png
What is really funny is thanks to the energy bound in the heat of vaporization, if the water vapor goes up, as demanded by the CO2 global warming conjecture, the world temperature should actually be go DOWN!!!! (And the deserts should be contracting as shown by reconstructions.)
Africa under full glacial conditions (COLD) was over half desert or semi-desert:
http://www.esd.ornl.gov/projects/qen/afr(22-.gif
During the Holocene when the temperature was higher than today Africa was wetter and the deserts shrank. .
8,000-7,000 14C y.a. (about 9,000-8,000 ‘real’ years ago).
http://www.esd.ornl.gov/projects/qen/afr(9ky.gif
At that time it was about 2C warmer in Greenland than it is today. 9,000-8,000 ‘real’ years ago is the first temp increase at the beginning of the graph.
http://jonova.s3.amazonaws.com/graphs/lappi/gisp-last-10000-new.png
So much for ‘CAGW’ causing droughts. All it would do is shift the monsoons across the Sahara region, the Arabian Peninsula, India and China but the net effect is warmer = more evaporation = more rain.
Hi Gail
Actually, I figure that a large part of the current global cooling is caused/enhanced by increased clouds and clouds formation at the lower latitudes.
As the temperature differential between the poles and equator grows larger due to the cooling from the top, very likely something will also change on earth. Predictably, there would be a small (?) shift of cloud formation and precipitation, more towards the equator, on average. At the equator insolation is 684 W/m2 whereas on average it is 342 W/m2. So, if there are more clouds in and around the equator, this will amplify the cooling effect due to less direct natural insolation of earth (clouds deflect a lot of radiation). Furthermore, in a cooling world there is more likely less moisture in the air, but even assuming equal amounts of water vapour available in the air, a lesser amount of clouds and precipitation will be available for spreading to higher latitudes. So, a natural consequence of global cooling is that at the higher latitudes it will become cooler and/or drier. .
All of that because since 1995 the sun is getting hotter i.e. brighter [less spots] i.e less solar polar magnetic field strength i.e more of the most energetic particles released, i.e. more ozone, more N-oxides, more peroxides formed TOA, i.e. more UV, A + B, deflected off from earth.
Note that I [had] said in my comment: “I actually tested the effect of high humidity/ (note: no clouds)”.
You can do this experiment for yourself.
It is important to note that I was testing the effect of the H2O gas, not the effect of H2O liquid (e.g. clouds)
[as there is no “cloud” stage with CO2 – or is there? perhaps bonded to H2O?]
–
By choosing certain places on earth and adding in clouds and cloud formation you are changing the whole scenario. Obviously you cannot compare a desert area with no clouds with an area in the tropics that has a lot of clouds.
Interestingly enough, I have noted that minima increased considerably in Las Vegas, over the past 4 decades, where they turned a desert into an oasis. In Tandil, Argentine, where they chopped all the trees, minima dropped considerably.
So what does that tell you?
The increased crops and the increased greening of earth causes….?
AGW?
“[as there is no “cloud” stage with CO2 – or is there? perhaps bonded to H2O?]”
Actually CO2 loves water, the colder the better. Caves are formed by H2O + CO2 –> H2CO3 (carbonic acid)
The weak acid reacts with limestone (or marble)
CaCO3 + H2CO3 –> Ca+2 + 2(HCO3-) (calcium bicarbonate solution)
That is a major way that CO2 high in the troposphere gets washed back to earth and recycled.
[at least some?] AGW
but not measurable if you look at a large sample
I figure the Sun (variability plus Milankovitch cycle) plus water (oceans, snow, water vapor rain) with a healthy push from the moon explains most of our weather/climate.
Another interesting idea was Willis’s The Thunderstorm Thermostat Hypothesis (It ended up as a peer-reviewed paper and not just a blog post)
based on that I did a quicky look at afternoon rain along the east coast (USA) in the summer.
Florida had about 20 -25 days of rain per month. Georgia, South Carolina and southern North Carolina had 20 days of rain per month. In the middle of North Carolina – between Fayetteville and Sanford east to Rocky Mount a distance of fifty miles further north, the number of rain days changed from 20/month to 10/month.
The Sanford area to Rocky Mount is also the present “snowline” It snows regularly further north such as Raleigh or Durham and rarely further south.
At some stage I did check the composition of rain water because it was important to me to know. I found out that the quality of rainwater was better than that of pure de-ionsed water because of the absence of Silica.
I remember, on average the conductivity of rainwater was about 40 uS.
I cannot remember now exactly, but I am pretty sure that Calcium was one of the main components.
“The increased crops and the increased greening of earth causes….?
AGW?”
It would make as much sense as CO2 causing warming. Irrigating a desert, for example the Columbia Basin of Washington, adds water to the atmosphere and that should result in warming it. I can’t see any reason to believe irrigation wouldn’t have a significantly larger impact on global temperature when compared with CO2, given it’s ability to absorb in multiple spectra?
Good point I think?
Sorry
my last comment was incoherent as calcium is not relevant to the discussion
I remember now that I could not do the anions in the rainwater, at that lab.
[the silica question is relevant to the final stage of the Al.anodising process]
ok
the silica was in anion form but you could pick it up with AAS.
The last newspaper article extracted for this post starts of with “Measurements taken…”. I could have sworn it read “Measurements faken….”
The Paris accord was signed just in time to save the global warming advocates.
In a study released in July by Valentina Aharkova shows that the sun is going into a hibernation mode and by the year 2020 earth will start to see the effects of this shut down.
http://www.nationmultimedia.com/opinion/Cold-sun-rising-30272650.html
The parties who signed the Paris accord will proclaim victory for their way of thinking and want even more power to regulate things because they will claim they were proven right and have lowered the temperature of the earth, even though they will have done no such thing.
Unfortunately they will have GOTTEN the power. Worse they will have essentially ended US sovereignty if the Trans-Pacific Partnership trade agreement is ratified. Obama signed it but final ratification from Congress is next year.
>>>>>>>>>>>>>>>>>>>>>>>>>>>>
STEVEN NOTE this take on the Trojan Horse Trade Treaty by Ted Cruz. First he voted for fast-track, then he voted against and then after an article opposing in Breitbart, Cruz spokesman Rick Tyler told us, “Sen. Cruz remains a strong supporter of free trade and fast-track.” I sure wonder where his heart actually is on this given his wife is a member of the CFR and a VP for Goldman Sachs. http://www.cfr.org/trade/case-ttip/p36616
>>>>>>>>>>>>>>>>>>>>>>>>>>>
E. M. Smith has a good essay on that aspect. Paris, COP21, Obama Declares Victory, the TPP Likely Gives It To Him.
I also looked at different aspects of this Trojan Horse trade deal. I found a Synopsis FROM THE US GOVERNMENT
It had this nasty surprise:
THE TEETH!
Unlike some other treaties the TPP has enforcement. Worse, as can be seen if you read between the lines it has ENFORCEMENT FOR OTHER TREATIES! The Groniad says this about the Trans-Pacific Partnership trade agreement:
Back to the US Government synopsis we find:
TPP is just as bad on immigration. It sets up an EU open border type policy.
From The Hill by former Bill Clinton advisor Dick Morris
I really hate sleazy traitorous bought and paid for politicians who have zero problem killing off or enslaving their own people.
Gail, this is probably the most depressing thing I’ve read all year. Not kidding either. I’m sort of sorry I dropped in to read it.
Ding Ding Ding… We have a winner.
The adjustments are getting out of hand. They’ve adjusted this apparently minor El Nino into the biggest, nastiest, deadliest monster ever to lurk the Pacific, but the weather isn’t cooperating. They’ve adjusted high latitude temperatures to the point of melting both ice caps, but the ice isn’t cooperating. They got lucky with a warm summer for the eastern US. That’ll let them continue to pretend for another year or two. But at some point in the fairly near future, too many people will have noticed that the predictions haven’t panned out. The poles still have ice, the ski slopes are still open, and the crops haven’t failed. The runaway adjustments leading up to this conference strongly suggest that it was planned from the start as the one that would save us all. Over the next 10 years, or so, they’ll ramp down the adjustments, both current and past, and claim victory. But mostly, they’ll just stop talking about it, in the hope that no one digs too deeply into the details.
This appears to be another attempt to find an excuse for the “the pause” in warming. NASA is saying that they’ve figured out that Chinese (mainly, I presume) power plants have put so much particulate matter into the air that it’s offset the warming effect of CO2.
But they’re also saying that because the particulates wash out in fairly short order, and CO2 levels are expected to stay high much longer, we should expect the cooling effect of the particulates to be short term, and the warming effect of the CO2 to be long term. I.e., “It’s Worse Than We Thought.”™
However, there are at least two problems with that theory.
The first, which “CMS” on WUWT pointed out, is that China is in the northern hemisphere, and the cooling is happening in the southern hemisphere.
The other, which you pointed out, is that in the 1960s and 1970s we were told that we had to clean up our particulate emissions for exactly that reason: because they were cooling the planet. We were in danger of entering another ice age, said many scientists, because of air pollution, mostly from power plants. So we put scrubbers on the power plants, and cleaned up the emissions (at great expense).
Sure enough, the climate got warmer through the 1980s and 1990s. But these days we’re told that warming was because of GHG increases (mainly CO2), rather than particulate reduction.
However, if the effect of particulates has been underestimated, so that “the pause” in warming is due to particulates, that would also suggest that more of the warming which preceded the pause was actually due to the reduction in particulates. I.e., it suggests that the warming effect of CO2 is overestimated, rather than underestimated.
A paper last year by MIT’s Ben Santor (with many co-authors, including NASA’s Gavin Schmidt) did an interesting exercise. They tried to “subtract out” the effects of ENSO (El Niño / La Niña) and the Pinatubo (1991) and El Chichón (1982) volcanic aerosols from measured (satellite) temperature data, to find the underlying temperature trends. Here’s their paper:
http://dspace.mit.edu/handle/1721.1/89054
This graph is from his paper (here’s a bigger version):
http://www.sealevel.info/Santor_2014-02_fig2_graphC_50pct.jpg
Two things stand out:
1. The models run hot. The CMIP5 models (the black line) show a lot more warming than the satellites. The models show about 0.65°C warming over the 35-year period, and the satellites show about half that. And,
2. The “pause” is over two decades long. The measured warming is all in the first 14 years. Their 3rd graph (with corrections to compensate for both ENSO and volcanic forcings) shows no noticeable warming in the last 21 years.
Note, too, that although the Santor graph still shows an average of almost 0.1°C/decade of warming, that’s partially because it starts in 1979. The late 1970s were the frigid end of an extended cooling period in the northern hemisphere. Here’s a graph of U.S. temperatures, from a 1999 Hansen/NASA paper:
http://www.sealevel.info/fig1x_1999_highres_fig6_from_paper4_27pct_1979circled.png
“The “pause” is over two decades long. The measured warming is all in the first 14 years.”
You just don’t get it. 20 years is weather. 14 years is climate.
http://4.bp.blogspot.com/-v4833RhLE_E/Tw22kabjfSI/AAAAAAAACSE/BuGRpVFctFQ/s1600/ROTFLMAO%255B1%255D.jpg
I am actually not sure what this abbreviation stands for, exactly
anyone
please enlighten me
Roll on (the) Floor (and) Laugh My Freaking Ass Off
@wizzum
thx
I know about laughing until your stomach hurts
Perhaps going down on the floor will prevent this?
Sorry, Henry, your stomach will hurt all the same. Rolling on the floor is an OSHA recommended position to prevent further injuries caused by falling.
OK, I got it.
I know something about the OSHA ct
too,
And there are of course many slight variations on the theme, which you often have to try to figure out via context. 🙂
Martin Smith says: “…wizz, you are deliberately ignoring the positive feedbacks….”
>>>>>>>>>>>>>>>>>>>>>>>
No, it is Mother Nature is ignoring the positive feedbacks.
The conjecture: Water Vapor Feedback
The actual response by the earth.
Peer-reviewed paper Trends in middle- and upper-level tropospheric humidity
from NCEP reanalysis data
Variations in the total column water vapour in the atmosphere since July 1983.
http://www.climate4you.com/images/TotalColumnWaterVapourDifferentAltitudesObservationsSince1983.gif
Relative Humidity
http://www.climate4you.com/images/NOAA%20ESRL%20AtmospericRelativeHumidity%20GlobalMonthlyTempSince1948%20With37monthRunningAverage.gif
Scatter diagram showing the total monthly global cloud cover plotted versus the monthly global surface air temperature, since July 1983. As the temperature goes up the cloud cover goes down.
http://www.climate4you.com/images/TotalCloudCoverVersusGlobalSurfaceAirTemperature.gif
Monthly variations in total global cloud cover since July 1983
http://www.climate4you.com/images/CloudCoverTotalObservationsSince1983.gif
Mother Nature WINS AGAIN!
water vapor feedback….was supposed to be the strongest feedback…and what was supposed to drive global warming
it ain’t happening
Yes.
Water vapor feed back was supposed to triple the effect of CO2 and make it a major player in the climate. As my above comment shows. The ClimAstrologists were wrong. CO2 is a wimp and at the end of its ‘strength’
https://i0.wp.com/joannenova.com.au/globalwarming/graphs/log-co2/log-graph-lindzen-choi-web.gif
and if people would stick to that one point…..run away global humidity…..fail
because without run away global humidity…there is no global warming theory
….global warming theory would be over
I ran some numbers through the U.Chicago’s online MODTRAN interface, and for a tropical atmosphere with cumulus 0.66km-2.7km, and const rel humidity (to account for water vapor feedback/amplification) a doubling of CO2 (from 285 to 570) was calculated to result in just 0.81°C of warming.
I also compared constant H2O pressure (i.e., not taking account of water vapor amplification) to constant relative humidity (i.e., with water vapor amplification). For a clear sky it calculated 0.88°C vs. 0.96°C of warming. I.e., water vapor feedback amplified warming by only 8%.
The same exercise done with an earlier version of U.Chicago’s MODTRAN interface showed 65% amplification. I cannot account for the change.
But, either way, it’s obviously inconsistent with the Yale Climate Connections / IPCC numbers. Even +65% is much less amplification than the IPCC assumes.
Of course, MODTRAN is just a radiation model. It takes no account of any other feedbacks, positive or negative, besides water vapor amplification. Also, although the tropics get a disproportionate amount of sunlight, so that’s where GHGs matter the most, it is still true that farther from the equator sensitivity should be slightly higher, because the air is dryer, so water vapor amplification should increase. That should increase the globally averaged amplification a little bit, over what MODTRAN tropical atmosphere calculates.
Even so, 2x or 3x (+100% or +200%) amplification from water vapor seems way, way too high.
W/V alone, clear sky prevents close to 30 percent of insolation from reading the surface.Despite dozens of references to peer reviewed CAGW skeptical sciences, Martin S closes his eyes and ignores this entirely, mumbling something about the wrong peer and the wrong chart, and calls skeptics stupid.
Those are surprising graphs. Does anyone have any idea why water vapor (especially) and clouds seem to be going the “wrong” way, Gail?
Essays Humidity is still Wet and Cloudy Clouds explore this. Most likely explanation is improper model parameterization concerning convective cells (thunderstorms). There are two related mechanisms. Eschenbach has shown using CERES and the Pacific TAO buoy system that warmer causes more and larger afternoon Tstorms. Lindzens adaptive infrared iris idea (BAMS 2001) says that results in less high troposphere moisture detrainment so less cirrus. Cirrus warms because the ice crystals are transparent to SW but opaque to long wave (IR). Less detrainment, less cirrus in a ‘dryer’ sky, less warming. The related mechanism is simply more precipitation, which removes water vapor AND where condensation releases the latent heat of evaporation high in the troposphere, above more ofmthe GHG ‘blanket’ where it has a higher probability of scattering to space.
The second mechanism says the water vapor feedback is weaker than modeled. And a recent paper showed that when the adaptive iris (alone) is added to a climate model, the sensitivity drops half way to what is observationally estimated from energy budget approaches.
Nice summation.
Dave
Haven’t a clue. Cosmic rays, particulates as rain fall nuclei?
A few papers (as usual)
Space observations of cold-cloud phase change
…In particular, our results demonstrate that dust, by glaciating supercooled water, can decrease albedo, thus compensating for the increase in albedo due to the dust aerosols themselves. This has important implications for the determination of climate sensitivity.
Significant decreasing cloud cover during 1954–2005 due to more clear-sky days and less overcast days in China and its relation to aerosol
Does the Earth Have an Adaptive Infrared Iris?
reply: http://eaps.mit.edu/faculty/lindzen/reply.pdf
reply: http://www-eaps.mit.edu/faculty/lindzen/208_Re_to_Fu_etal.pdf
Cloud and radiation budget changes associated with tropical intraseasonal oscillations (This paper was originally at the American Geophysical Union site but like many skeptic papers I had bookmarked it was removed. This was the link: http://www.agu.org/pubs/crossref/2007/2007GL029698.shtml )
This is another paper removed by AGU
Observed variations in convective precipitation fraction and stratiform area with sea surface temperature
And so is this:
Apparent tropospheric response to MeV-GeV particle flux variations: A connection via electrofreezing of supercooled water in high-level clouds?
Variations of Total Cloudiness during Solar Cosmic Ray Events
Dave
Haven’t a clue. Cosmic rays, particulates as rain fall nuclei?
I don’t think anyone has a real clue yet just educated guesses. (So much for settled science)
A few papers (as usual)
Space observations of cold-cloud phase change
…In particular, our results demonstrate that dust, by glaciating supercooled water, can decrease albedo, thus compensating for the increase in albedo due to the dust aerosols themselves. This has important implications for the determination of climate sensitivity.
Significant decreasing cloud cover during 1954–2005 due to more clear-sky days and less overcast days in China and its relation to aerosol
Does the Earth Have an Adaptive Infrared Iris?
reply: http://eaps.mit.edu/faculty/lindzen/reply.pdf
reply: http://www-eaps.mit.edu/faculty/lindzen/208_Re_to_Fu_etal.pdf
Cloud and radiation budget changes associated with tropical intraseasonal oscillations (This paper was originally at the American Geophysical Union site but like many skeptic papers I had bookmarked it was removed. This was the link: http://www.agu.org/pubs/crossref/2007/2007GL029698.shtml )
This is another paper removed by AGU
Observed variations in convective precipitation fraction and stratiform area with sea surface temperature
And so is this:
Apparent tropospheric response to MeV-GeV particle flux variations: A connection via electrofreezing of supercooled water in high-level clouds?
Variations of Total Cloudiness during Solar Cosmic Ray Events
This paper you will have to google since it is Russian and gets the boot by WordUnimpressed.
Dave, There is also this chart. (2007)
https://wattsupwiththat.files.wordpress.com/2007/10/earth_albedo_bbso.png
Gail, TY. You were rather hard on my case (IMO erroneously) previously.
I do not often comment here because the science is beyond most and Tony makes some infrequent stats mistakes. But you knew of Paltridge’s paper. Bravo. BTW, there are several more recent others ignored by IPCC with the same WV findings. What you posted is not an outlier. Regards.
It’s inarguable that, under Obama, the US government has REVISED historical temperature data in a manner supporting the global warming (aka climate change) hypothesis. I am willing to entertain the govt’s assertion that these revisions are corrections: changes with a valid scientific basis instead of craven frauds driven by political expedience. But here’s a query for colleagues at the faculty “holiday” party: Assuming Trump or Cruz is elected president and, one year later, NASA officially reverts to 2005-2006 charts of historical temp data, will you cry politics? Will you scream “Fraud! Conspiracy!” or will you accept the “new” data as factual and revise your climate change ideas accordingly? Please be honest.
Not sure how to take a study who’s author is so clueless.
Kate Marvel, a climatologist at GISS and the paper’s lead author, said the results showed the “complexity” of estimating future global temperatures.
She said: “Take sulfate aerosols, which are created from burning fossil fuels and contribute to atmospheric cooling. “They are more or less confined to the northern hemisphere, where most of us live and emit pollution.
The island arc volcanoes in and around Indonesia have been permanently degassing for thousands of years, thereby contributing significantly to the total emissions of sulfur species in that region. The hot and wet tropical weather conditions with high solar irradiation and regular daily precipitation during the wet season lead to efficient removal of oxidised sulfate by wet deposition. This is accumulated in the Indonesian peat areas, which serve as natural sponges, soaking up rain during the wet season and slowly releasing moisture into the atmosphere during the dry season. When peat forests are drained for land clearing purposes, the peat quickly dries out and becomes extremely flammable. When ignited, the composition of the burning peat mainly determines the fire aerosol chemical composition and microphysical properties. In this paper we investigate the contribution of volcanic sulfur emissions to wet deposition of sulfur in Indonesian peat swamp areas based on numerical simulations carried out with a global atmospheric circulation model including the tropospheric sulfur cycle. Our study suggests that the observed hygroscopicity and elevated sulfur content of the Indonesian peat fire aerosols is due to accumulated volcanic sulfur.
https://www.mpimet.mpg.de/fileadmin/publikationen/Reports/max_scirep_342.pdf
Table 1: Mean fine aerosol (PM2.5) composition in ng/m3 at Palembang and Sriwijaya,
Sumatra (November 1997) and in midlatitude industrialized cities (Teplice, Czech Republic,
in 1993, Philadelphia, Pennsylvania, USA in 1994). The data is taken from Pinto and Grant, 1999
Palembang .. Sriwijaya .. Teplice.. Philadelphia
11,000……..6,900…….10,000…….3,300….. Sulfur
4,500……….4,600……….410………..26….. Chlorine
1,400……….1,500……….300………..60….. Potassium
Kate, the last time I looked peat was not considered “Fossilized”
Also peat has been burned by humans for centuries esp. in Scotland and Ireland.
My guess, since Indonesia is in the southern hemisphere, is she was attempting to illustrate the “complexities” of modeling sulfate particulates in a universe that assumes they’re mostly generated by industrialized nations of the N. hemisphere? If so, it only exposes a certain chauvinism in her thinking since there are industrialized nations such as almost all of South America, Australia, large portions of India and SE Asia that are also in the S. hemisphere, more or less giving lie to the assertion.
People who never visit Wyoming are of the impression the entire Northern Hemisphere looks like Philadelphia. I’ve seen this before.
WOW
Great stuff!!!!
Timeline…does post represent where post is placed?
As in last guys posted after 7PM here in Eastern Silly Time it is 3:19.0007
According to me smarter than GSD computer.
Have MIT brains & Yale Fails changed cloks for our betterment too/
Gruber Time new norm?
My guess is that the times are shown according to Greenwich Mean Time (GMT). People do post from all over the world.
Yes, it is GMT and posters from around the world.
Then there is Martin Smith who waits at all times for new Goddard posts and either says “your graph is wrong” or “your post is wrong”.
“says “your graph is wrong” or “your post is wrong”.”
And in every case, it is Martin that is wrong.
Easiest way to debunk this latest Gavin Nonsense nonscience masterpiece was half noted above. Emissions aerosols remain in the lower troposphere and wash out in a few days to weeks depending on weather. Most are produced in the NH; the short residence time means they do not reach the SH. Which means the NH should be warming LESS than the SH, since the SH doesn’t have anywhere near the NH level of ‘cooling’ aerosols. Except the NH is warming substantially MORE than SH according to both UAH and RSS. So this speculative excuse for the pause fails from first principles.
How did it ever get through peer review with such an obvious flaw?!? That question is rhetorical, since it only got through pal review.
My take: This paper makes their warming northern hemisphere temperature numbers look made up (which they are). Do they realize that they did this to themselves? LOL Their desperation is pathological.
Just FYI
https://www.washingtonpost.com/news/federal-eye/wp/2015/12/22/judicial-watch-sues-government-for-records-in-global-warming-dispute/
Don’t know if we will ever get anything meaningful from them about this …
I do like Judicial Watch. They turn up some interesting stuff.
http://www.judicialwatch.org/press-room/press-releases/judicial-watch-sues-for-documents-withheld-from-congress-in-new-climate-data-scandal/
With all this talk about global aerosols, volcanoes, dust…..
not one person brings up the big one……Saharan dust
http://cdn.tegna-tv.com/-mm-/bf36b4c6941ee8531d0aa6cc129086fad95ded7c/r=x404&c=534×401/http/www.gannett-cdn.com/-mm-/0e2bba7f9ee2a170a38bea7881710e66ea226eba/c=242-0-1678-1079/local/-/media/WXIA/WXIA/2014/07/01/1404264052000-nasa-sahara-atlantic701.jpg
L, a couple of observations. First, Sahara dust has rather poor albedo. Your image shows that nicely. Second, that dust is the major fertilizer of the Atlantic. Iron is a rate limiting ocean nutrient. Which means phytoplankton thrive, which means that dust increases the biological carbon sink. I would suspect carbon sink rather than albedo ‘wot done it’.
I wonder how much this dust, and other erosion, adds to the ocean floor each year?
.
Not a lot. De minimus, in any SLR frame of reference.
Ocean plankton suck up twice the carbon we thought they did
Marine phytoplankton create aerosols LIVE SCIENCE: Sea Creatures Make Brighter Clouds to Cool the Earth
Picture from the linked post
http://cdn.images.express.co.uk/img/dynamic/1/590x/secondary/China-Smog-419583.jpg
This image appears to show “eastern China being inundated by smog”. Notice how is seems to be covering the various river valleys. Wonder if they are mistaking cold weather fog and not smog. Not a very dense industrialization in the SW area.
So you guys don’t think that dust is cooling the Atlantic…
Aside from the reflective properties of the dust, you have the iron fertilization ===> more phytoplankton ===> create organic aerosols ===> more droplets in clouds ===> cooler earth.
Study: Tiny plankton play a big role in keeping the earth cool
Gail, you can keep up with how much dust we’re getting by monitoring our red tides..
…we do
Red tides are not just dust related. Much more subtle.
nope….red tides are a direct result of iron from dust
The misnamed Christian Science Monitor has an online quiz about climate change. On a whim I thought I might give it a try.
http://www.csmonitor.com/Environment/2014/0827/Climate-change-Is-your-opinion-informed-by-science-Take-our-quiz/Gas
After the third or fourth lie, I just couldn’t take it anymore. (Literally)
Yeah, I took it about a year ago. Knowing it was full of lies I managed to get 100% ‘correct.’ It is useful to know what lies the Propagandists are putting out.
It is really ashame about The Christian Science Monitor. It was one of two papers my newspaper owning Father-in-law respected. (The other was the Wall Street Journal)
The family is fifth generation newspaper men. Hubby’s great great grand dad probably knew Elijah Parish Lovejoy. Hubby’s great great grand dad was also a Presbyterian minister, journalist, newspaper editor and abolitionist in Alton, Illinois where Lovejoy was murdered. After the murder Hubby’s great great grand dad destroyed all his papers and letters and refused to speak of that time for fear of retaliation on his fellow abolitionists.
AGW is the magic theory. It does EVERYTHING.
Rising temps? AGW
Lowering temps? AGW
Increasing polar ice caps? AGW
Decreasing polar ice caps? AGW
Increasing sea ice? AGW
Decreasing sea ice? AGW
Too much rain? AGW
Too little rain? AGW
More hurricanes? AGW
Fewer hurricanes? AGW
Stronger hurricanes? AGW
Weaker hurricanes? AGW
The only thing it apparently can’t do is balance the budget.
That’s because our new Prime Minister here in Canada, Junior Trudeau, during the last election campaign several weeks ago said, “The budget will balance itself.”
Therefore, to my way of thinking, AGW is not applicable here!
What did Homer Simpson say about donuts doing everything?
I never watched The Simpsons. I’m barely aware of who they are.
Personally I don’t know, but I have heard that there is no food that can’t be improved by bacon, so I would guess Homer never tried bacon wrapped donuts?
I’ll turn that into a meme Kamas and post it in the social media forums ….love it 🙂
Steve, thanks for putting up with the continual drivel pouring out of Martin Smith. It is a good thing not to censor twerps like him as they do an effective job of looking like idiots for all the Warmistas. Thanks also for dredging up all those old and very embarrassing articles to lay on the Warmistas as a reminder of their past insanities, Lastly, Steve, have a very Merry Christmas and look forward to the New Year of Warmista demolition.
http://www.wunderground.com/news/christmas-week-forecast-warm-east
Notice the number of record highs compared to the number of record lows.
Jeff.. did you know that down here in Australia, October 2015 was significantly colder than October 1988 !!
WOW.. Global cooling !!!
Further more, In Australia, November 2015 was cooler than November 1990.
In fact, In Australia, November 1990 was the HOTTEST November in the satellite record.!
That’s like, 25 years ago !!!
That’s right AndyG55 : Remember there was heavy Snow Falls in Tasmania last month coming into the Australian Summer,,, many news outlets avoided this Warming contradiction, ahead of the Paris COP-21 CONference…
http://www.abc.net.au/news/2015-11-27/november-snow-fall-in-tasmania-just-days-ahead-of-summer/6979504
There seems to be more of a focus on high temperatures than the low temperatures experienced around the Country. It’s almost as though, they jump to reporting such Weather / Climate highs but bias & blind to the balance of many Cooling events..!
I heard that Tassie is in quite of a lot of trouble energy wise.
Their hydro dams are very low, and the Bass interlink is broken , and may take a month or two to repair.
They may have to RELY on the wind farms, (Oh-no !!!! ) if they don’t get some decent rain in the west.. !!!
They do have one old coal fired power station somewhere, but that will be very difficult, if impossible to bring back on line.
Jeff-
So you’re saying this month’s unusual warmth is proof of global warming, but the previous two winters, both as anomalously cold as this month has been warm, were just random weather fluctuations. Got it. It must be easy believe in global warming, when you can simply toss out any data that doesn’t fit the theory.
Jeff Masters (Wunderground) is a serial liar.
First the weather station near me is state of the art and went on line in April of 2001. Since we farm I usually have an Opera window open to the weather station. Over the years I notice that the temperatures for yesterday had changed. And even more interesting the data from the year before changed AGAIN.
Here are a couple of examples from last year (2014):
January 30 2014:
Min Temperature 1 °F 32 °F Record: 7 °F (1977)
That now is
Min Temperature 1 °F 37 °F
……
April 28 2014 5:35 AM 54.5 °F
That now is
Min Temperature 57 °F
…………
Max Temperature was 68 °F (Cold front with rainy weather came through)
That now is Max Temperature 81 °F
In other words there was NO GOOD REASON to adjust that 68 °F ===> 81 °F
This is what I had posted a year ago so I do not call Masters a liar without ample cause!
I have mentioned several times earlier that Wunderground (Jeff Masters) wiped out freezing temperatures and 4 to 6 inches of snow in my area that happened in the beginning of February 2013 and replaced it with temperatures just above freezing and rain.
In 2014 I caught more “Fudging” of the data at my nearby weather station. This is a central North Carolina station and I am looking at Monthly temps 90°F and over for years, 2004 & 2010 & 2013.
First I was keeping track of the days with highs 90°F and above last summer (2014). There was one day at 95°F and 4 days at 91°F as I mentioned several times last fall at WUWT.
I just looked at the data again in early 2015 and low and behold there are now FIFTEEN DAYS instead of FIVE!!! Ten of those days occurred by the end of July so I would not have missed them. (see below)
As a Lab manager of a Quality lab for decades I learned the tricks for spotting ‘Flinching’ and other telltales of data fraud. (I got fired for catching the upper level’s pet lab tech who was ‘Adjusting’ numbers so batches would pass and ship. The end result was three plane crashes and a FAA investigation.)
One method for catching fraud is to look at the last digit and determine the count. If the data set is large enough the numbers should be equal. Since this is high temperature you would expect either equal numbers or a tapering off with more numbers at 0,1,2 3 than at 7,8,9
There were 105 days 90 and above for the three years I looked at so that is enough data to see a trend. The data is in °F but looked funny so I also included °C.
Temperature ———- COUNT
(32.2 °C) 90 °F..——..6 ALL in 2013
(32.8 °C) 91 °F..——..41
(33.3 °C) 92 °F..——..4 ALL in 2013
(33.9 °C) 93 °F..—–..10
(34.4 °C) 94 °F..——..0
(35.0 °C) 95 °F..—–..17
(35.55 °C) 96 °F..—..10
(36.1 °C) 97 °F..——..0
(36.67 °C) 98 °F..—..16
(37.2 °C) 99 °F..-..0
(37.77 °C) 100.°F-..1
Now that distribution is weirder than snake shoes. ALL the data for 90 °F and 92 °F is in 2013 and it just so happens to add up to the extra 10 above 90 °F that wasn’t in the same data set last year.
If you discount the 90 °F and 92 °F from 2013 (since they just mysteriously appeared) you get
(32.8 °C) 91 °F
(33.9 °C) 93 °F
(35.0 °C) 95 °F
(35.55 °C) 96 °F
(36.67 °C) 98 °F
(37.77 °C) 100.°F
32.2 °C is 90 °F where as 89 °F is 31.67 °C so that might explain the promotion of 89°F to 90°F as numbers got changed back and forth from °C to °F to °C. But it does not explain all the 96 °Fs instead of 97 °F which is 36.11 °C. As I said weird.
As a lab manager I would be asking some very pointy little questions of anyone who reported these type of numbers over a sixth month interval.
THIS IS THE DATA:
April 2004 (6)…April 2010 (1)…April 2013 (0)
2 days – 91F……..1day – 91F………(high 86F)
4 days – 93F……………………………………..
May 2004 (17)…May 2010 (4)….May 2013 (0)
6 days – 91F…….4day……. – 91….. (2 days 88)
6 days – 93F…………………………………….
2 days – 95F…………………………………….
1 days – 96F……………………………………
2 days – 98F…………………………………….
June 2004 (11)…June 2010 (18)…June 2013 (3)
1 days – 91F…….5 day – 91F………90F – 2
7 days – 93F……..5 days – 93F……………
none ……………….2 days – 95F………..95 F – 1
2 days – 96………2 days – 96F…………….
1 days – 98F……..4 days – 98F…………….
Jul 2004 (24)….Jul 2010 (15)…..Jul 2013 (7)
……………………………………………….90F – 3
4 day – 91F 91F – 4…………91F – 1
11 days – 93F 93F – 4………..92F – 3
1 days – 95F. 95F – 2
days – 96F 96F – 2
7days – 98F 98F – 2
………………………….100F – 1
Aug 2004 (12)…Aug 2010 (13)…Aug 2013 (4)
……………………………………………….90F – 1
1 day – 91F 91F – 4………….91F – 2
8 days – 93F 93F – 3………….92F – 1
3 days – 95F 95F – 5
0days – 96F 96F – 1
Sept 2004 (0)…Sept 2010 (11)..Sept 2013 (1)
0 days – 91F 91F – 5…………91F – 1
0 days – 93F 93F – 3………..
0 days – 95F 95F – 1
0 days – 96F 96F – 2
YOU ARE AMAZING AND RARE
REAL
Santa will be good to YOU!
Interesting take here.If the electrical (EM) force(s) pervade all nature at the basest of level’s , would any investigation into the climate system be best suited to be approached from there? With the entire Sun-Earth “circuit” being the framework from which all physical manifestations (Cloud/Rain/Hail/Heat/Wind etc) follow? and then can be treated as the secondary-effects which that view would relegate them to?
——snip——In an electric field, the water molecule will rotate to line up with the field. When it condenses in a cloud the average electric dipole moment of a water molecule in a raindrop is 40 percent greater than that of a single water vapor molecule. This enhancement results from the large polarization caused by the electric field induced by surrounding water molecules. In the atmospheric electric field the water molecules will be aligned with their dipoles pointing vertically and in a sense that is determined by the charge polarization in the cloud. It is interesting to note that the tops of storm clouds are positively charged and the base is negative. That is the reverse of the radial charge polarization within the Earth itself. And it is this charge polarization that gives rise to the low-order attractive force we call gravity. So it is proposed that water droplets in clouds experience an antigravity effect. It appears to be related to the ‘Biefield-Brown Effect,’ where a charged high-voltage planar capacitor tends to move in the direction of the positive electrode. That effect may explain how millions of tons of water can be suspended kilometres above the ground, when cloud droplets are about 1,000 times denser than the surrounding air.
Of course, this raises the issue of charge separation in clouds. The conventional ‘isolated Earth’ view is that positive and negative charge is ‘somehow’ separated by vertical winds in clouds and that this process in thunderstorms is responsible for charging up the ionosphere and causing the atmospheric electric field. But this begs the question of cause and effect. Recent high-altitude balloon flights find that charge is not built up in the cloud, it already exists in the ionosphere above. In January 2002 I argued the electric universe model:
“Thunderstorms are not electricity generators, they are passive elements in an interplanetary circuit, like a self-repairing leaky condenser. The energy stored in the cloud ‘condenser’ is released as lightning when it short-circuits. The short-circuits can occur either within the cloud or across the external resistive paths to Earth or the ionosphere. The charge across the cloud ‘condenser’ gives rise to violent vertical electrical winds within the cloud, not vice versa.”——————————- http://www.holoscience.com/wp/electric-weather/
Earth as a stellar transformer – Climate change effects (EU presentation)
Bruce Leybourne
http://viewpure.com/QiM_gLRIuGc?start=0&end=0
Electrical force out-powers gravity by 10^39 times (that’s a lot of zeroes)!
I have followed the EU theories for several years, not that I understand it all that well. It has taken me quite a while to wrap my head around the physics but they do not condescend to laypeople, which I appreciate. They use old fashion natural philosophy rather than confusing science-speak. What the hell is the “space-time continuum”? “Warped space”?
The Big Bangers claim the science is settled as well but it is being seriously challenged.
Orthodox scientists can understand the electrical nature of the universe. Galactic currents power the stars and the solar wind. It makes far more sense than the “everything from nothing” gravitational billiard-ball theory. From this, I believe, will come important technology and more energy efficient, cleaner and safer power generation.
Faster than light communication may also be possible (“gravitational longitudinal waves”, above my understanding but sounds plausible). We know gravity’s hold is nearly instantaneous as the sun holds only Pluto right now and there is no delay.
What powers the center of the galaxy? The EU claims it is a simple concept, called a plasmoid. This can be replicated in the lab. The current idea of black holes are science fiction. (Nothing can escape? Only now it can, with massive jets observed from the poles).
IMHO, the AGW and Big Bang theories are a distraction. As long as they can continue to control the debate and narrative, they will hold onto the power. We need an end-run.
The EU theory is a serious field of study and should be given the respect it deserves as well as thoughtful debate like any other area of science. Newton wasn’t wrong but the universe is more than billiard ball mechanics. Much of Einstein’s work is being re-examined.
Electromagnetic fields around planets and stars are now obvious. Where do they come from? The Big Bangers claim they are generated from within the body, but the EU theory has another answer. They are a result of interaction from without not only from within. Why certain planets like Venus or Mars have very weak electromagnetic fields, I can’t say. But it is said that all of the stars in the Milky Way galaxy can fit within the sun’s heliosphere!
And it should be the most logical answer that the sun, which is a variable star with a changing EM field, would affect our climate even with small changes far more than would a .0004 atmospheric trace gas. Besides, it is well observed that CO2 increases after it warms and the Earth has gone through this many times before. If it was a runaway effect, it would have already happened, it seems to me. An increase of .0001 over 100 years will cause a major problem? Even a child could see this is illogical.
First they deny that there has been a hiatus in temperature rise, then the prove that there are other causes for the hiatus in temperature, then they adjust the temperature record to erase the hiatus, then they return to deny that there has been any hiatus. This is what Climate Science has become, a small branch of politics.
The Climatologists knew as little in 1971 as they do now, but their opinion has swung 180 degrees, nonetheless.
In the future, they will have to go back to the past.
“The Climatologists knew as little in 1971 as they do now.”
I prefer it stated the other way around.
The Climatologists know as little now as they did in 1971.
ie.. SFA !!!!!
Actually , maybe you are correct.
They do seem to have gone BACKWARDS.
Negative knowledge.. so to speak.
@Gail
I lost the the thread a bit here,
but I want to pick it up again with this graph from Gail
https://i1.wp.com/www.climate4you.com/images/CloudCoverTotalObservationsSince1983.gif
It is just a pity that we cannot see the data after 2010.
Nevertheless, it seems that there was a dip around 1997, when earth’s output was at a max.
It [cloud cover]seems sure to rise from 2010?
Ok, that 1997 was in my mind, it looks the dip is 1999-2000
Another old failed alarmist loon is “predicting” dhoom! Again… LOL…
http://www.theguardian.com/theguardian/2008/mar/01/scienceofclimatechange.climatechange
The Guardian claims his “predictions” were consistent, they just didn’t mention they were wrong!
amirlach: That piece is from 2008.
Much to the fury of the Warmunists, James Lovelock has recanted and is now regarded as a heretic.
http://wattsupwiththat.com/2013/01/26/newsbytes-global-warming-downgraded-james-lovelock-recants/
Yes, the apostate Lovelock has been excommunicated. He was lucky to get away with just that.
Al Gore: Influential Climate Change Deniers Should be Punished
This crazy bugger thinks we should all be killed.
https://tallbloke.wordpress.com/2012/12/24/prof-richard-parncutt-death-penalty-for-global-warming-deniers/