Mind Blowing Sea Level Fraud From The White House

Tide gauges show that sea level rise rates do not change as CO2 increases. They also show that sea level rise rates have been steady for a very long time.

Image 34

Sea Level Trends – State Selection 

The White House claims that sea level rise rates have doubled since the early 1990’s

ScreenHunter_96 Oct. 18 09.55

Image 35

The White House also claims that sea level rise rates are affected by atmospheric CO2, despite the fact that there is zero evidence to back that up.

ScreenHunter_94 Oct. 18 09.48

scenarios.globalchange.gov/sites/default/files/NOAA_SLR_r3_0.pdf

There is not one shred of evidence that sea level rise rates have increased, or that sea level rise rates change as CO2 increases. The rate of rise or fall at nearly every single long term tide gauge has been fixed for more than a century.

ScreenHunter_99 Oct. 18 09.59ScreenHunter_98 Oct. 18 09.59ScreenHunter_97 Oct. 18 09.57

Posted in Uncategorized | 5 Comments

Father Of Global Warming Saw It As A Good Thing

The father of global warming saw burning coal and doubling CO2 as a huge benefit to mankind. His temperature forecasts were absurd, but he did understand that CO2 was a benefit to plants.

ScreenHunter_91 Oct. 18 09.22Image 32

Papers Past — North Otago Times — 16 April 1910 — HOW THE BURNING OF COAL VITIATES THE ATMOSPHERE.

Image 33

The Pueblo Leader

Posted in Uncategorized | 7 Comments

Methane BS From Kevin Trenberth

Kevin Trenberth of NCAR told this nonsense to the Washington Post :

Methane is a substantial contributor to global warming

Science: Global Warming and the Government

The radiative transfer model used by Trenberth’s NCAR is RRTM. That model shows that even a 500% increase in methane (CH4) would have almost no impact on Earth’s radiative balance in the mid-latitudes, where almost all of the world’s population lives.

Image 30

Methane is an unstable gas which oxides quickly in the atmosphere. It occupies less than two parts per million of the atmosphere, and its absorption bands almost completely overlap with H2O .  Even a very large increase in CH4 would have almost no impact on the climate.

Posted in Uncategorized | 10 Comments

Greenland Blowing Away All Records For Ice Growth

Greenland has gained 150 billion tons of snow and ice in the last six weeks, blowing away all previous records.

ScreenHunter_88 Oct. 18 08.08ScreenHunter_89 Oct. 18 08.08

Greenland Ice Sheet Surface Mass Budget: DMI

Temperatures in southwest Greenland have been dropping at a rate of 24°C per century since 2003.

ScreenHunter_87 Oct. 18 07.29webcam-017930

US government climate experts say that Greenland is overheating and melting down, because they are criminals paid to lie to push Obama’s political agenda.

Posted in Uncategorized | 11 Comments

Arctic Sea Ice Extent Highest In A Decade

After the shortest melt season on record, and the most rapid growth on record, Arctic sea ice extent is the largest in a decade.

Image 29 

Ocean and Ice Services | Danmarks Meteorologiske Institut

ScreenHunter_84 Oct. 18 04.20

Not only is extent increasing, but Arctic sea ice thickness has also increased by 40% over the last five years.

Bpiomas_plot_daily_heff.2sst (1)Bpiomas_plot_daily_heff.2sst.png (2488×1960)

None of this will be reported by the criminals at US government agencies or in the press.

Posted in Uncategorized | 18 Comments

Spectacular NOAA Fraud With The US Climate Extreme Index

The latest government fraud being pimped by the press is the NOAA Climate Extremes Index (CEI.) This is a completely fraudulent index designed to mask the recent lack of heat and other extreme weather in the US.

NOAA shows that the area of the US experiencing unusually hot summer afternoons has increased to record levels.

percentage of the United States with maximum temperatures much above normal.

ScreenHunter_83 Oct. 18 01.15U.S. Climate Extremes Index (CEI): Graph | National Centers for Environmental Information (NCEI)

The actual NOAA data set shows the exact opposite. The area of the country reaching 100 degrees has plummeted to record lows. None of the published NOAA adjustments should have any impact on this metric. They have no excuses for this fraud.

ScreenHunter_79 Oct. 18 00.43

The same is true for 95 degree days. The area of the US reaching 95 degrees has also plummeted and near record lows.

ScreenHunter_80 Oct. 18 00.58

Not only has the area affected by hot weather plummeted, by the frequency of hot weather has also plummeted.

ScreenHunter_82 Oct. 18 01.08ScreenHunter_81 Oct. 18 01.03

The US has been enjoying very mild summers with record low numbers of hurricanes and tornadoes, so NOAA simply made up a 100% fraudulent data set (CEI) to distract attention. NOAA (Department of Commerce) reports directly to Barack Obama.

ScreenHunter_3463 Oct. 14 21.59

torngraph-big (1)

Posted in Uncategorized | 13 Comments

Never More True Than Now

The time is near at hand which must determine whether Americans are to be free men or slaves.

  • George Washington

“If the freedom of speech is taken away then dumb and silent we may be led, like sheep to the slaughter.”

  • George Washington

In 2015 we have a different sort of president, who wants to end free speech in order to push his fraudulent green energy agenda

Image 28

Posted in Uncategorized | 5 Comments

Ice Doesn’t Lie, But NASA Scientists Do

In 2006, NASA knew that Antarctic temperatures had “decreased significantly” in recent decades.

Image 27

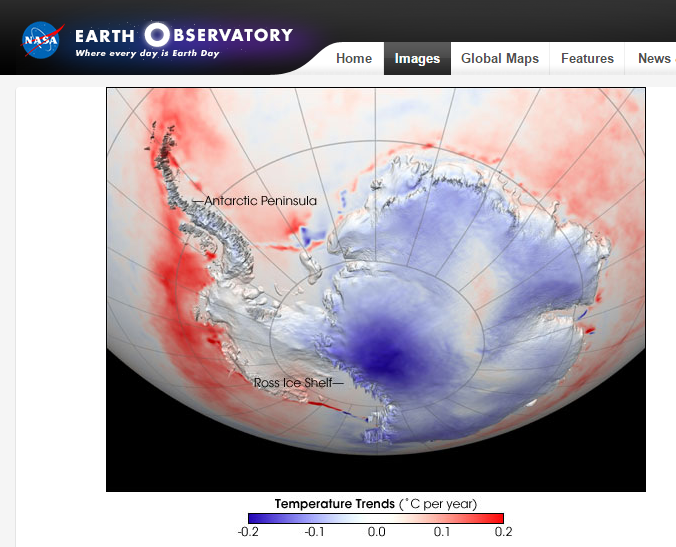
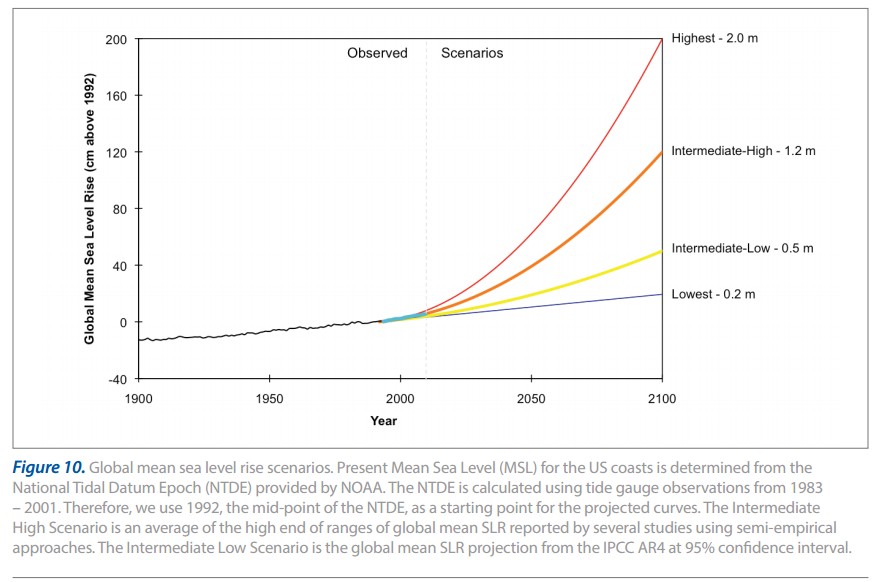
Antarctic Temperature Trend 1982-2004 : Image of the Day

Shindell, D.T., and G.A. Schmidt 2004. Southern Hemisphere climate response to ozone changes and greenhouse gas increases. Geophys. Res. Lett. 31, L18209, doi:10.1029/2004GL020724.

While most of the Earth warmed rapidly during recent decades,surface temperatures decreased significantly over most of Antarctica.

Pubs.GISS: Abstract of Shindell and Schmidt 2004

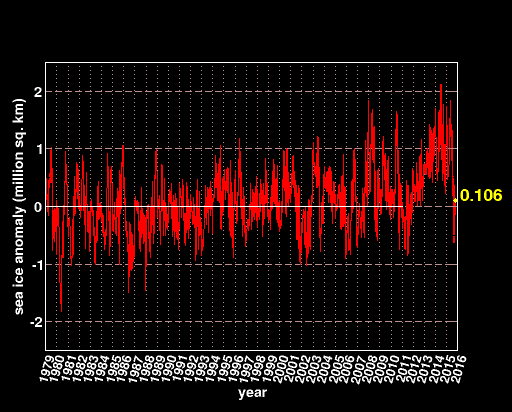
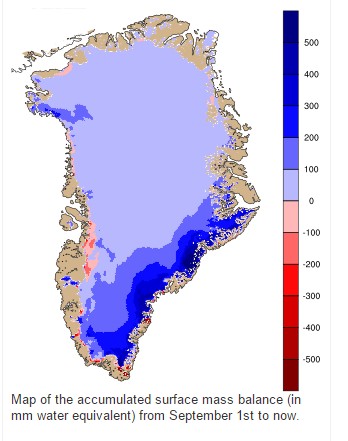
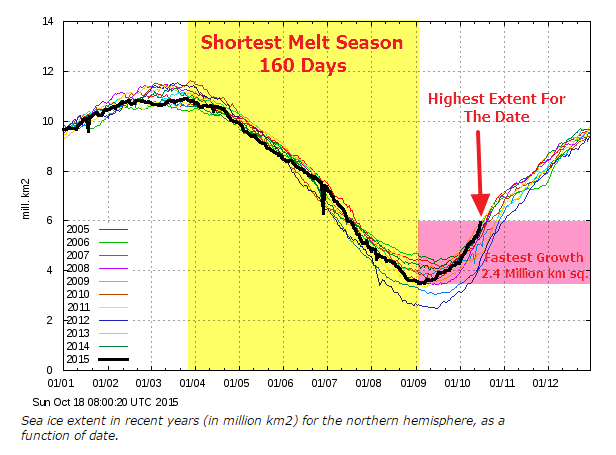
This cooling trend was confirmed by a steady increase in sea ice surrounding the continent.

iphone.anomaly.antarctic

iphone.anomaly.antarctic.png (512×412)

Satellites also show a cooling trend over the oceans surrounding Antarctica.

MSU_AMSU_Channel_tlt_Trend_Map_v03_3_1979_2014.730_450

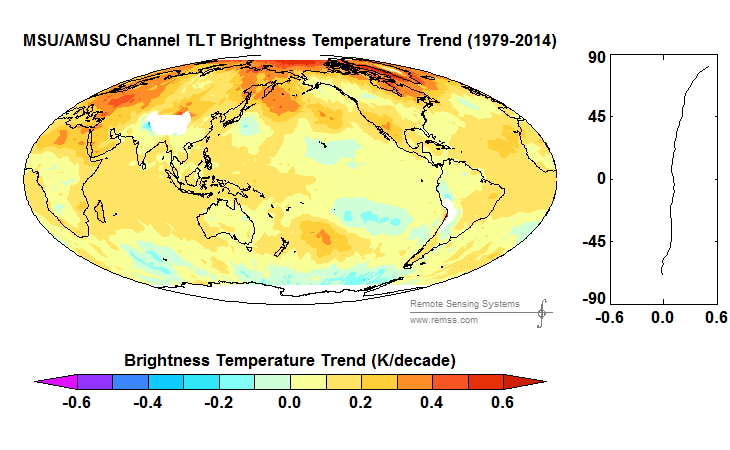
RSS / MSU Data Images / Monthly

But this cooling didn’t suit the global warming agenda, so in 2007 NASA simply made the cooling disappear.

wilkins_avh_2007
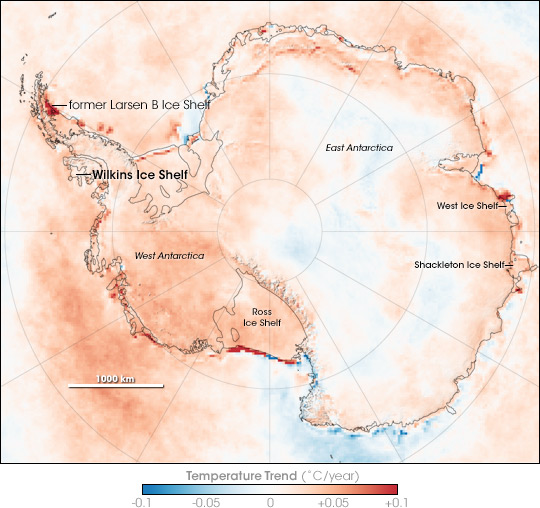
Disintegration: Antarctic Warming Claims Another Ice Shelf : Feature Articles

They used this completely implausible excuse for their data tampering

This image was first published on April 27, 2006, and it was based on data from 1981-2004. A more recent version was published on November 21, 2007. The new version extended the data range through 2007, and was based on a revised analysis that included better inter-calibration among all the satellite records that are part of the time series.

In other words, they are criminals committing fraud for political and funding purposes.

Posted in Uncategorized | 7 Comments

Climate Stupidity Is Cyclical With Progressives Like Jerry Brown

ts

After several La Nina years in 1977, Governor Jerry Brown warned of drought disaster in California.

Image 26

TimesMachine: March 8, 1977 – NYTimes.com

The jet stream that winter was very similar to the jet stream in 2014/2015

screenhunter_224-jan-21-20-19

The Lewiston Journal – Google News Archive Search

California was having a drought very similar to the current drought.

PaintImage89

National Geographic blamed the California drought and cold, snowy weather in the East on global cooling.

ScreenHunter_9219 May. 13 08.37ScreenHunter_9226 May. 13 08.41

An El Nino set in the following winter, and a year later California was very wet.

PaintImage90

The current El Nino is forecast to start producing heavy rain in Northern California in about a week.

ScreenHunter_75 Oct. 17 15.38

10-Day Precipitation Outlook for the Conterminous U.S.

Everything is exactly the same as 1977, including the governor. The only difference is that this time they are blaming it on “global warming” instead of “global cooling”

Posted in Uncategorized | 20 Comments

More Mind Blowing Temperature Fraud From The White House

The White House National Climate Assessment boldly predicts a huge increase in the number of 90 degree days in the Northeast US, based on “carbon emissions”

NE_days_above90_V5 

Northeast | National Climate Assessment

Actual government temperature data shows the exact opposite – the frequency of 90 degree days in the Northeast has been dropping since 1895, and is near record lows now.

ScreenHunter_70 Oct. 17 08.26

Fraud is standard operating procedure at the White House. Barack Obama is determined to make electricity prices skyrocket, and no lie is too big to achieve that goal.

https://www.youtube.com/watch?v=HlTxGHn4sH4

Posted in Uncategorized | 12 Comments