Ice Doesn’t Lie, But NASA Scientists Do

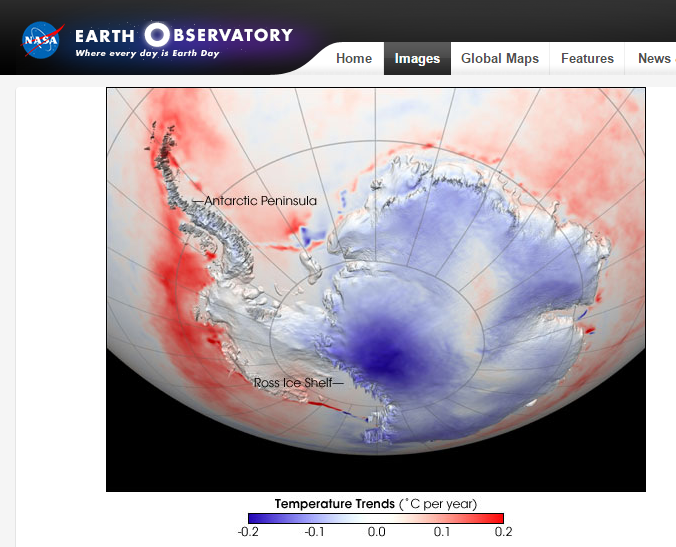
In 2006, NASA knew that Antarctic temperatures had “decreased significantly” in recent decades.

Image 27

Antarctic Temperature Trend 1982-2004 : Image of the Day

Shindell, D.T., and G.A. Schmidt 2004. Southern Hemisphere climate response to ozone changes and greenhouse gas increases. Geophys. Res. Lett. 31, L18209, doi:10.1029/2004GL020724.

While most of the Earth warmed rapidly during recent decades,surface temperatures decreased significantly over most of Antarctica.
Pubs.GISS: Abstract of Shindell and Schmidt 2004

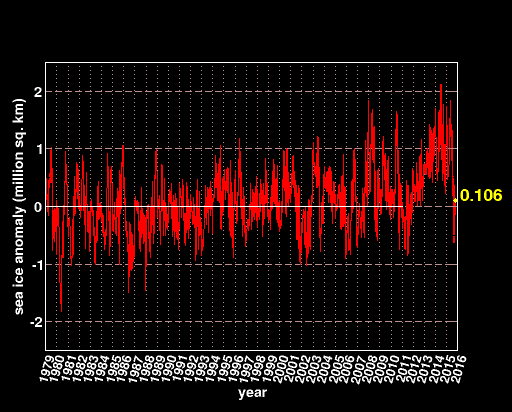
This cooling trend was confirmed by a steady increase in sea ice surrounding the continent.
iphone.anomaly.antarctic

iphone.anomaly.antarctic.png (512×412)

Satellites also show a cooling trend over the oceans surrounding Antarctica.
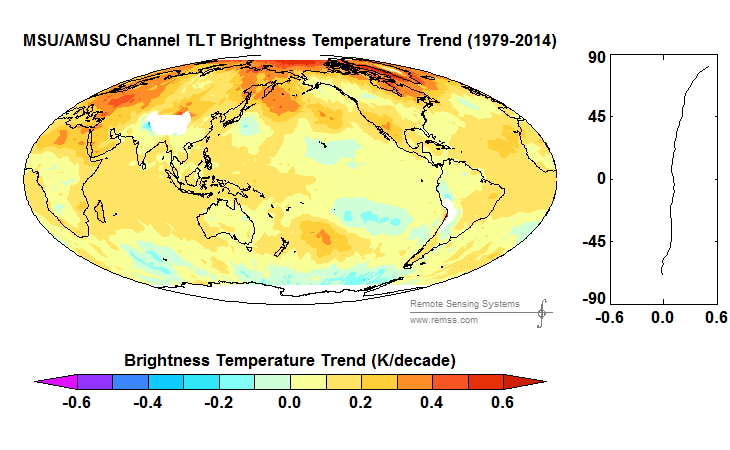
MSU_AMSU_Channel_tlt_Trend_Map_v03_3_1979_2014.730_450

RSS / MSU Data Images / Monthly

But this cooling didn’t suit the global warming agenda, so in 2007 NASA simply made the cooling disappear.

wilkins_avh_2007Disintegration: Antarctic Warming Claims Another Ice Shelf : Feature Articles

They used this completely implausible excuse for their data tampering

This image was first published on April 27, 2006, and it was based on data from 1981-2004. A more recent version was published on November 21, 2007. The new version extended the data range through 2007, and was based on a revised analysis that included better inter-calibration among all the satellite records that are part of the time series.

In other words, they are criminals committing fraud for political and funding purposes.
Posted in Uncategorized | 7 Comments

Climate Stupidity Is Cyclical With Progressives Like Jerry Brown

ts

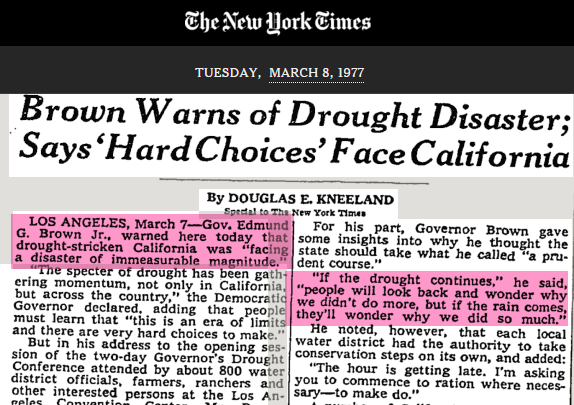
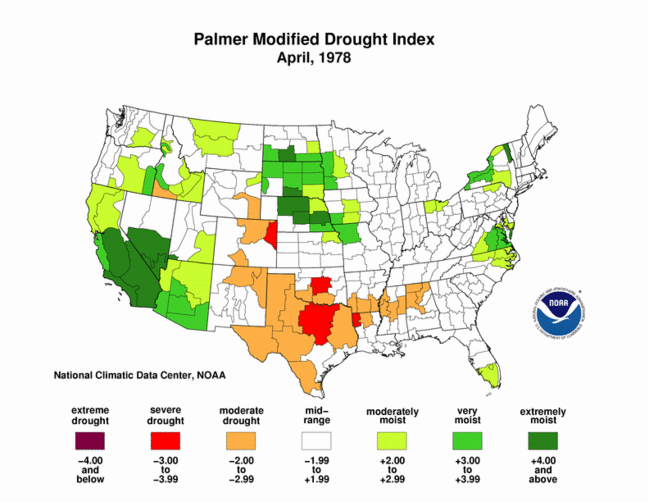
After several La Nina years in 1977, Governor Jerry Brown warned of drought disaster in California.

Image 26

TimesMachine: March 8, 1977 – NYTimes.com

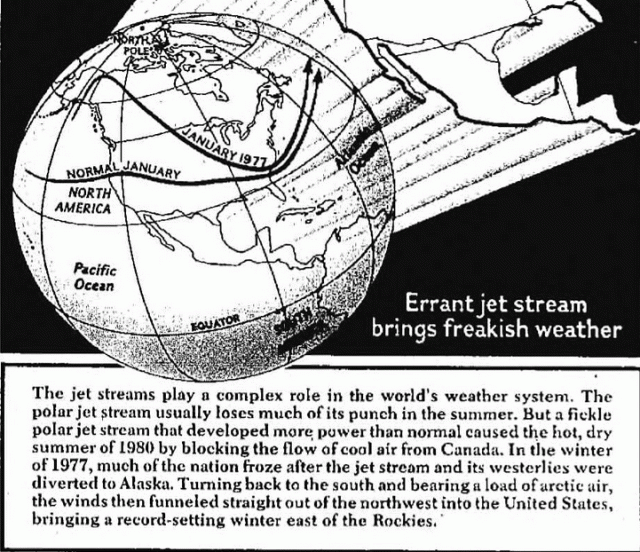
The jet stream that winter was very similar to the jet stream in 2014/2015

screenhunter_224-jan-21-20-19

The Lewiston Journal – Google News Archive Search

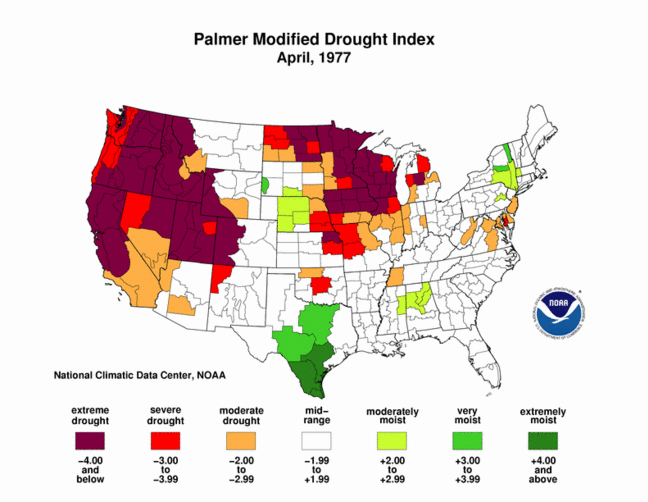
California was having a drought very similar to the current drought.

PaintImage89

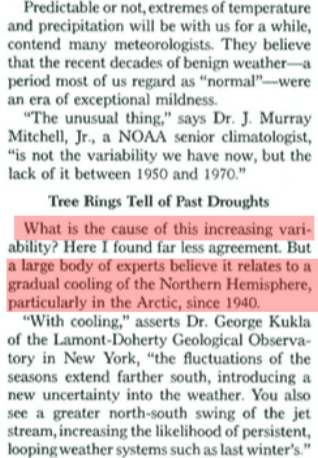
National Geographic blamed the California drought and cold, snowy weather in the East on global cooling.

ScreenHunter_9219 May. 13 08.37ScreenHunter_9226 May. 13 08.41

An El Nino set in the following winter, and a year later California was very wet.

PaintImage90

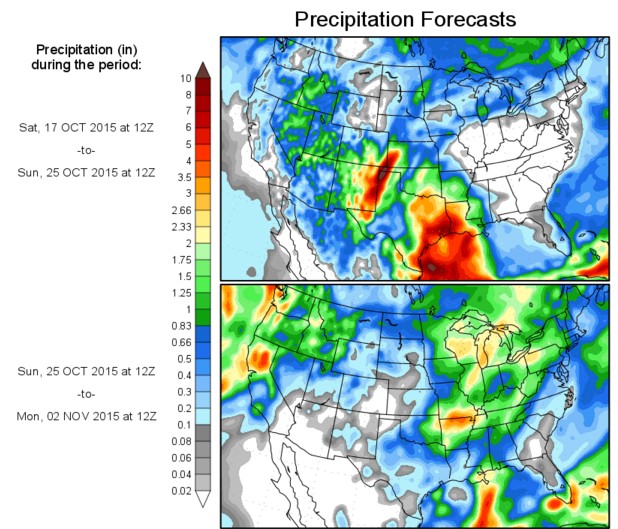
The current El Nino is forecast to start producing heavy rain in Northern California in about a week.

ScreenHunter_75 Oct. 17 15.38

10-Day Precipitation Outlook for the Conterminous U.S.

Everything is exactly the same as 1977, including the governor. The only difference is that this time they are blaming it on “global warming” instead of “global cooling”

Posted in Uncategorized | 20 Comments

More Mind Blowing Temperature Fraud From The White House

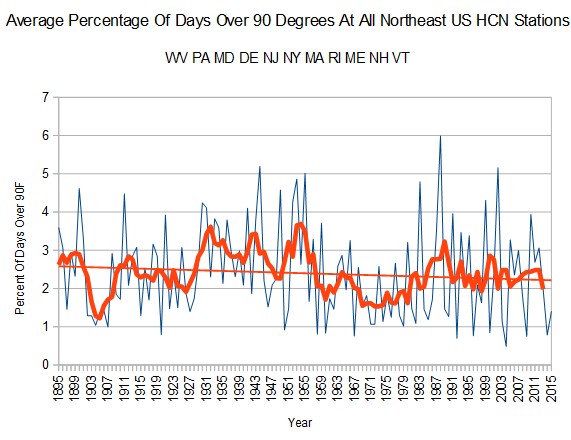
The White House National Climate Assessment boldly predicts a huge increase in the number of 90 degree days in the Northeast US, based on “carbon emissions”

NE_days_above90_V5 

Northeast | National Climate Assessment

Actual government temperature data shows the exact opposite – the frequency of 90 degree days in the Northeast has been dropping since 1895, and is near record lows now.

ScreenHunter_70 Oct. 17 08.26

Fraud is standard operating procedure at the White House. Barack Obama is determined to make electricity prices skyrocket, and no lie is too big to achieve that goal.

https://www.youtube.com/watch?v=HlTxGHn4sH4

Posted in Uncategorized | 12 Comments

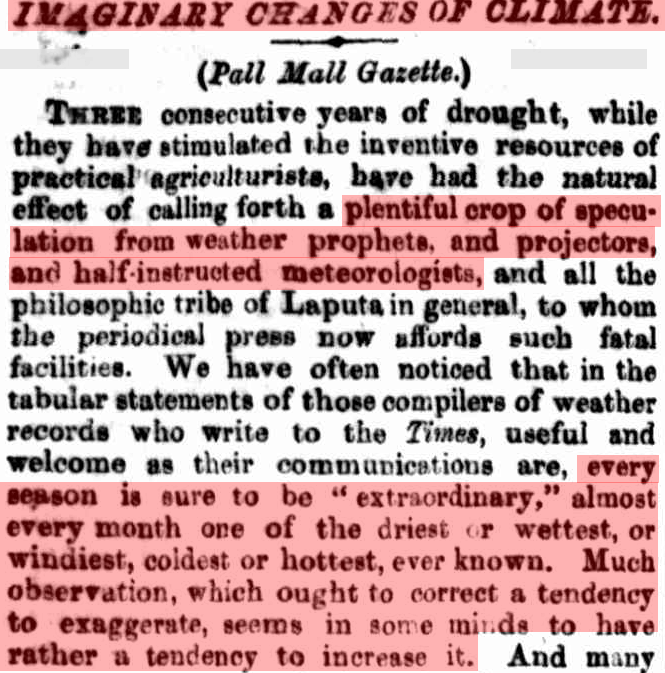
October Temperatures In Massachusetts Plummeting

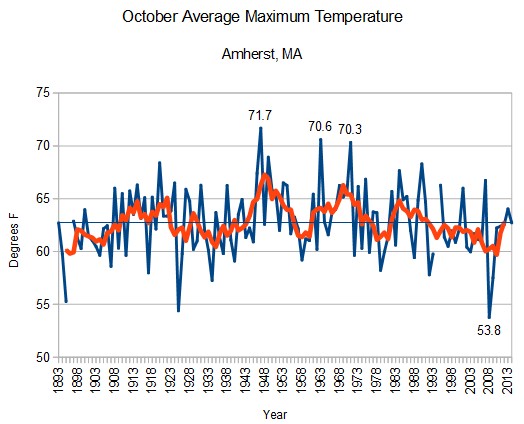
On this date in 1908, Amherst MA reached 90 degrees. Today’s forecast high is 40 degrees cooler with a freeze warning for tonight.
ScreenHunter_67 Oct. 17 07.14

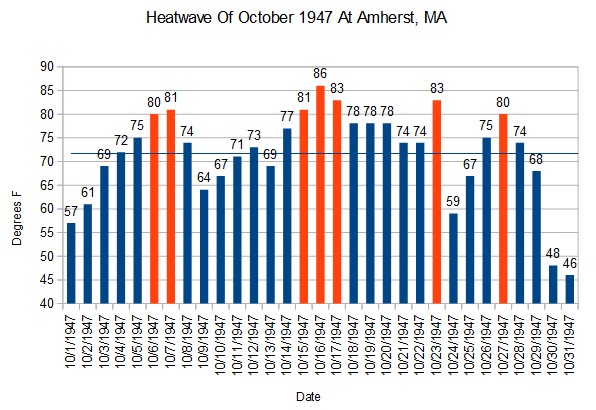
October temperatures in Amherst have been dropping since the 1940s. Their coldest October was in 2008.

ScreenHunter_66 Oct. 17 07.12

The warmest October in Amherst was 1947, which had seven afternoons over 80 degrees, and averaged almost 72 degrees.

ScreenHunter_65 Oct. 17 07.03

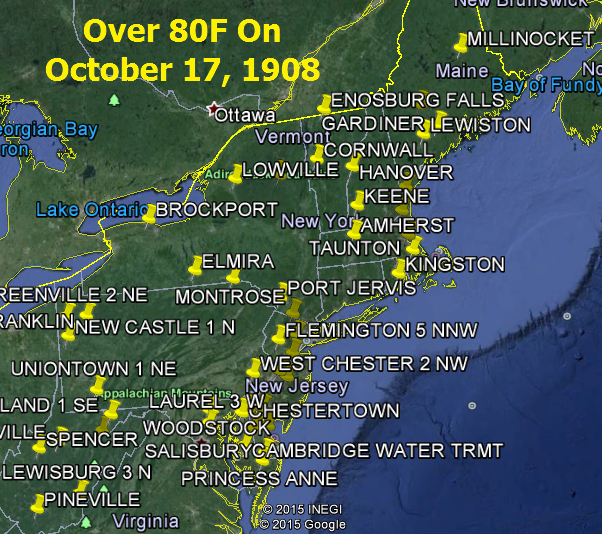
The 1908 heatwave was not localized to Massachusetts. Laurel, MD was also 90 degrees on this date in 1908. Most of the Northeast reached 80 degrees, and many stations reached 85 degrees.

Image 15Image 16

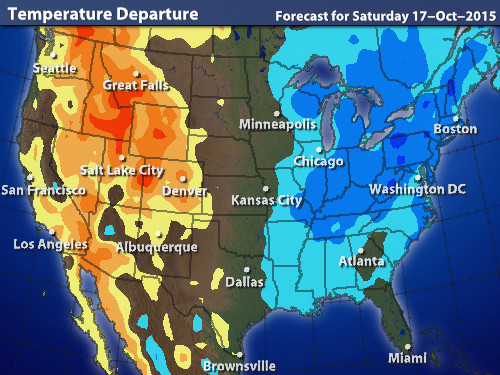
This year’s October 17 forecast for the Northeast is cold.

usa

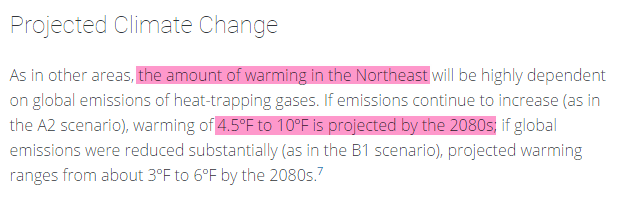
White House criminals predict 4.5 to 10 degrees warming in the Northeast, in defiance of all observed data, science and basic common sense.

Image 22Northeast | National Climate Assessment

Posted in Uncategorized | 3 Comments

More Shameless Temperature Fraud From The White House

The climate criminals at the White House claim that recent Midwest heatwaves (i.e. 2012) were longer and more intense than earlier heatwaves.

the country had their highest number of short-duration heat waves in the 1930s, when the multi-year severe drought of the Dust Bowl period, combined with deleterious land-use practices, contributed to the intense summer heat through depletion of soil moisture and reduction of the moderating effects of evaporation. However, the recent prolonged (multi-month) extreme heat has been unprecedented since the start of reliable instrumental records in 1895.The recent heat waves and droughts in Texas (2011) and the Midwest (2012) set records for highest monthly average temperatures, exceeding in some cases records set in the 1930s

Extreme Weather | National Climate Assessment

This level of fraud by the White House is spectacular – even for Barack Obama. The frequency of hot days in the Midwest has plummeted to near record lows in recent years.

ScreenHunter_54 Oct. 16 18.40

The duration of Midwest heatwaves has also plummeted to near record lows

ScreenHunter_53 Oct. 16 18.39

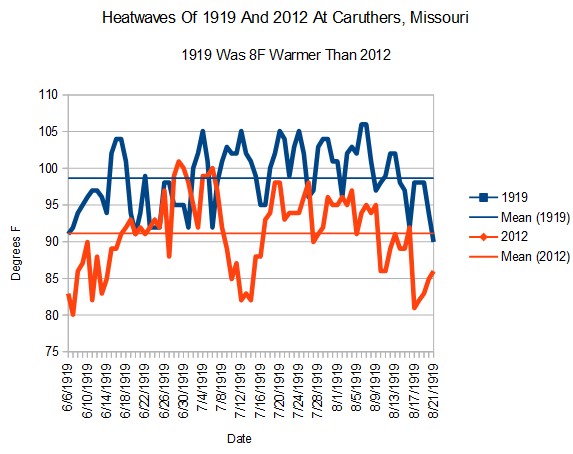
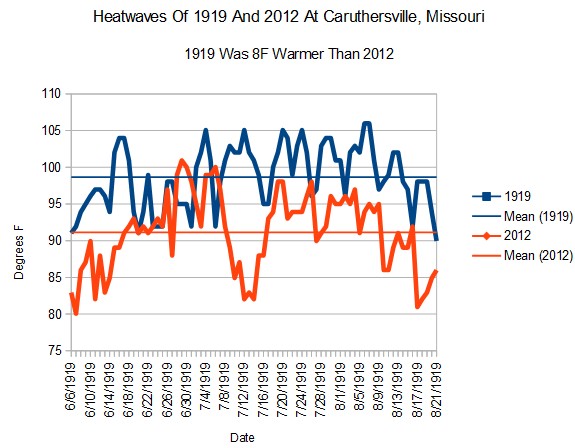
In order to visualize the depth of the White House depravity, let’s test their record Midwest heatwave of 2012 at one station in Missouri. During 1919, Caruthersville, MO had 77 consecutive days over 90 degrees. It was hotter almost every day in summer 1919 than 2012, and the summer averaged 8°F hotter in 1919.

ScreenHunter_56 Oct. 16 19.12

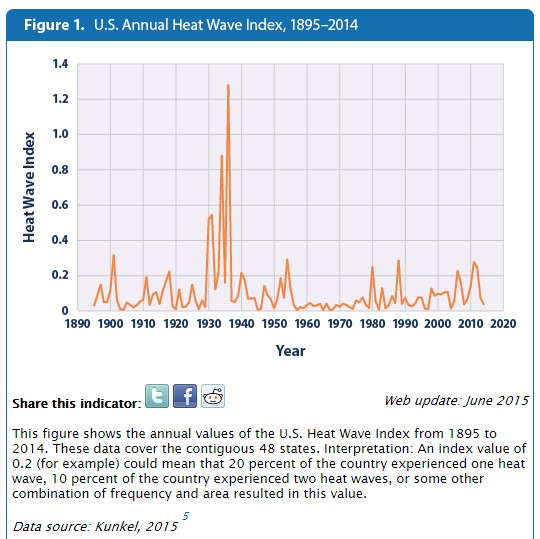
By every metric, heatwaves have become much less common and much less intense in the US and the Midwest. Even the EPA knows that the Obama White House is lying.

ScreenHunter_58 Oct. 16 19.19ScreenHunter_57 Oct. 16 19.17

High and Low Temperatures | Climate Change | US EPA

President Obama has an agenda to make electricity prices skyrocket in the US, and no fraud is too big towards that end.

https://www.youtube.com/watch?v=HlTxGHn4sH4

Posted in Uncategorized | 9 Comments

Are 97% Of Scientists Complete Morons?

Atmospheric CO2 has risen by 100 parts per million (one part per ten thousand) over the past century. That is equivalent to packing one extra person into this Bernie “everything will be free” Sanders rally.

ScreenHunter_51 Oct. 16 12.26

Experts claim that this one molecule has heated the other 10,000 molecules up by more than one degree centigrade.

In order for one molecule to heat up 10,000 other molecules by 1°C, the effective temperature of that one molecule would have to be 10,000°C – about twice the temperature of the surface of the Sun.

Only a complete moron would believe something so ludicrous, which is why they say 97% of scientists agree on this utter nonsense.

Posted in Uncategorized | 38 Comments

Today’s Featured Climate Fraudster : Denis Balibouse

Denis Balibouse of Reuters is claiming that the Aletsch Glacier in Switzerland is disappearing “because of climate change.”

Oct 15, 2015 6:44am

Vast Alpine glacier could almost vanish by 2100 due to warming GREAT ALETSCH GLACIER, SWITZERLAND

DENIS BALIBOUSE

One of Europe’s biggest glaciers, the Great Aletsch, coils 23 km (14 miles) through the Swiss Alps – and yet this mighty river of ice could almost vanish in the lifetimes of people born today because of climate change.

The glacier, 900 meters (2,950 feet) thick at one point, has retreated about 3 km (1.9 miles) since 1870 and that pace is quickening, as with many other glaciers around the globe.

That is feeding more water into the oceans and raising world sea levels.

Vast Alpine glacier could almost vanish by 2100 due to warming | Reuters

The average rate of retreat the article is claiming since 1870 is 69 feet per year.

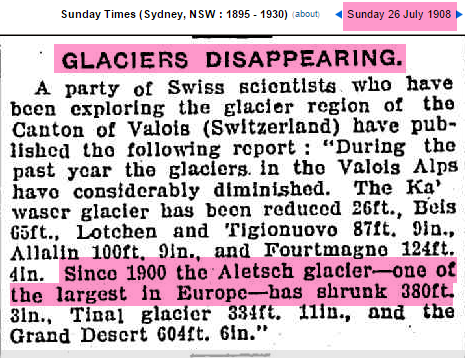
The Aletsch Glacier shrank 380 feet from 1900 to 1908, which according to NASA was the coldest period on record, with declining temperatures.

Image 10

26 Jul 1908 – GLACIERS DISAPPEARING.

Image 13

Fig.A2.gif (658×474)

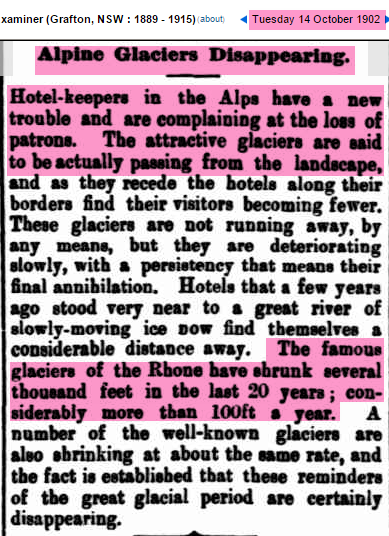
Glaciers in the Alps were retreating “considerably more than 100 ft per year” prior to 1902, which was a cold period of declining temperatures according to NASA.

Image 12

14 Oct 1902 – Alpine Glaciers Disappearing.

Denis Balibouse is describing a phenomenon which has been going on at a similar rate for one and a half centuries, during periods of declining temperatures and much lower CO2, He is blaming it on “climate change” without presenting one shred of evidence to back his assertion. This is standard operating procedure among climate fraudsters. He claims to do research, but is simply parroting propaganda.

ScreenHunter_50 Oct. 16 12.09

Posted in Uncategorized | 12 Comments

Spectacular Forest Fire Lies From The US Government

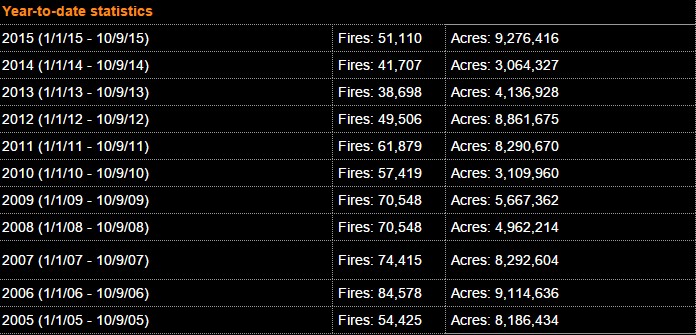
Most of the west had a very quiet fire season. Here in Colorado, the fire season was one of the quietest on record. Same was true in New Mexico and Wyoming. But due to some large fires in Alaska, the total burn acreage was the highest in a decade.

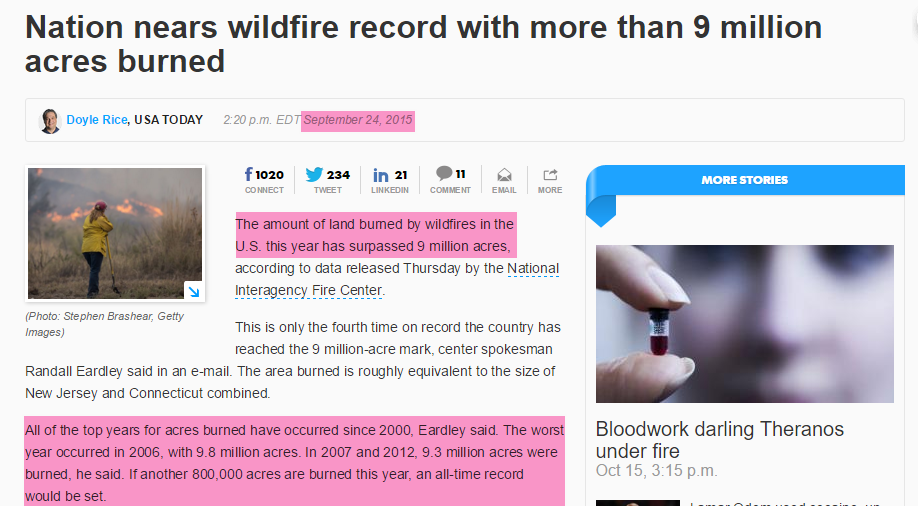
The US government wasted no time declaring the nine million acres to be a record.

Image 9

Nation nears wildfire record with more than 9 million acres burned

ScreenHunter_48 Oct. 16 09.08

National Interagency Fire Center

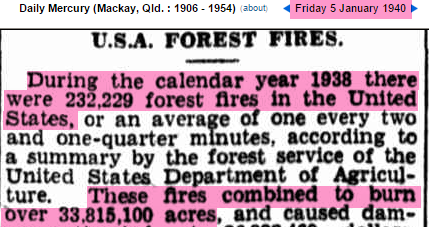
Had anyone in the US government bothered to check their own fire records, they would have known that there were more than four times as many fires in 1938, and that burn acreage in 1938 was almost four times s large as 2015.

Image 8

05 Jan 1940 – U.S.A. FOREST FIRES.

h/t Andy Oz

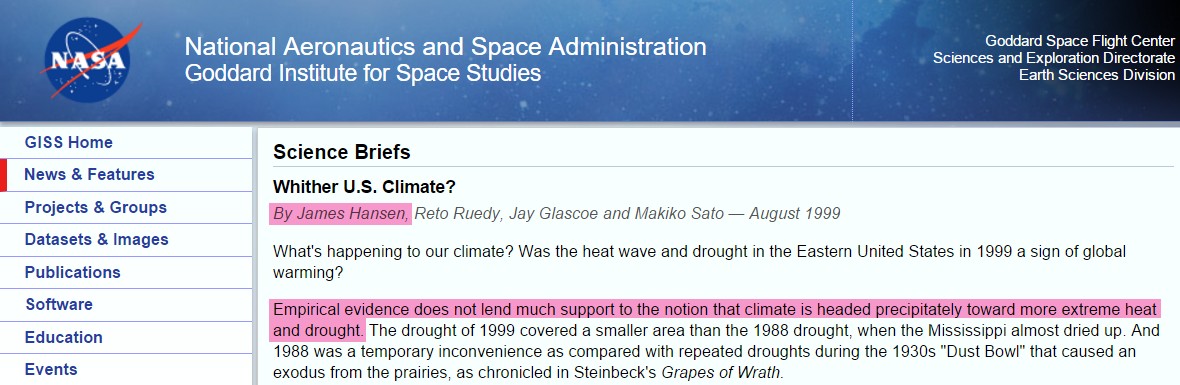
The 1930’s were much hotter and drier in the US. Even NASA’s James Hansen knows this.

Empirical evidence does not lend much support to the notion that climate is headed precipitately toward more extreme heat and drought. The drought of 1999 covered a smaller area than the 1988 drought, when the Mississippi almost dried up. And 1988 was a temporary inconvenience as compared with repeated droughts during the 1930s “Dust Bowl” that caused an exodus from the prairies, as chronicled in Steinbeck’s Grapes of Wrath.

NASA GISS: Science Briefs: Whither U.S. Climate?

Posted in Uncategorized | 7 Comments

Another Smoking Gun Of Temperature Fraud At NASA

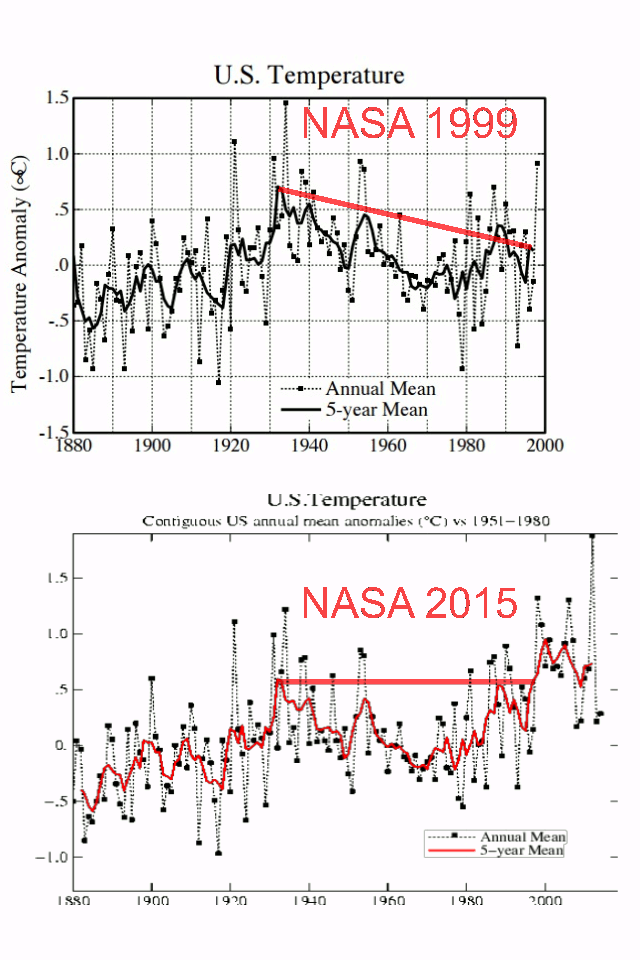
In 1999, NASA’s James Hansen wrote that the US was cooling, even as greenhouse gases rapidly increased.

ScreenHunter_46 Oct. 16 08.37

Science Briefs
Whither U.S. Climate?
By James Hansen

Empirical evidence does not lend much support to the notion that climate is headed precipitately toward more extreme heat and drought

in the U.S. there has been little temperature change in the past 50 years, the time of rapidly increasing greenhouse gases — in fact, there was a slight cooling throughout much of the country (Figure 2).

NASA GISS: Science Briefs: Whither U.S. Climate?

The US has (by far) the most credible temperature record in the world, so this cooling was devastating to their global warming theory. NASA responded to this challenge as they always do, by tampering with the data and making the cooling disappear.

GISSUS1999vs20151999 version: 1999_Hansen_etal_1.pdf
2015 version: Fig.D.gif (525×438)

Posted in Uncategorized | 10 Comments

“The Whole Aim Of Practical Politics”

Baltimore’s finest native son was Sarah Rawlings Blake HL Mencken. He explained the Obama game plan, a century ago.

The whole aim of practical politics is to keep the populace alarmed (and hence clamorous to be led to safety) by menacing it with an endless series of hobgoblins, all of them imaginary.

  • H. L. Mencken

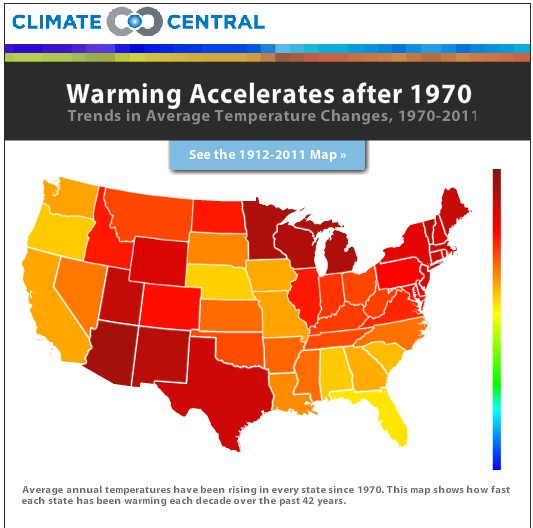
Global warming is about trying to scare the stupid 47% of the population, otherwise known as Democrats. They use tampered, cherry picked, maps and graphs like Heidi Cullen’s map below, with red colors intended to scare frozen people into believing they are burning up.

ScreenHunter_30 Oct. 15 17.35

The Heat is On: U.S. Temperature Trends | Climate Central

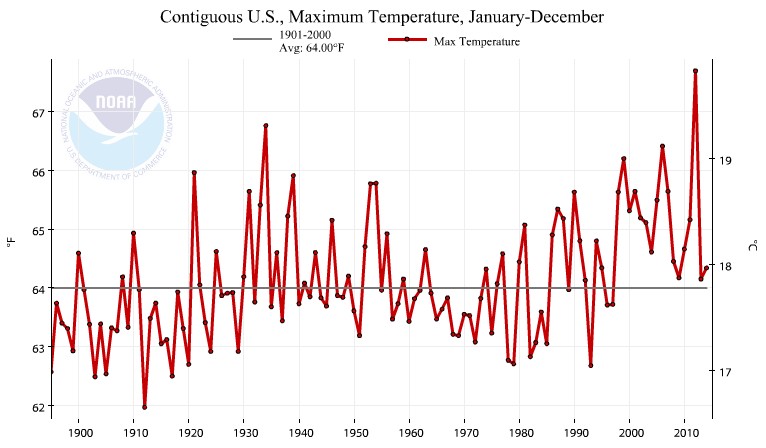
This map is derived from completely fraudulent government data, like the graph below.

ScreenHunter_29 Oct. 15 17.33

Climate at a Glance | National Centers for Environmental Information (NCEI)

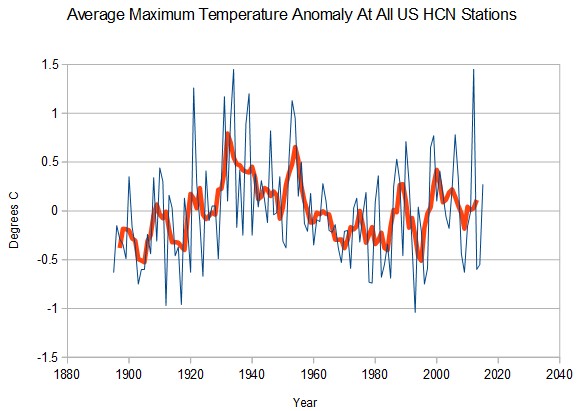
The actual underlying data shows that US maximum temperatures peaked in the 1930’s, and have been generally declining ever since.

ScreenHunter_27 Oct. 15 16.28

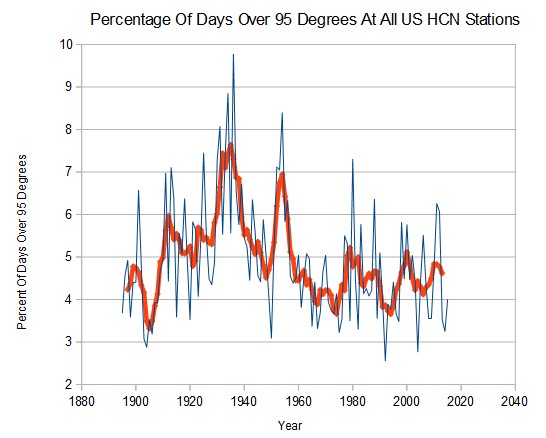
The frequency of hot days has plummeted in the US

ScreenHunter_25 Oct. 15 16.19

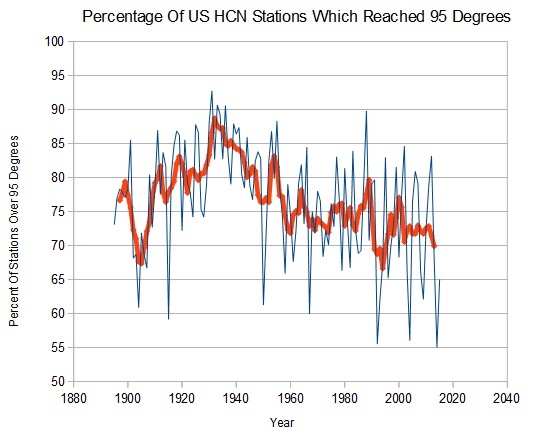
The area of the US seeing hot weather has plummeted in the US.

ScreenHunter_24 Oct. 15 16.16

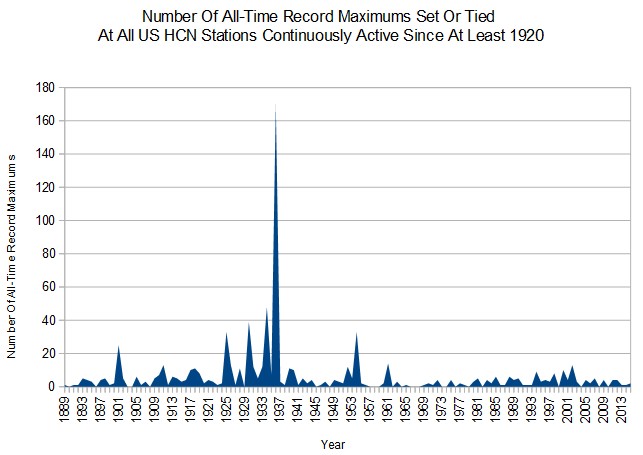
The vast majority of maximum temperature records in the US were set before 1940.

ScreenHunter_26 Oct. 15 16.23

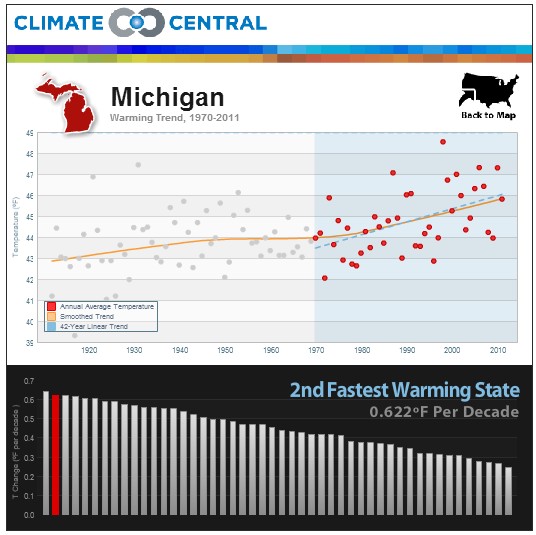
The data doesn’t back up any of the government’s lies, so they simply alter it. Heidi Cullen claims that Michigan is the second fastest warming state.

ScreenHunter_31 Oct. 15 17.35

The Heat is On: U.S. Temperature Trends | Climate Central

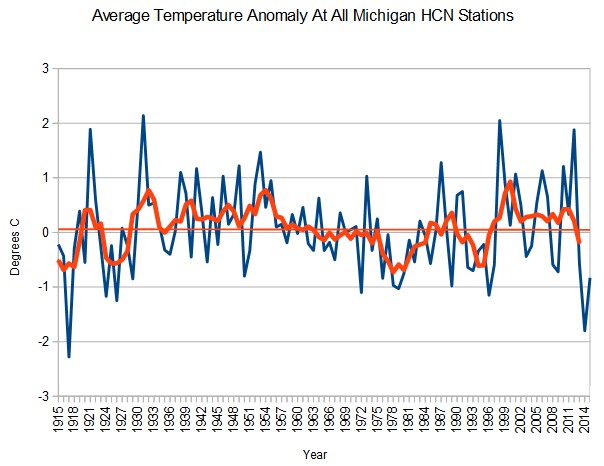
In fact, there has been zero warming in Michigan over the past century, with recent years among their coldest.

ScreenHunter_32 Oct. 15 17.44

There is no indication that the US is getting hotter, or will get hotter in the future.  But there is a massive industry built up around lying to people about this topic.

The whole aim of practical politics is to keep the populace alarmed (and hence clamorous to be led to safety) by menacing it with an endless series of hobgoblins, all of them imaginary.

  • H. L. Mencken

This identical climate fraud has been going on for centuries.

Posted in Uncategorized | 7 Comments