Rampant Sea Level Fraud In Academia And Government

In 1982, NASA showed just over three inches (8 cm) of sea level rise from 1880 to 1980. They also showed a sharp slowdown in sea level rise rates after 1950.

ScreenHunter_2132 May. 31 12.25

pubs.giss.nasa.gov/docs/1982/1982_Gornitz_etal_1.pdf

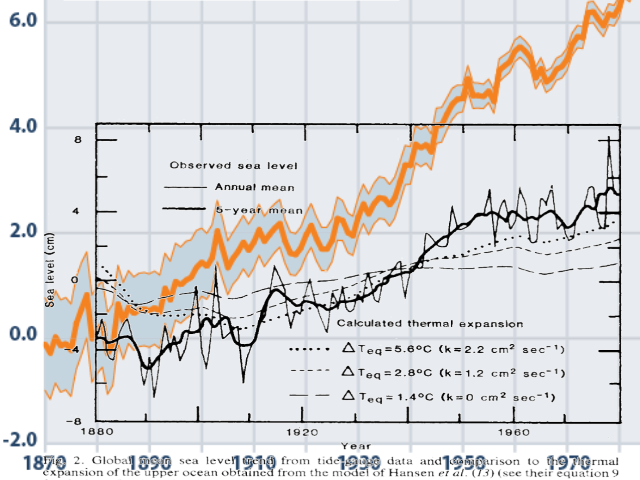
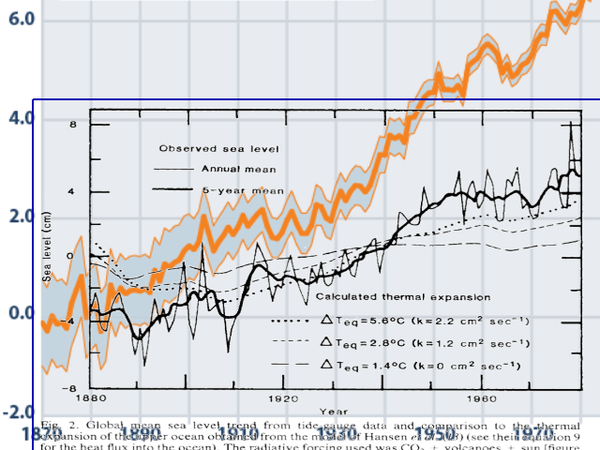
Three inches isn’t very scary, so the EPA has doubled that figure, and shows six inches of sea level rise from 1880 to 1980 – with completely fake acceleration after 1950.

Trends_in_global_average_absolute_sea_level,_1870-2008_(US_EPA) (1)Trends in global average absolute sea level, 1870-2008 (US EPA) – Sea level rise

This graph overlays the two graphs at the same scale. The EPA data is political, not scientific.

CGWXcXUU8AABZ5w

Tide gauges show a slowdown in sea level rise rates, so government propaganda agencies tamper with them and now simply ignore them, instead using incredibly poor interpretations of satellite data since 1993. But even this data is being tampered with over time.

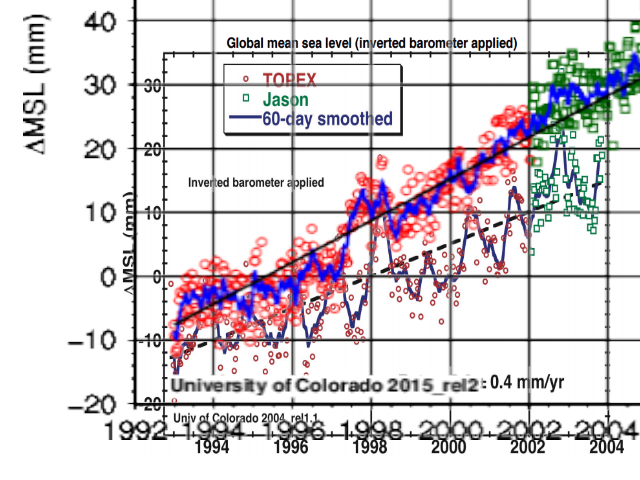
In 2004, the University of Colorado (who got beaten up by Oregon yet again last night) showed sea level rise rate of 2.8 mm/year, with an error of +/- 0.4.

ScreenHunter_10644 Oct. 03 11.07

http://sealevel.colorado.edu/2004_rel1.2/sl_cu2004_rel1.2.pdf

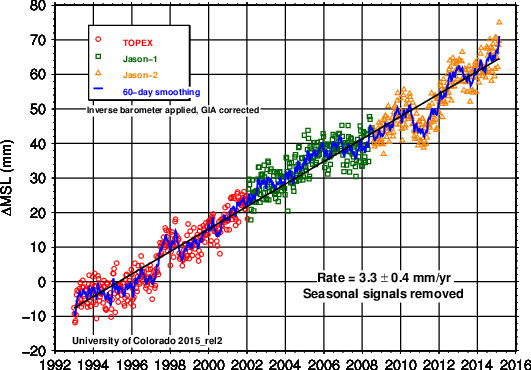
 That wasn’t very scary, so they have since changed the data and moved it outside of their own error bars to 3.3 mm/year, using a Global Isostatic Adjustment which is 100% fraudulent in the context of sea surface height. That adjustment was intended to calculate ocean depth as the sea floor sinks, but has no bearing on the accuracy of measurement of sea level by satellites.

sl_ns_global (2)

2015_rel2: Global Mean Sea Level Time Series (seasonal signals removed) | CU Sea Level Research Group

The image below overlays them at the same scale. The University of Colorado simply altered the data to make it look a little scarier.

AnimationImage86

But here is the real smoking gun of fraud from the IPCC.

In 1990 the IPCC said :

there is no convincing evidence of an acceleration in global sea level rise during the twentieth century

there is weak evidence for an acceleration over the last 2-3 centuries

PaintImage85

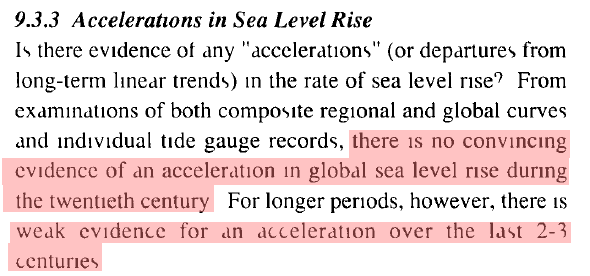
In the 2013 report, they say the exact opposite

The 2013 IPCC report (AR5) concluded, “there is high confidence that the rate of sea level rise has increased during the last two centuries, and it is likely that GMSL (Global Mean Sea Level) has accelerated since the early 1900’s

Trends in global average absolute sea level, 1870-2008 (US EPA) – Sea level rise – Wikipedia, the free encyclopedia

Very little of what you hear about the climate from government or academia has any validity. They are simply fabricating data for political and monetary purposes. It is a $29 billion dollar per year RICO style racket, and the biggest scam in history.

Posted in Uncategorized | 36 Comments

Arctic Gained 20,000 Manhattans Of Ice In September

ScreenHunter_10655 Oct. 04 05.42

Ocean and Ice Services | Danmarks Meteorologiske Institut

Arctic sea ice experienced the earliest minimum on record this year, and has seen record growth in September.

The Sierra Cub says the Arctic has been ice-free for two years.

CPmlTl4UEAA5Zok

Posted in Uncategorized | 29 Comments

More On NOAA Model Uncertainty

The turquoise cone below shows NOAA’s Joaquin “Forecast Uncertainty” as of September 30 at 11:32 PM. The hurricane is currently 677 km east of the forecast track, but their forecast uncertainty cone was only 210 km. Their actual uncertainty was more than three times larger than what their model predicted.

ScreenHunter_10653 Oct. 04 05.17
ScreenHunter_10651 Oct. 04 05.12

Joaquin is currently forecast to move towards Ireland as a strong tropical storm.

ScreenHunter_10652 Oct. 04 05.15

These are their good models. Their climate models are completely useless, and have 0% accuracy. Barack Obama then takes impossibly stupid interpretations of completely useless models, and uses them as an excuse to wreck our energy infrastructure.  The US press cheers this treachery, and refuses to publish any accurate information.

Posted in Uncategorized | 27 Comments

Gavin Doesn’t Need Any Actual Data

In the 1990 IPCC report, they showed that there was insufficient temperature data for analysis in much of the Arctic, most of the southern oceans, and all of the Antarctic.

PaintImage78

In 1978, scientists agreed data south of 30S was too meager to be reliable.

PaintImage83ScreenHunter_10659 Oct. 04 06.22

TimesMachine: January 5, 1978 – NYTimes.com

A lack of data is no obstacle for Gavin however. He simply makes the data up.

nmaps (13)

But this fraud is much worse than it seems. The fastest warming places on Gavin’s imaginary Earth are the areas with little or no data.

nmaps (14)

Using fake data allows him to keep cooling the past and warming the present.

GISS1982_2002_2014_2015

Gavin’s fake data massively skews temperature trends upwards, and then President Obama takes Gavin’s fake numbers on the road to assist in establishing his fake “climate” agreement.

Posted in Uncategorized | 24 Comments

Obama Praises Gun Bans And Confiscation

This week, President Obama praised the idea of gun bans and confiscation – like the Nazis did in 1938 immediately ahead of the Holocaust.

ScreenHunter_10638 Oct. 03 08.00

Middlesboro Daily News – Google News Archive Search

He is doing the exact opposite of what he promised as a candidate.

You heard it right here on television, I won’t take your rifle away, I won’t take your handgun away.

Posted in Uncategorized | 44 Comments

Union Army Was Complicit In Genocide

george-custer-1custer flag

Before General Custer carried the Union Flag to massacre Native Americans, he was one of Abraham Lincoln’s heroes at Gettysburg and Appomattox.

On June 29, 1863 Custer was commissioned to brigadier general of volunteers and assigned to command a brigade in Kilpatrick’s division. While in this position he led his men in the Battle of Gettysburg where he assisted in preventing J.E.B. Stuart from attacking the Union rear.

As Custer’s final major act in the war he led the division responsible for cutting off Lee’s last avenue of escape at Appomattox; a week later he received the appointment, major general of volunteers.

George Armstrong Custer

The Union flag is clearly a symbol of hatred and aggression against Native Americans, and must be taken down from all statehouses which fly it.

Posted in Uncategorized | 20 Comments

At NOAA And NASA, Error Bars Mean Nothing

The map below shows all of NOAA’s Joaquin forecast tracks since September 30 at 11:32 PM. It also shows their “Forecast Uncertainty” from September 30 in turquoise.

ScreenHunter_10623 Oct. 03 05.33

ScreenHunter_10635 Oct. 03 07.05

Their current forecast is thousands of kilometers outside of their September 30 “uncertainty” – indicating that they actually have no idea how accurate their forecasts are and are simply making certainty numbers up.

With Hurricane Irene, they forecast landfall at every Eastern Seaboard state at one time or other, and then declared victory when one of their forecasts came true. They bet on every horse in the race.

irene-3

And NASA does the same thing with temperature, adjusting temperatures far outside of their own error bars.

AnimationImage61

The abuse of data at US government agencies is astonishing. The only thing that is certain is that their certainty is meaningless.

Posted in Uncategorized | 14 Comments

The Evolution Of National Geographic’s Spectacular Climate Lies

In 1976, National Geographic correctly reported that Earth’s temperature varied from 50F to 61F during the span humans occupied the planet, and that most of human existence was typified by extremely cold weather which would not support civilization. (Chicago was under a mile of ice)

ScreenHunter_10631 Oct. 03 05.55

ScreenHunter_10632 Oct. 03 05.57

But by 2007, National Geographic had completely thrown science and integrity out the window, and was claiming that the planet was a steady 57F prior to the burning of fossil fuels. They also started promoting starving poor people by using food for fuel.

ScreenHunter_10633 Oct. 03 06.01

ScreenHunter_10629 Oct. 03 05.49

The big question is – who is paying for this massive global warming fraud?

Posted in Uncategorized | 16 Comments

Spectacular White House Climate Fraud On The Great Lakes

The White House claims that Great Lakes ice is disappearing, and that US seasonal snow cover is decreasing.

Rising temperatures across the U.S. have reduced lake ice, sea ice, glaciers, and seasonal snow cover over the last few decades. In the Great Lakes, for example, total winter ice coverage has decreased by 63% since the early 1970s.

ScreenHunter_10602 Oct. 02 20.08 

Melting Ice | National Climate Assessment

In fact, there has been no change in Great Lakes ice cover, with five out of the last nine years normal or above normal cover.


IceCoverAvg1973_2015

IceCoverAvg1973_2015.jpg (3292×1438)

Ships were getting stuck in the ice in March.

ScreenHunter_10614 Oct. 02 22.44

Great Lakes ice cover over 88%

There was record ice cover this winter within view of Barack Obama’s window.

PaintImage53

The Potomac has finally melted, but it was gorgeous in ice and snow (Photos) – The Washington Post

But the White House climate fraud is much worse than it seems. North American snow coverage is not decreasing. It has been steadily increasing and at record levels in recent years.

namgnld_season4namgnld_season1 (1)

Rutgers University Climate Lab :: Global Snow Lab

There was snow on the ground in 48 states on February 23.

ScreenHunter_10615 Oct. 02 22.47Snow on the ground in 48 states

At the same time the White House is claiming that snow and ice is disappearing due to global warming, they are also saying that snow and ice is increasing due to global warming.

Holdren says, “If you’ve been hearing that extreme cold spells like the one that we’ve been having in the United States now disprove global warming, don’t believe it.”

In fact, the U.S. should expect more instances of Arctic-like weather in the future as the polar vortex — known typically to circulate around the Arctic — weakens its centralized hold due to global warming, Holdren says.

WH: Polar temps part of climate change | TheHill

The Obama White House is attempting to perpetrate the biggest scam in history, and Republicans are too timid to call him out on it. Thomas Jefferson must be rolling in his grave.

Posted in Uncategorized | 24 Comments

Minnesota’s Extreme Past

On February 15, 1936 Ada Minnesota set their all-time cold record of -53°F. Less than five months later they set their all-time hot record of 111°F on July 6, 1936. That is a spread of 164 degrees.

On this date in 1922, Ada was 99°F. Today’s forecast high is 35 degrees cooler at 64°F.

One hundred degree days were very common in Ada when CO2 was below 350 PPM, but they almost never happen any more. There has only been one 100 degree day in Ada since 1988. but in 1936 they had twelve consecutive 100 degree days and eighteen during the summer.

ScreenHunter_3383 Oct. 02 09.32

For the entire state of Minnesota, the frequency of hot days has plummeted over the past 120 years. Since CO2 hit 350 PPM, they rarely have 95 degree days any more.

ScreenHunter_3388 Oct. 02 10.01

The last really hot summer Minnesota had was 1988, when Hansen gave his testimony to Congress warning that we were all going to burn up. And NOAA says this is the hottest year ever.

Posted in Uncategorized | 7 Comments