

Joaquin is dead. The graphic above shows all of the NOAA forecast tracks, and the “cone of uncertainty” on October 1 and October 7. It is clear that they claim certainty much greater than is realistic.
Joaquin is dead. The graphic above shows all of the NOAA forecast tracks, and the “cone of uncertainty” on October 1 and October 7. It is clear that they claim certainty much greater than is realistic.
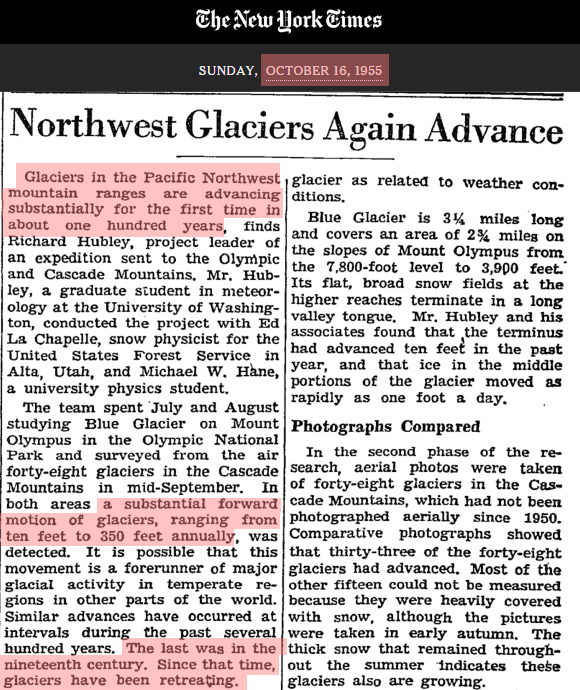
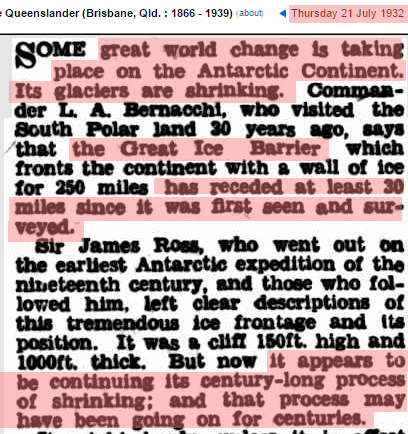
During the 1950’s and 1960’s, glaciers in Europe and the US were growing, for the first time in hundreds of years.
18 Jul 1963 – Glaciers Grow In Norway
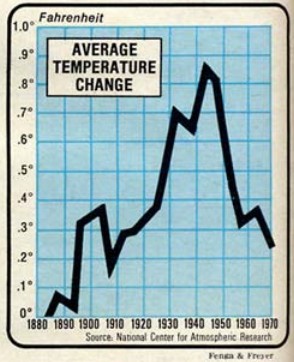
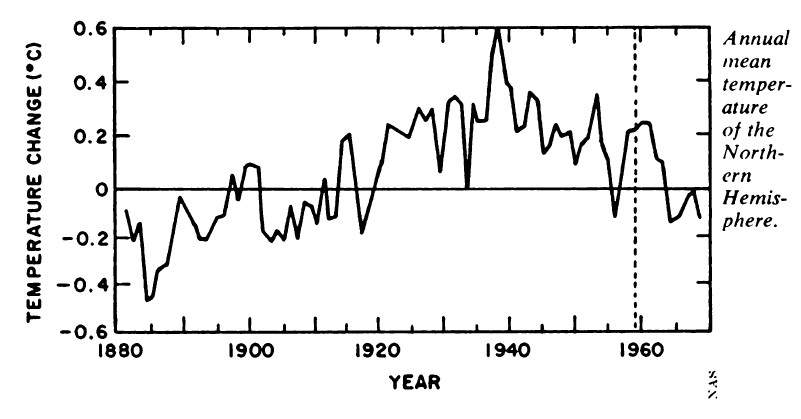
Scientists reported that the Earth had cooled sharply.
NCAR newsweek_coolingworld.pdf
National Academy Of Sciences Science News
National Geographic reported the same thing.
The US and Russia were concerned about Arctic cooling.
Scientists said that global cooling was “indisputable”
There was unanimous consensus that the world was getting colder.
There was never any question that the earth cooled sharply after the 1930’s, but it didn’t fit the political narrative, so NASA and NOAA simply made the cooling disappear.
In the Climategate E-mails, they were very up front about their intentions to do this.
From: Tom Wigley <[email protected]>
To: Phil Jones <[email protected]>
Subject: 1940s
Date: Sun, 27 Sep 2009 23:25:38 -0600
Cc: Ben Santer <[email protected]>It would be good to remove at least part of the 1940s blip, but we are still left with “why the blip”.
The temperature record from government agencies is completely fraudulent and has no scientific value. Its sole purpose is to assist political agendas.
Michael Mann, a climate scientist of Pennsylvania State University, said: “We may see warming even faster than what the models are predicting.”
And Michael England, a professor at the University of New South Wales in Australia, said global temperature has steadily climbed by 1.4 F since 1880.
He said: “Global temperatures may rise another 4 to 7 F (2 to 4 C) by 2100.”
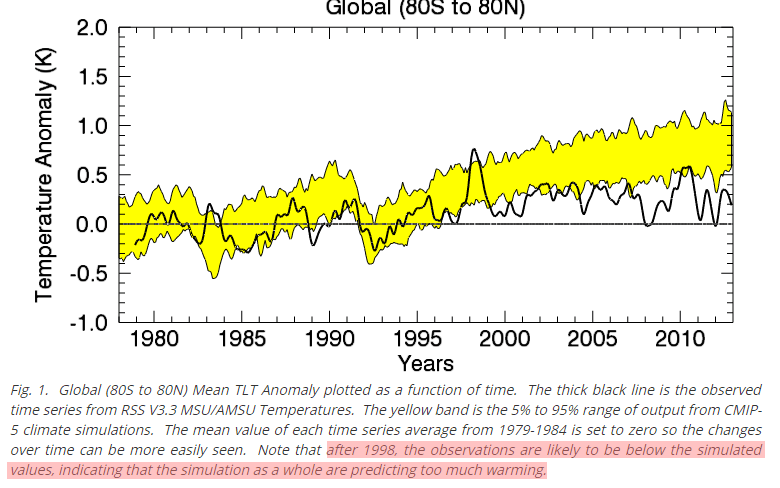
The exact opposite of fraudster Michael Mann’s claim is true. Essentially all models have predicted too much warming.
England’s claim “global temperature has steadily climbed by 1.4 F since 1880. “ is equally fraudulent.
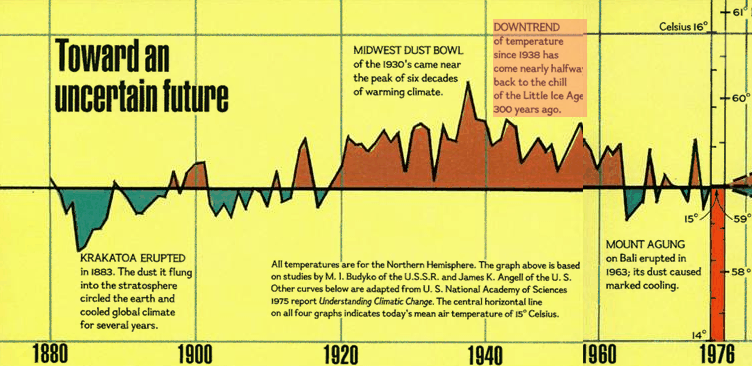
In 1978, National Geographic reported “DOWNTREND of temperature since 1938 has come nearly halfway back to the chill of the Little Ice Age 300 years ago”
They also reported that temperatures were warmer for most of the past 10,000 years.
England’s claim that global temperatures may rise 4 to 7 degrees is equally as fraudulent. Tropospheric temperatures have fallen this century. There is no legitimate reason to expect a large rise
These people are not scientists. They are scamsters telling lies to keep the money coming in.
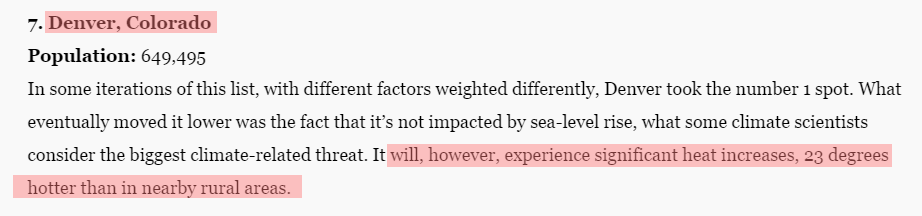
The weather.com Climate Disruption Index – 25 U.S. Cities Most Affected by Climate Change
The Weather Channel says that Denver UHI is 23 degrees. That is mindless idiocy, but just for fun, lets run with that number. So why does USHCN only use a 0.1 degree UHI adjustment?
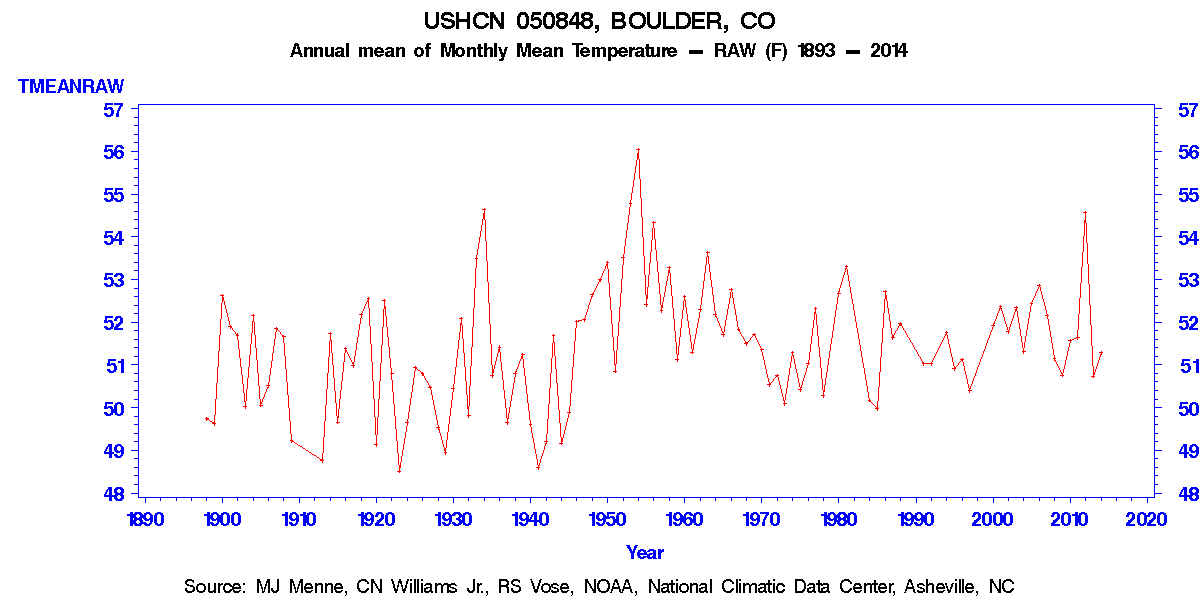
The closest USHCN station to Denver is at Boulder, which has cooled over the past 60 years.
The climate in Colorado is just like it has always been. So where do they dig up these morons? The answer is found at the top of the article.
In the face of growing evidence about the effects of climate change — recently bolstered by a study from the National Oceanic and Atmospheric Administration showing there’s been no slowdown in global warming, despite the popular “hiatus” theory — the future landscape looks quite different from today. “The warmest day that we’d see in 20 to 30 years, the record temperature at that time would have no precedent,” explains Michael Mann, Ph.D., director of the Penn State Earth System Science Center. “New records would exceed old records and typical conditions [would] start to resemble what we today consider ‘extreme.’”
Katharine Hayhoe, Ph.D., a climate scientist based out of Texas Tech University, works with cities on their climate preparedness. She said many local governments are much more aware of and proactive about climate change today. “Ten years ago, it used to be a city wouldn’t really have seen anything happen unless it was a city in Alaska,” she said. “Now, they already have a list of ways they’re being impacted by changing climate. All of the impacts are tied to services or infrastructure.”
Mann and Hayhoe mutter complete nonsense, like crazy folk at the insane asylum.
Boulder is the world’s epicenter of climate fraud. Check out today’s fundraising BS from NSIDC.
Scientists who have been raising alarms about the endangered ice sheet of West Antarctica say they’ve identified a key glacier that could pose the single most immediate threat to the world’s coastlines — and are pushing for an urgent new effort to study it.
The glacier is not one that most Americans will have even heard of — Thwaites Glacier along the Amundsen Sea. It’s a monstrous body that is bigger than Pennsylvania and has discharged over 100 billion tons of ice each year in recent years.
Mindless propaganda. At that rate of loss, it will 3,000 years for sea level to rise one meter. Greenland has gained over 100 billion tons of snow in the last four weeks.
The glacier is both vast and vulnerable, because its ocean base is exposed to warm water and because of an unusual set of geographic circumstances that mean that if it starts collapsing, there may be no end to the process. But it’s also difficult to study because of its location — not near any U.S. research base, and in an area known for treacherous weather. As a result, the researchers are also calling for more support from the federal government to make studying West Antarctica’s glaciers, and Thwaites in particular, a top priority.
More BS. The water around West Antarctica has been running below normal temperature for years.
“In some scenarios, the next 50 years or 100 years could see, you could begin to see very rapid ice loss from central West Antarctica. It’s the wild card,” said Ted Scambos, the lead scientist at the National Snow and Ice Data Center who chaired a meeting earlier this month of West Antarctic scientists outside Loveland, Colorado. Thwaites, says Scambos, has “much more upward potential than we realized.”
Scientists declare an ‘urgent’ mission – study West Antarctica, and fast – The Washington Post
The process Scambos is describing has been going on for centuries. It has nothing to do with humans and there is nothing we could do about it.
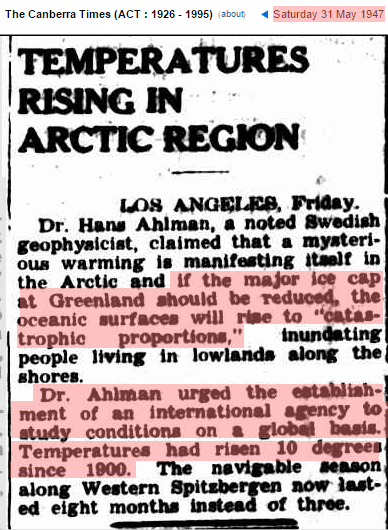
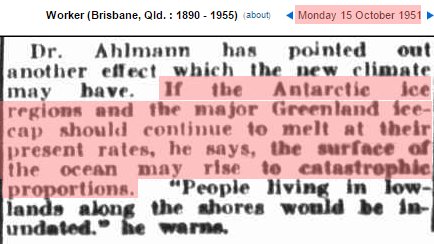
Scambos is pushing exactly the same fairy tale which scientists were using to raise money 70 years ago.
31 May 1947 – TEMPERATURES RISING IN ARCTIC REGION LOS ANGELES…
It is all about the money and politics. This has nothing to do with science.
On October 1, NOAA’s cone of certainty for Joaquin extended from North Carolina to long Island. Six days later they are certain Joaquin is headed for somewhere around Ireland.
Their certainty is quite literally all over the map.

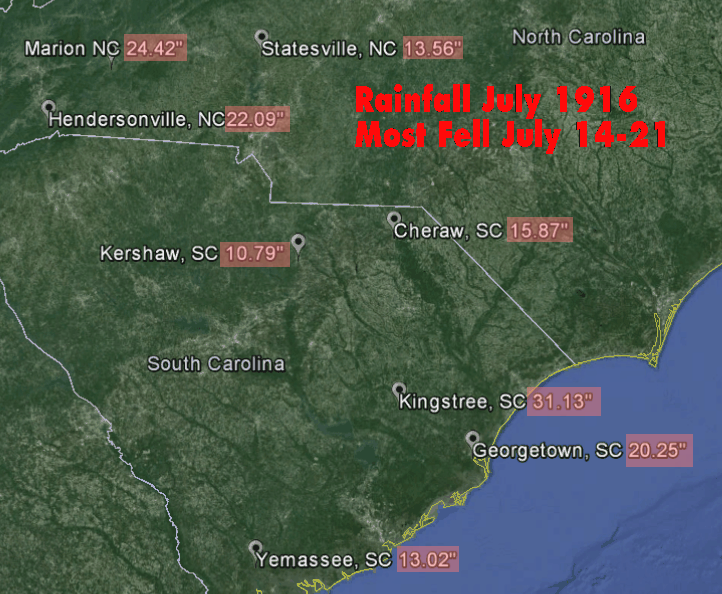
USGS has made the press hysterical with their fake “thousand year rain” claim in South Carolina, which is now “biblical.” They pulled exactly the same nonsense here in Colorado two years ago.
Note the small region in NE South Carolina which received 16 inches of rain, and that Texas got more rain this week than South Carolina.
Apparently 1916 was more than one thousand years ago, because they had very similar rainfall during July, 1916. The same region received more than 16″ of rain from July 14-16. For the month of July 1916, almost the entire region was over 10″ with totals as high as 35″ in North Carolina
It is all propaganda, all the time. Just like it was in 1871.
10 Jan 1871 – IMAGINARY CHANGES OF CLIMATE. (Pall Mall Gazette.)
Every time we get a big rain in the US, climate morons start claiming it was a 1,000 year event
So what are they doing wrong?
Your odds of winning the lottery are very small, but the odds of someone winning the lottery are quite high. What these geniuses are doing is conflating the odds of one individual station getting a 20 inch rain, with the odds of any station getting a 20 inch rain.
Big rains are not rare in the US. Alvin, Texas got 43 inches of rain in one day in 1979.
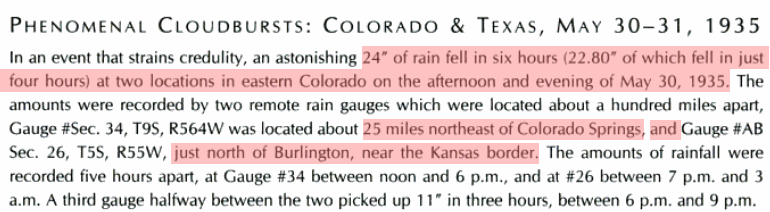
We heard exactly the same 1,000 year nonsense after the 20 inch rains of 2013 in Colorado, but Colorado got 24 inches of rain in six hours in 1935.
There are records of many other comparable rains in the US, but people make the same mistake generation after generation.
10 Jan 1871 – IMAGINARY CHANGES OF CLIMATE. (Pall Mall Gazette.)
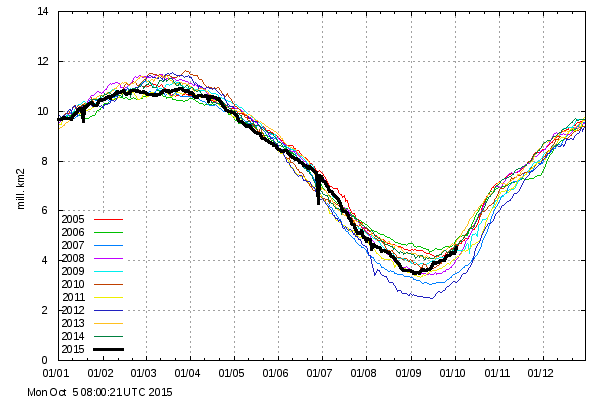
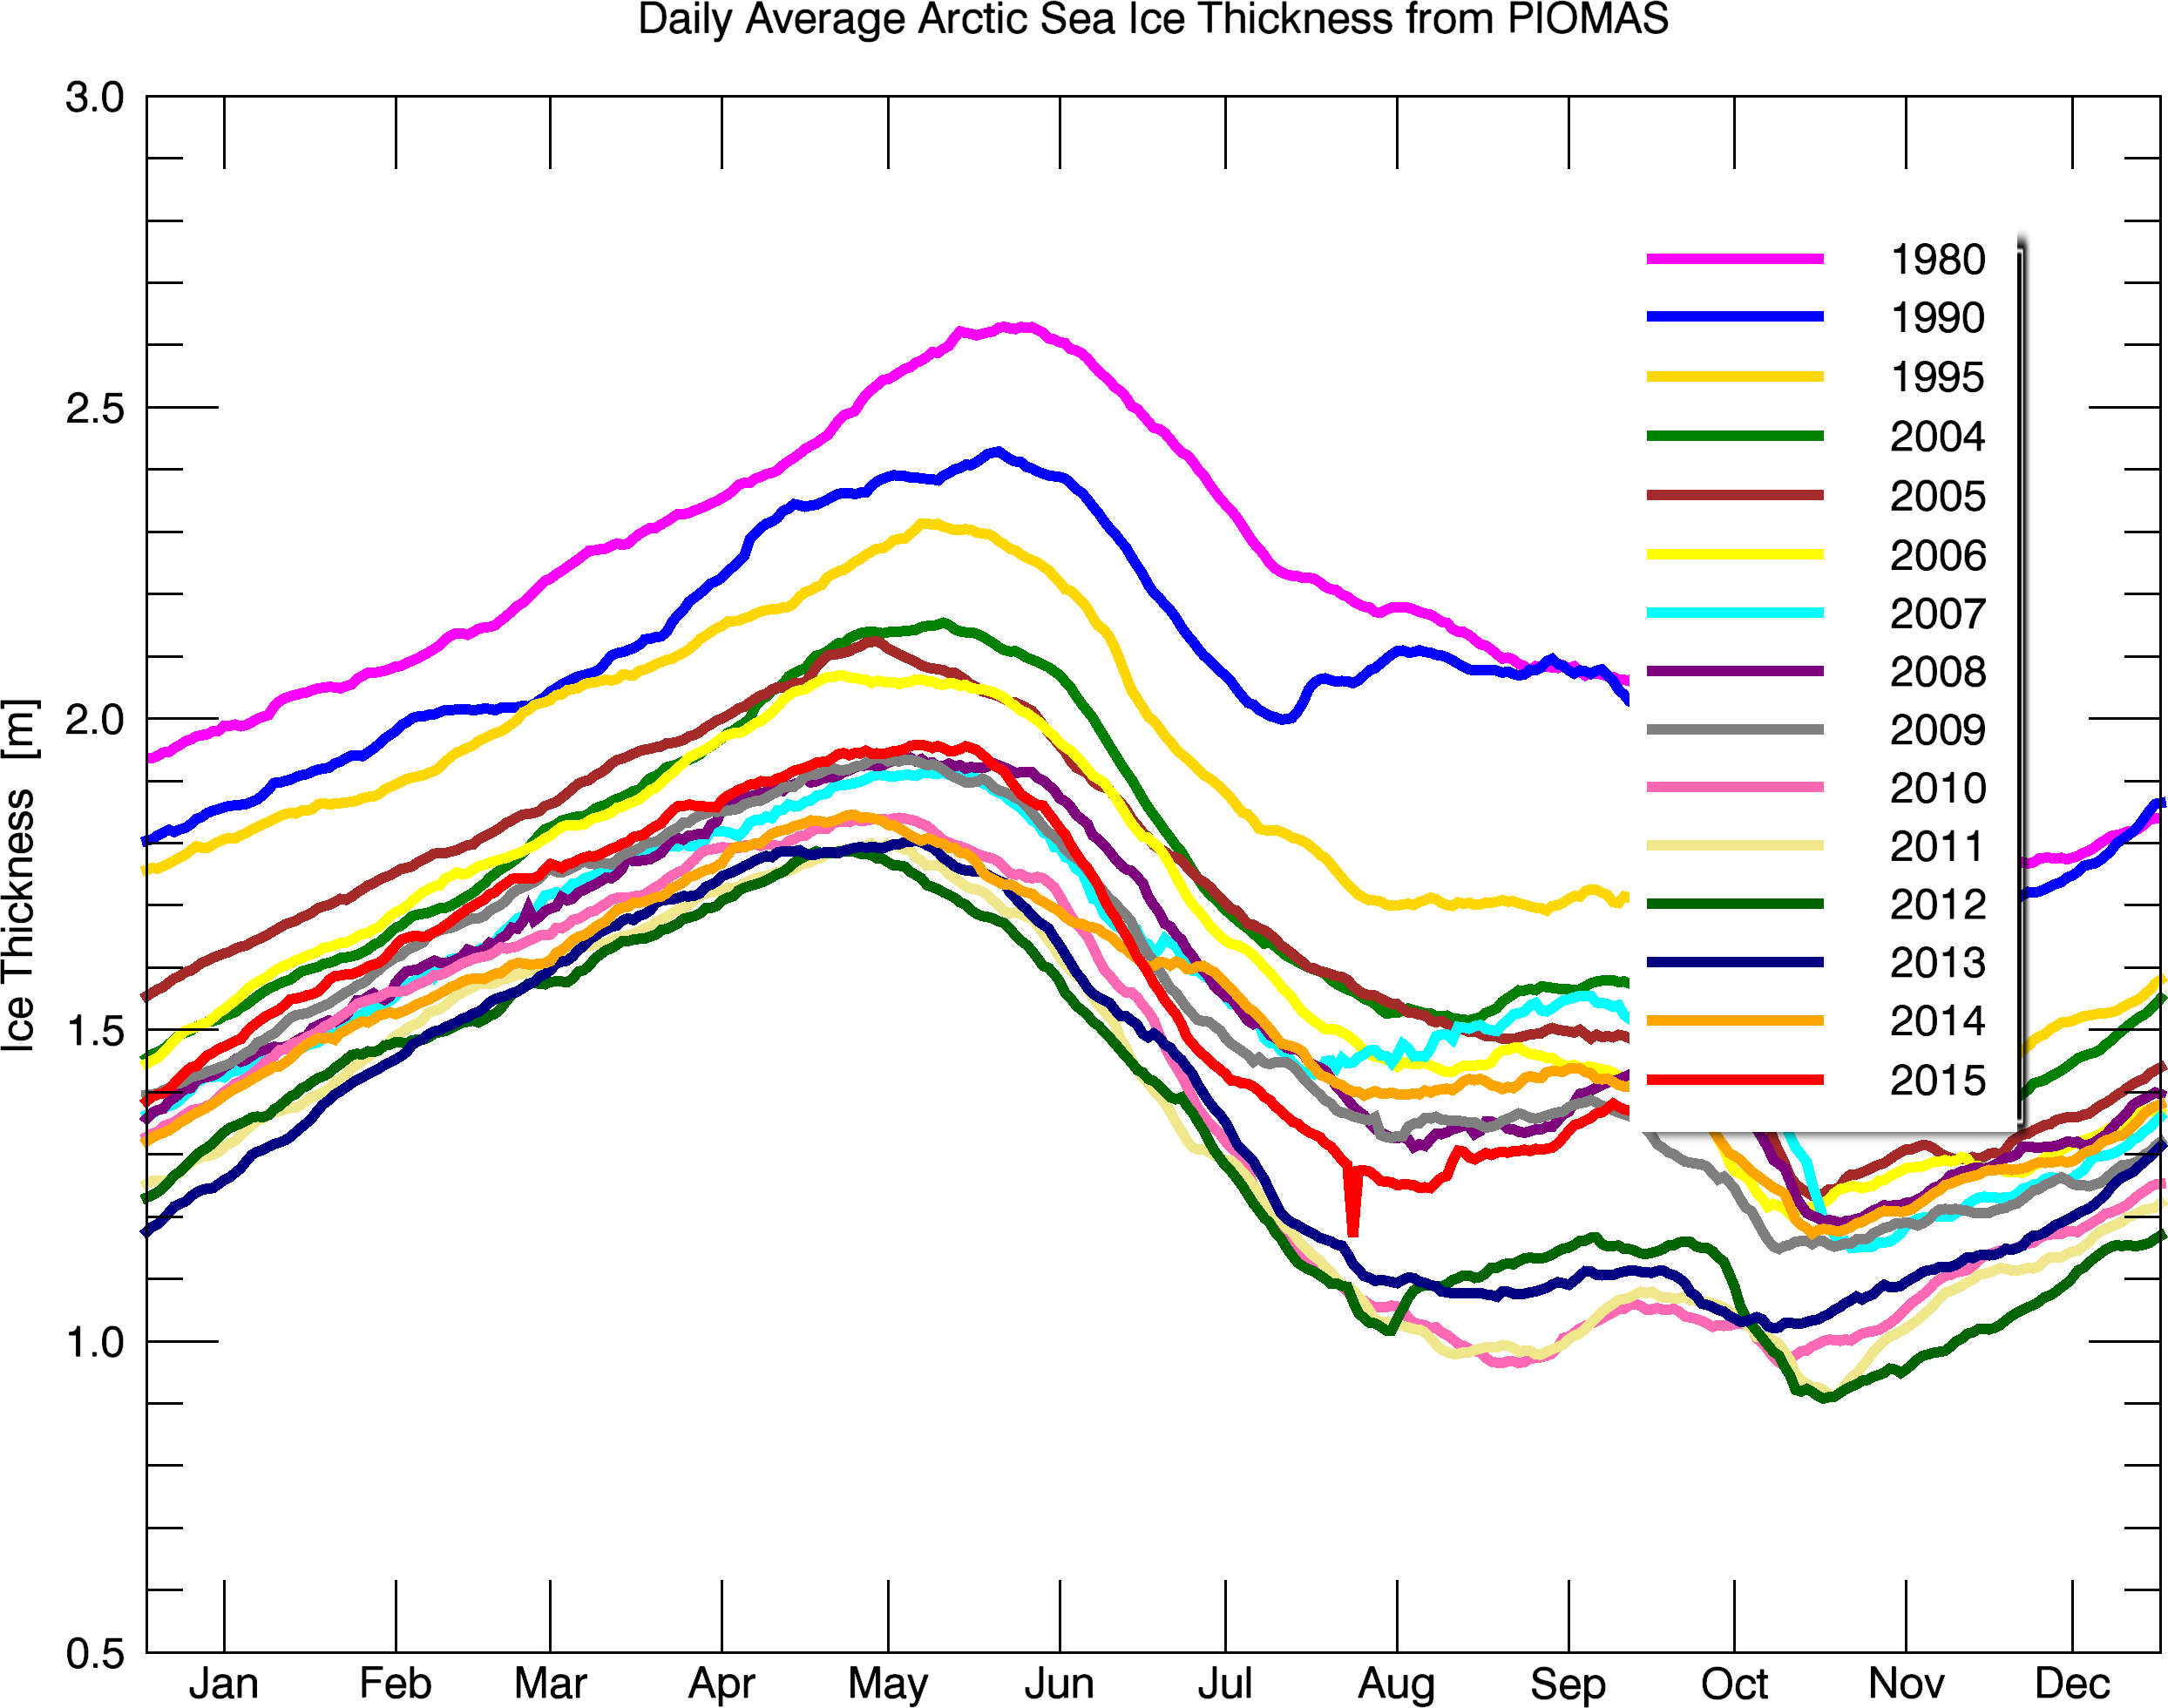
After the shortest melt season on record, and record growth of sea ice in September, Arctic sea ice extent is now the second highest in the DMI record for the date.
Ocean and Ice Services | Danmarks Meteorologiske Institut
Ice thickness has increased by 40% over the past five years.
NASA’s top climate prophet says the Arctic is ice-free.
The Argus-Press – Jun 24, 2008
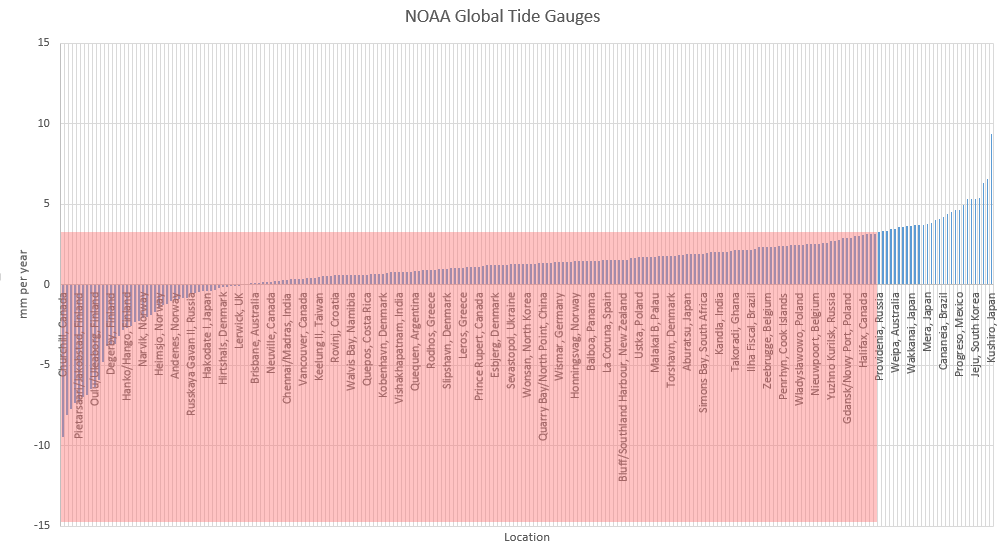
Incredible fraud from the EPA and CSIRO. The EPA now claims that tide gauges show sea level rising faster than satellites, with 3 inches (76 mm) sea level rise since 1990. That 3.0 mm/year.
Earlier versions of this same graph showed the exact opposite, that tide gauge rates were slower than satellites. Apparently someone at EPA recently tampered with it to make it scarier.
The EPA tide gauge claim of 3 mm/year is almost double what NOAA calculates
absolute global sea level rise is believed to be 1.7-1.8 millimeters/year
But it is worse than it seems. 85% of NOAA tide gauges report less sea level rise than the EPA claims is the average for tide gauges.
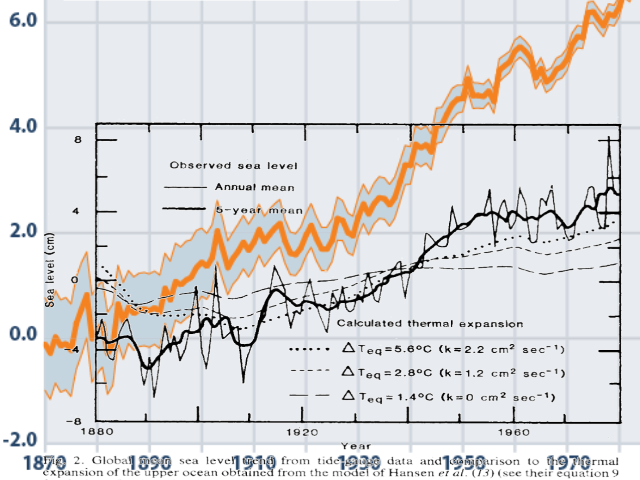
In 1982, NASA showed just over three inches of sea level rise from 1880 to 1980, compared to double that amount in EPA/CSIRO graph.
The next image overlays the EPA/CSIRO graph on the 1982 NASA graph at the same scale. The EPA data is completely fake.
The EPA claims are in direct contradiction to current NOAA and earlier EPA and NASA data. But they have a political agenda being directed by the White House, and facts are not allowed to interfere.


