


Disrupting the Borg is expensive and time consuming!

Google Search
-
Recent Posts
- One Atomic Bomb Per Hour
- New Video : Analyzing Oil And Gas
- Is Antarctica Melting?
- High Speed Analysis And Visualization
- El Nino To The Rescue?
- Fake News Update
- Growth Of Antarctic Sea Ice
- 65 Years Of Progress!
- El Nino To The Rescue?
- Worst March Drought On Record
- ChartGL Process Control Demo
- The Biggest Money Laundering Scam
- Drought In The Headwaters Of Lake Powell
- Unrealistic Expectations Of Water Availability
- Did Bill Gates Do This?
- Worst March Drought On Record In The US
- The Real Hockey Stick Graph
- Analyzing The Western Water Crisis
- Gaslighting 1924
- “Why Do You Resist?”
- Climate Attribution Model
- Fact Checking NASA
- Fact Checking Grok
- Fact Checking The New York Times
- New Visitech Features
June 2026 M T W T F S S 1 2 3 4 5 6 7 8 9 10 11 12 13 14 15 16 17 18 19 20 21 22 23 24 25 26 27 28 29 30 Recent Comments
- Bob G on One Atomic Bomb Per Hour
- Bill on One Atomic Bomb Per Hour
- Bob G on One Atomic Bomb Per Hour
- Bob G on One Atomic Bomb Per Hour
- Bob G on One Atomic Bomb Per Hour
- Disillusioned on One Atomic Bomb Per Hour
- Disillusioned on One Atomic Bomb Per Hour
- Bob G on One Atomic Bomb Per Hour
- arn on One Atomic Bomb Per Hour
- Bob G on One Atomic Bomb Per Hour
All The Fake News That Is Unfit To Read
“A newspaper is a device for making the ignorant more ignorant and the crazy crazier.”
– H. L. Mencken
Posted in Uncategorized
Leave a comment
Fly The Infected Skies Of United
Three days ago, Bloomberg was bragging about almost 100% injected United Airlines.

Thousands of their workers are calling in sick.

Turbulence Hits United Air As 3,000 Employees Infected With COVID | ZeroHedge
Posted in Uncategorized
Leave a comment
Thirty Years Of Fake CO2 Agreements
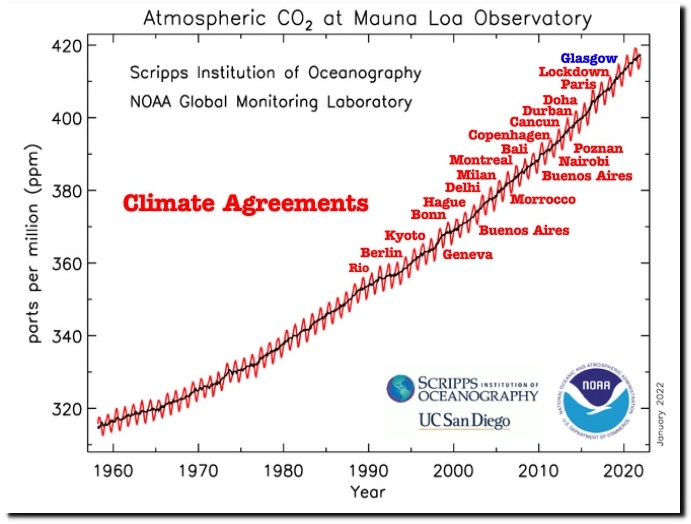
Global Monitoring Laboratory – Carbon Cycle Greenhouse Gases
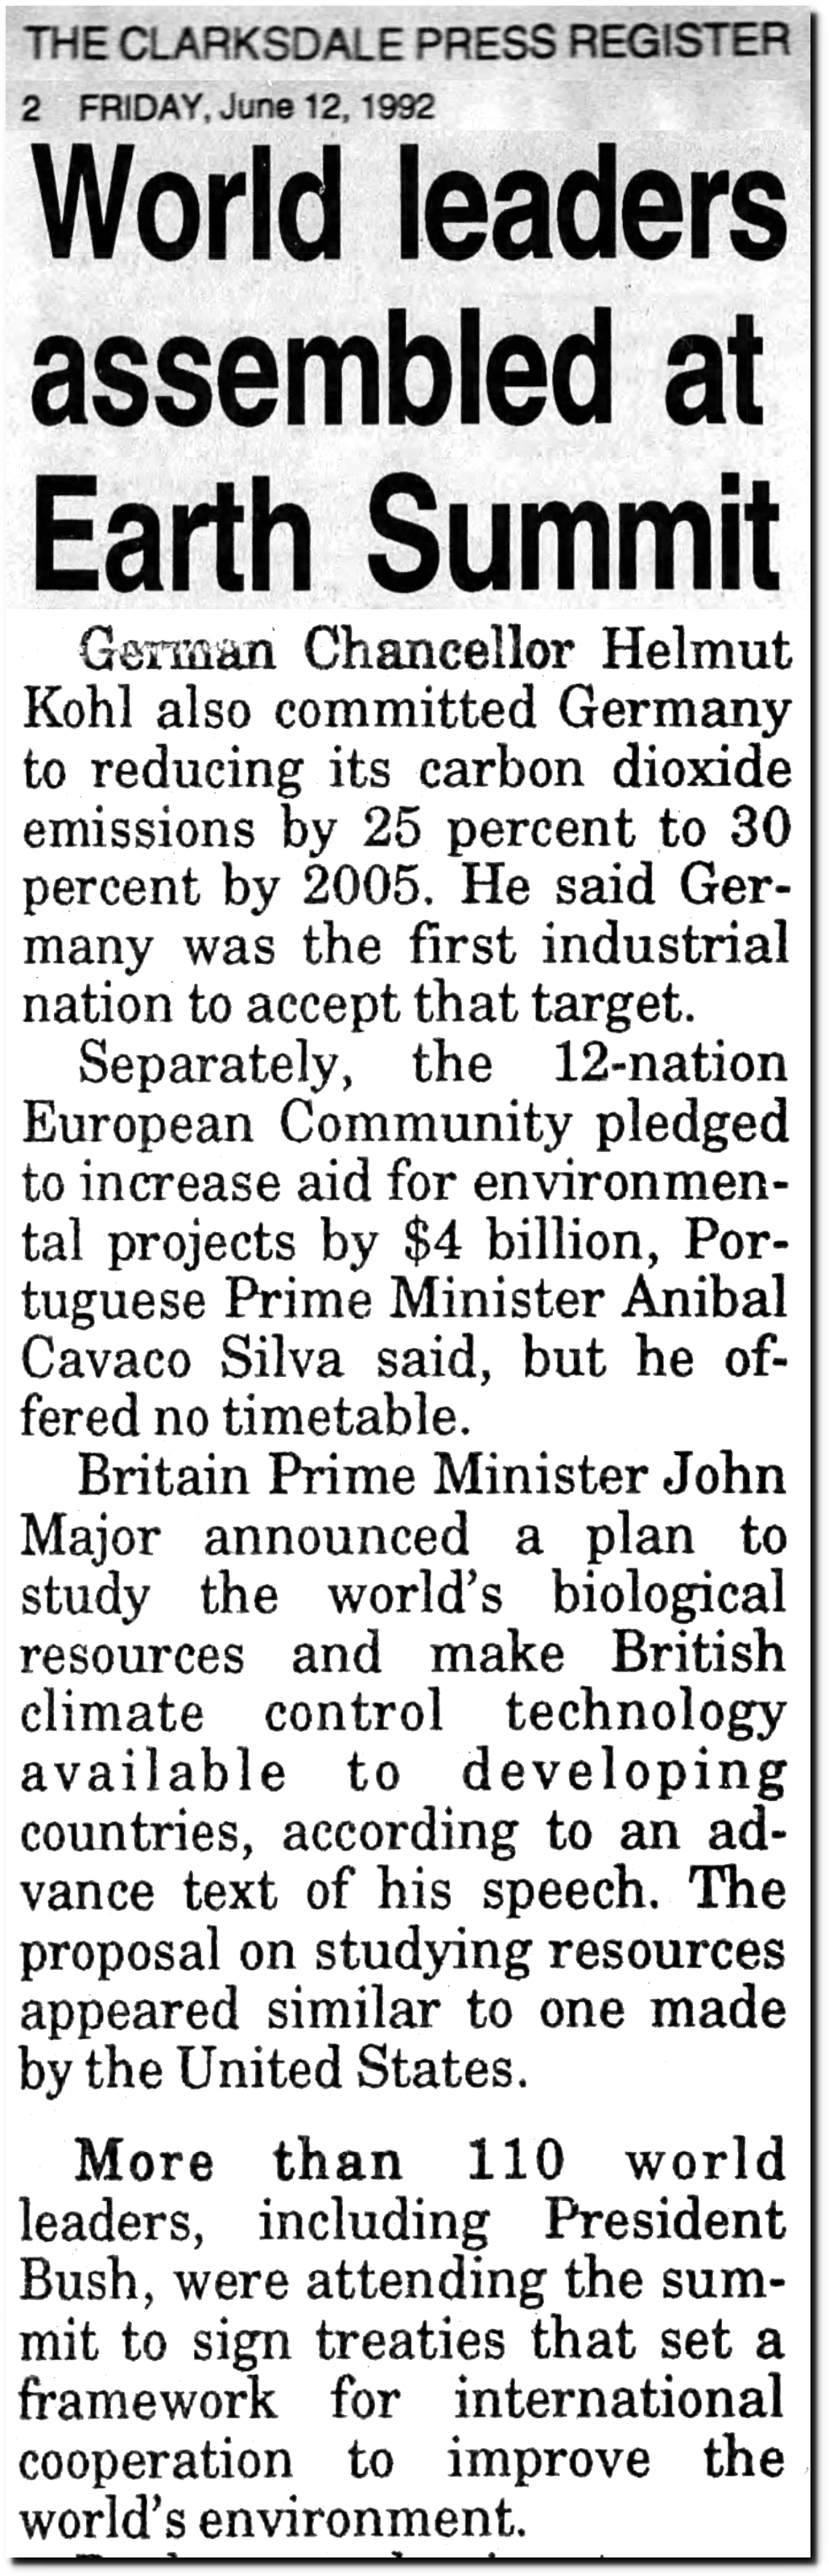
12 Jun 1992, 1 – The Clarksdale Press Register at Newspapers.com
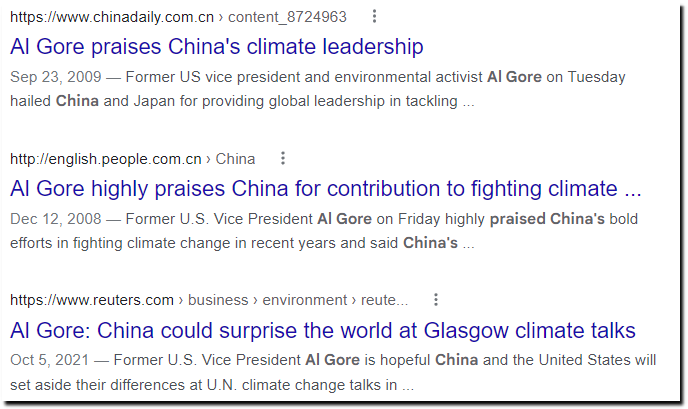
As Chinese CO2 emissions skyrocket, Al Gore praises their leadership.

Annual CO? emissions from coal
Posted in Uncategorized
Leave a comment
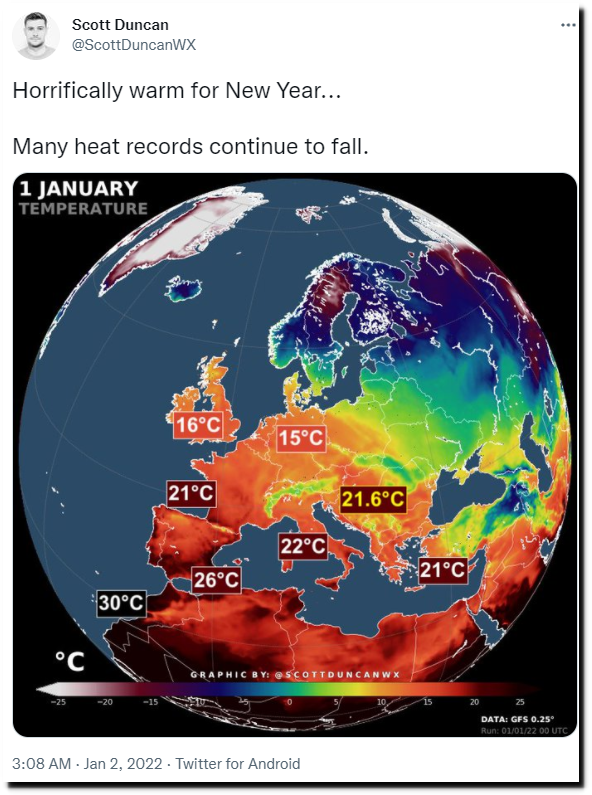
Nice Weather Is “Horrific”
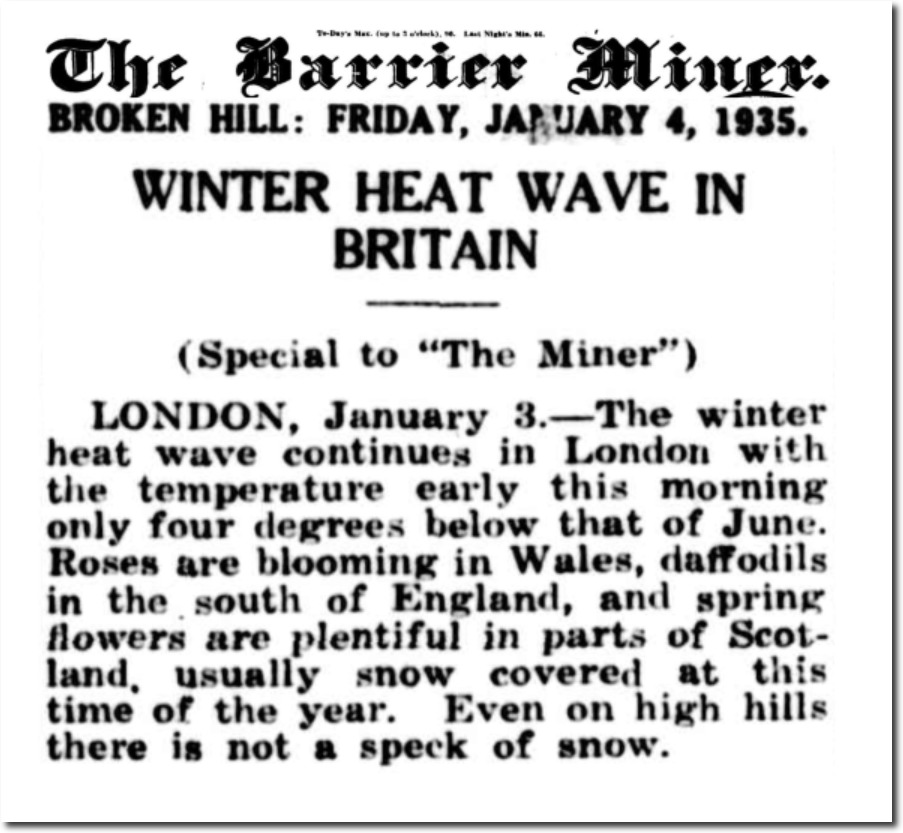
The winter heat wave continues in London with the temperature early this morning only four degrees below that of June. Roses are blooming in Wales, daffodils in the south of England, and spring flowers are plentiful in parts of Scotland, usually snow covered at this time of the year. Even on high hills there is not a speck of snow.
January 4, 1935
Posted in Uncategorized
Leave a comment
Hottest Years Ever

The past seven years have been Earth’s hottest on record and there’s no signs of ‘slowing down
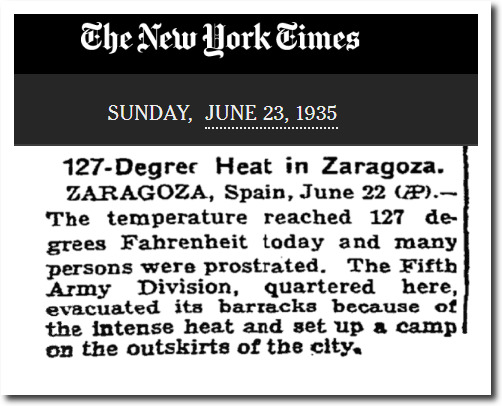
127-Degree Heat in Zaragoza. – The New York Times
Arctic sea ice extent is the highest in eighteen years.
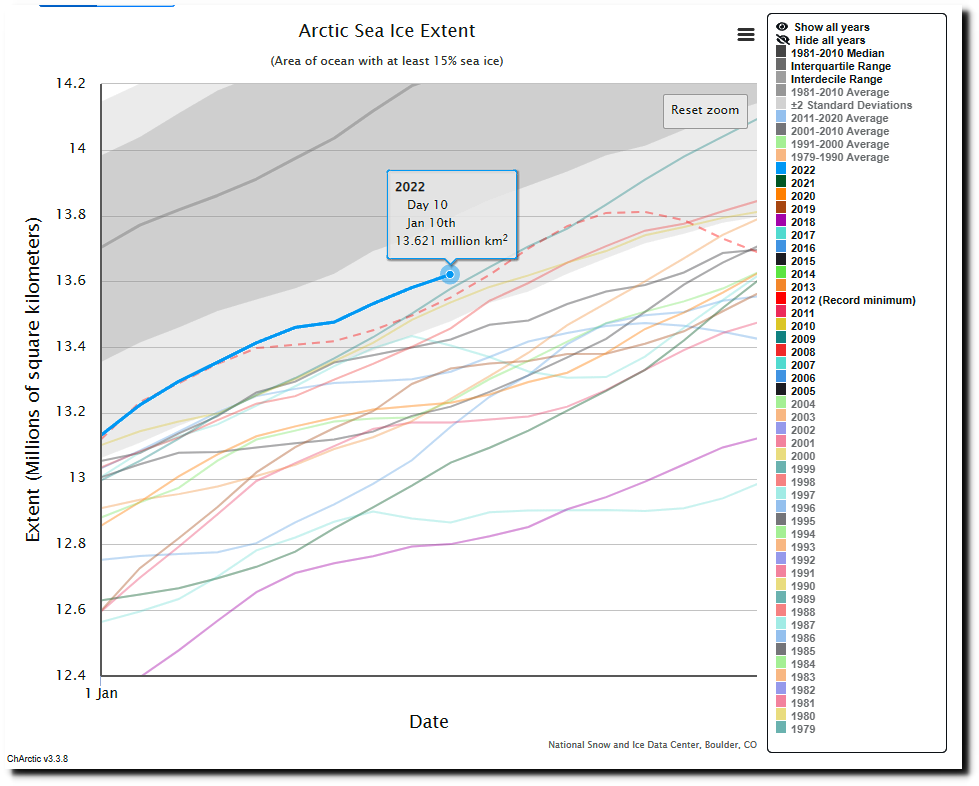
Charctic Interactive Sea Ice Graph | Arctic Sea Ice News and Analysis
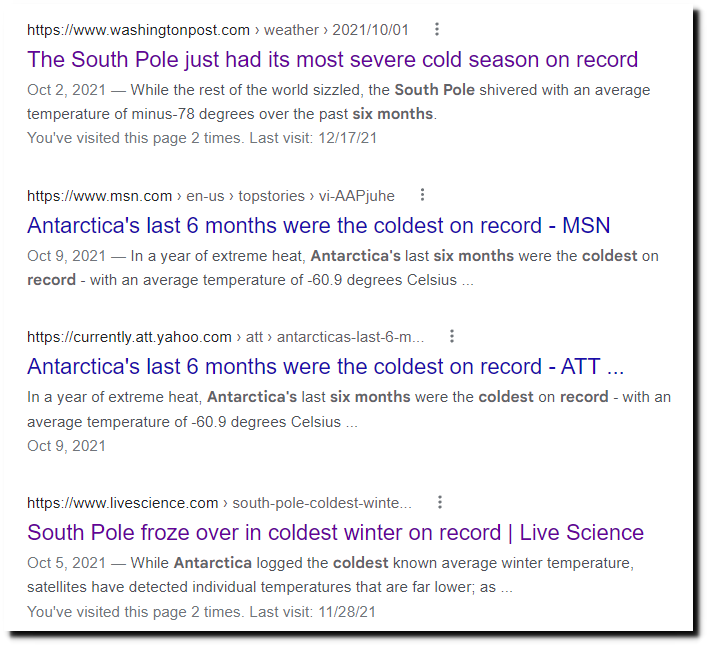
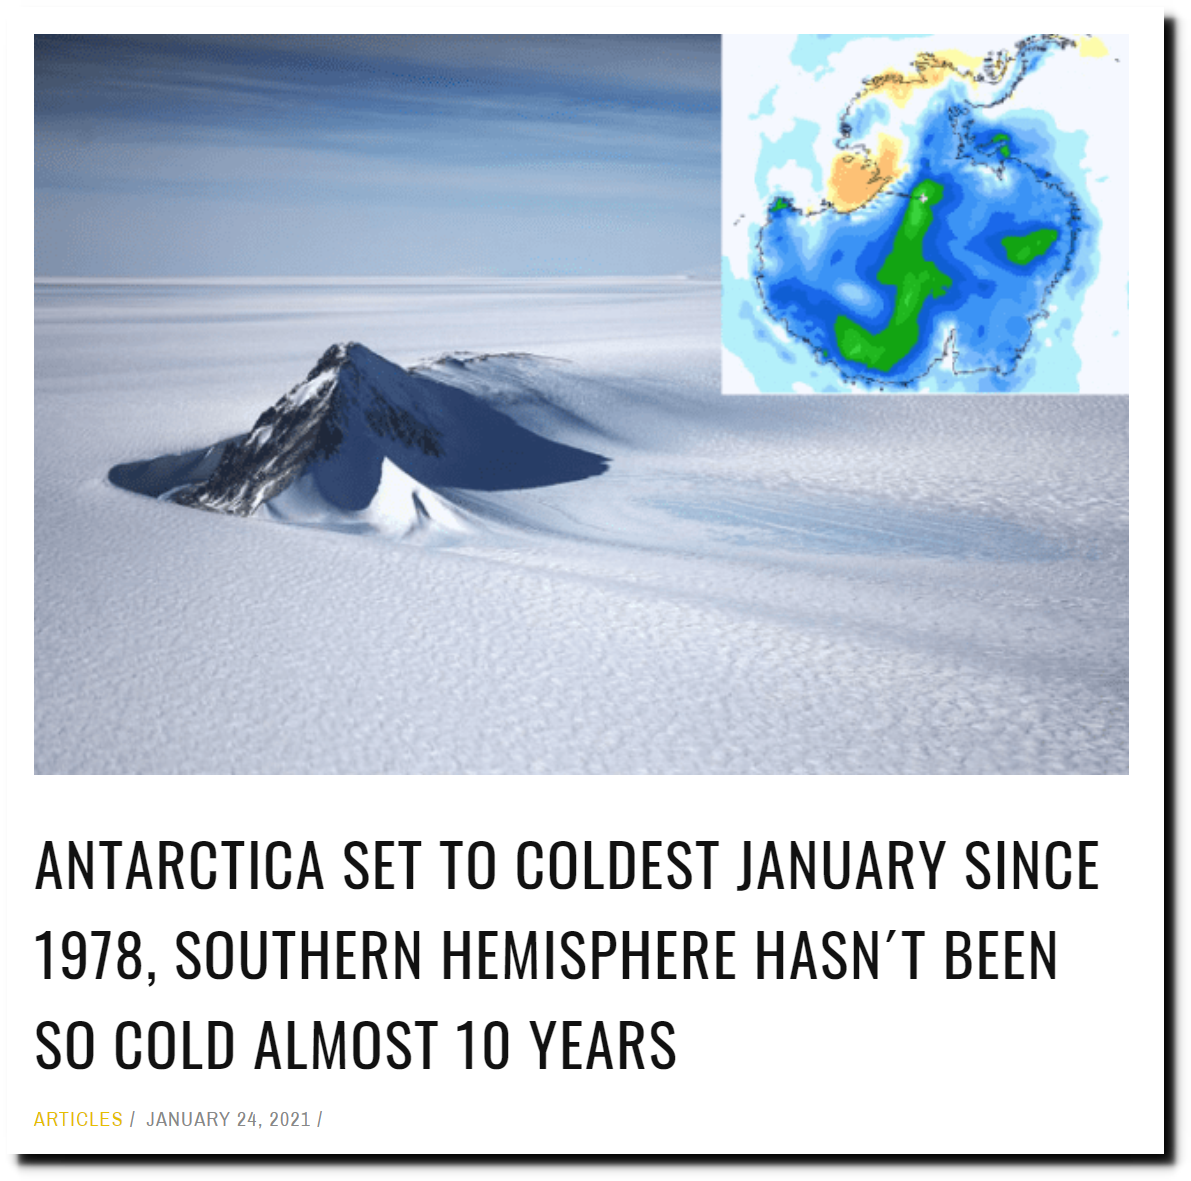
Last January was the coldest in Antarctica since 1978.

UAH Global Temperature Update for December, 2021: +0.21 deg. C. « Roy Spencer, PhD

According to the 1995 IPCC report, Greenland and Antarctica were much warmer 120,000 years ago.
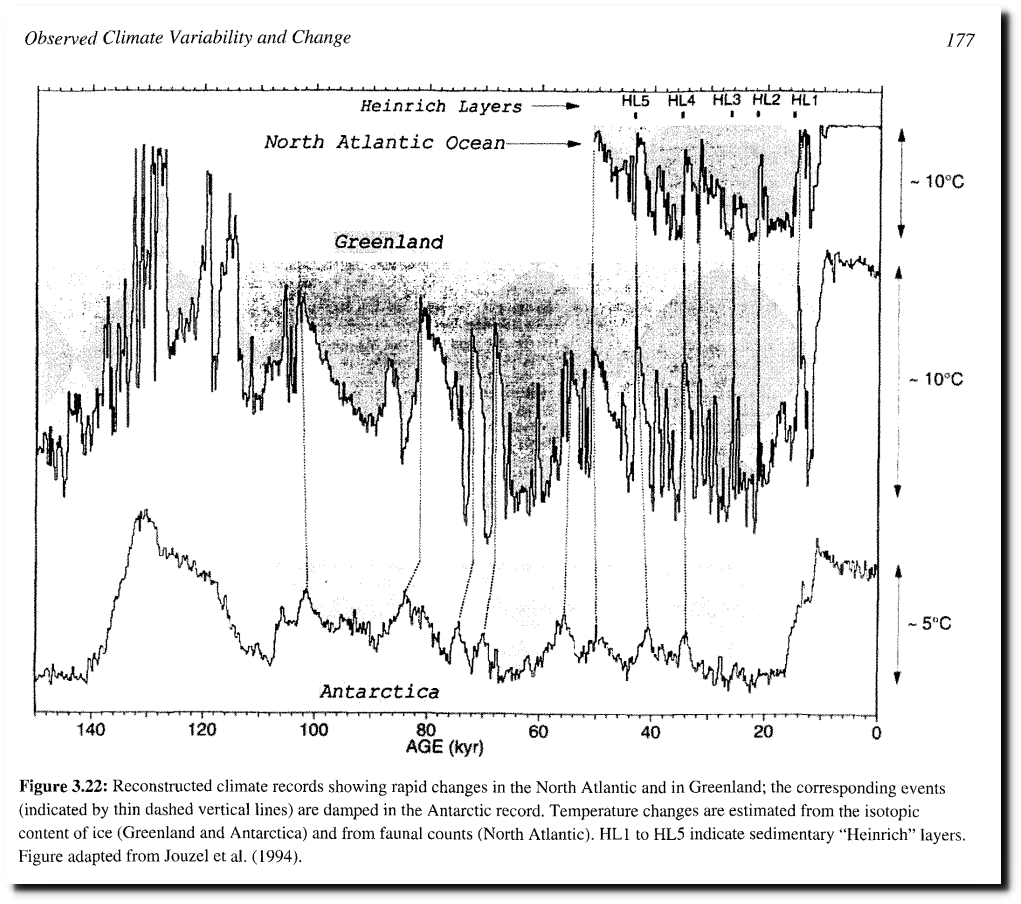
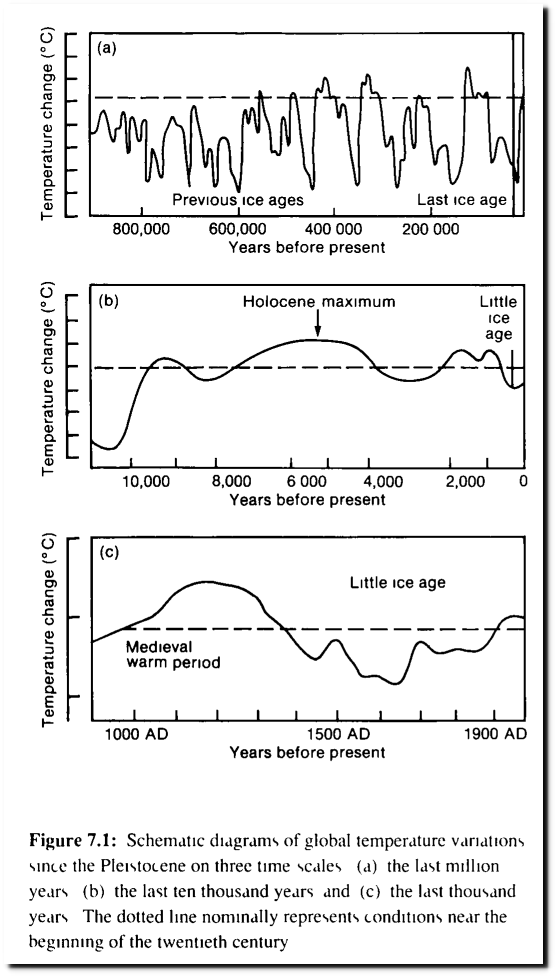
National Geographic Magazine Archive
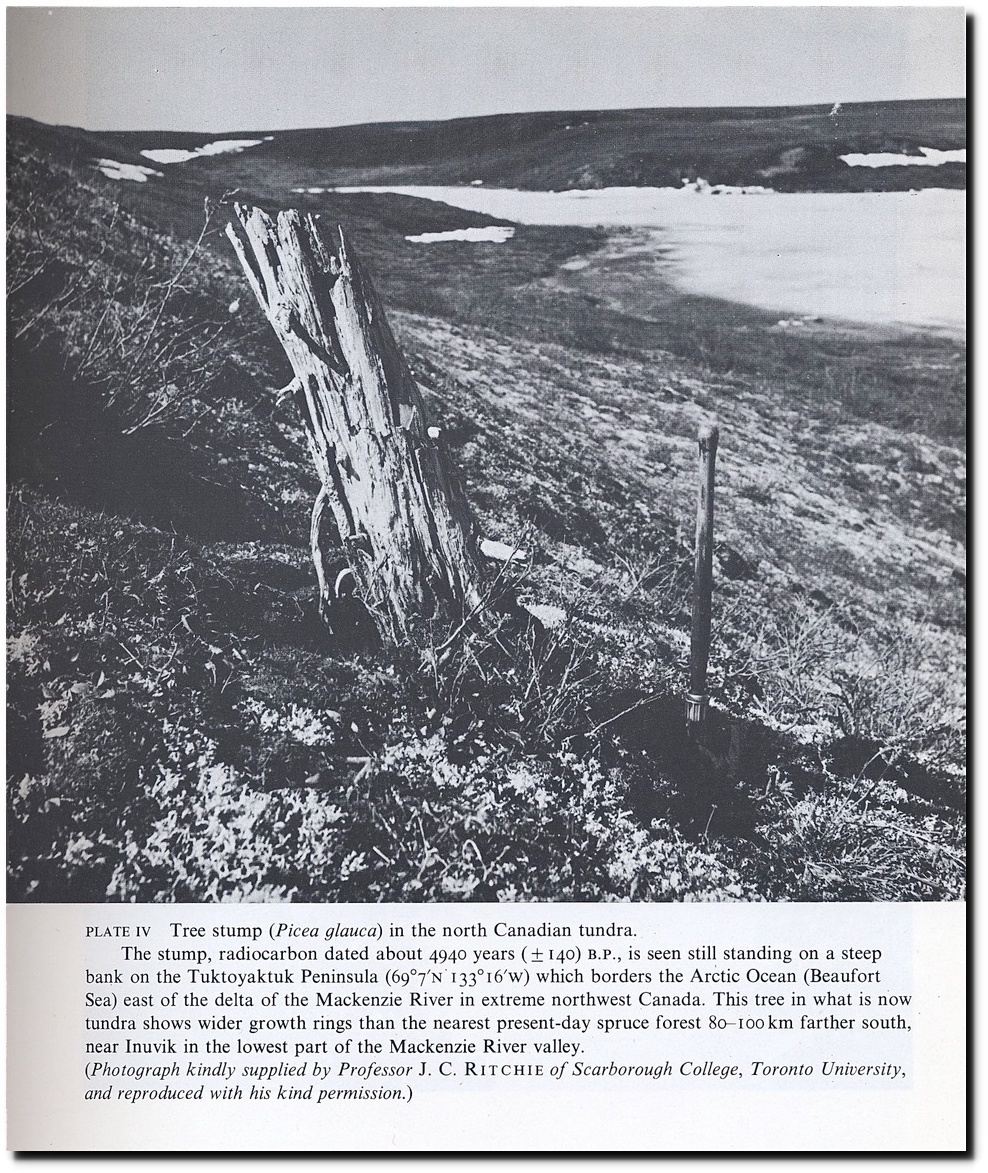
Less Ice In Arctic Ocean 6000-7000 Years Ago — ScienceDaily
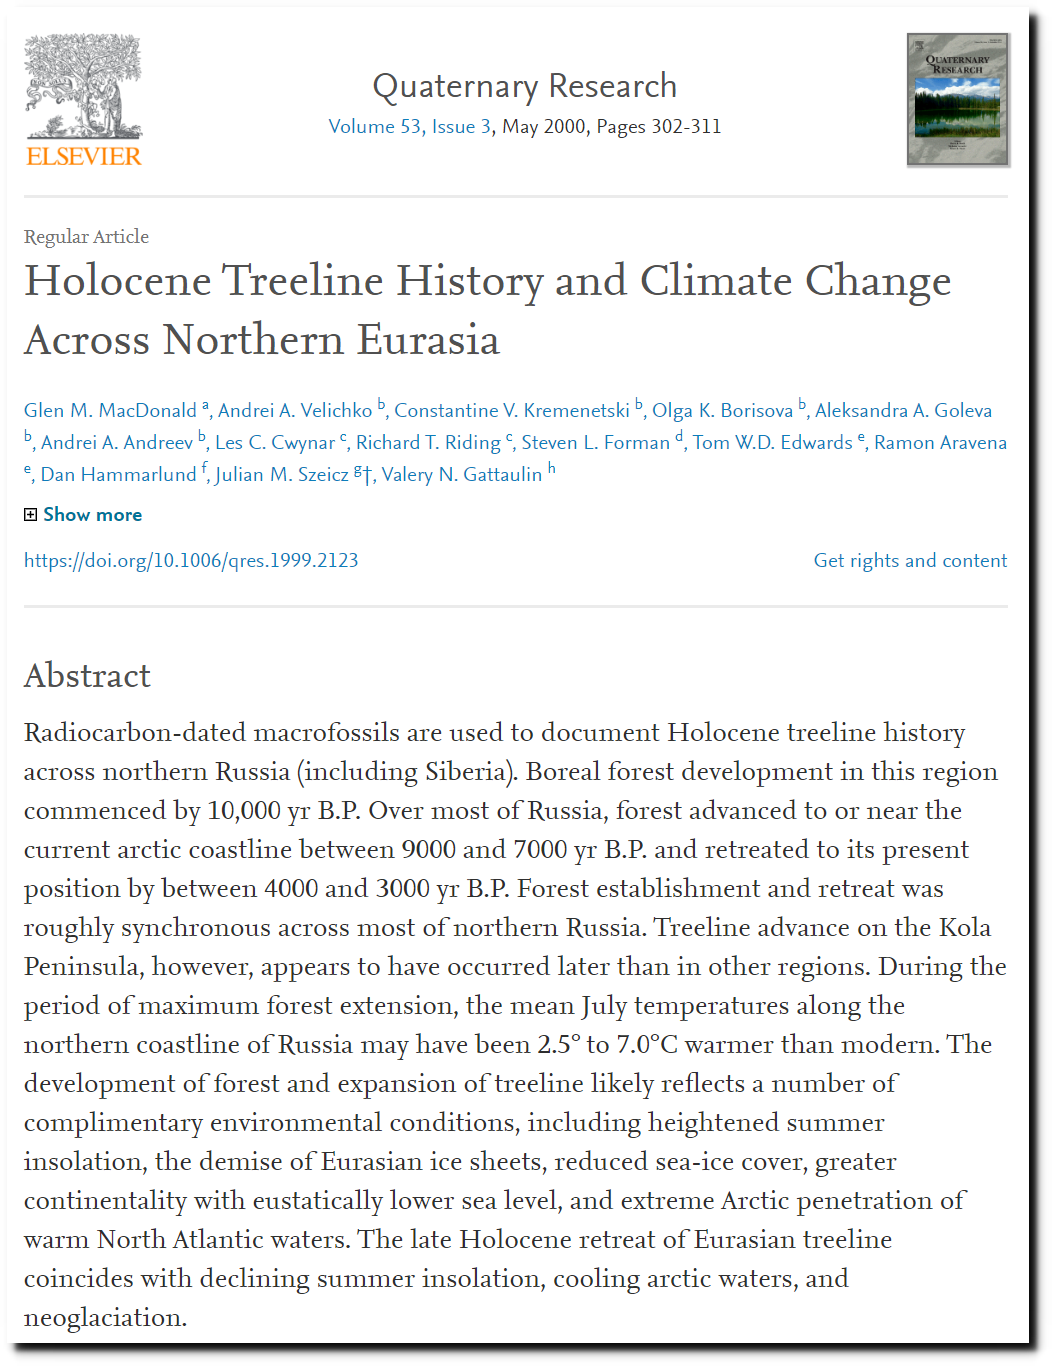
Holocene Treeline History and Climate Change Across Northern Eurasia – ScienceDirect
Fifty-three million years ago, palm trees grew in Antarctica.
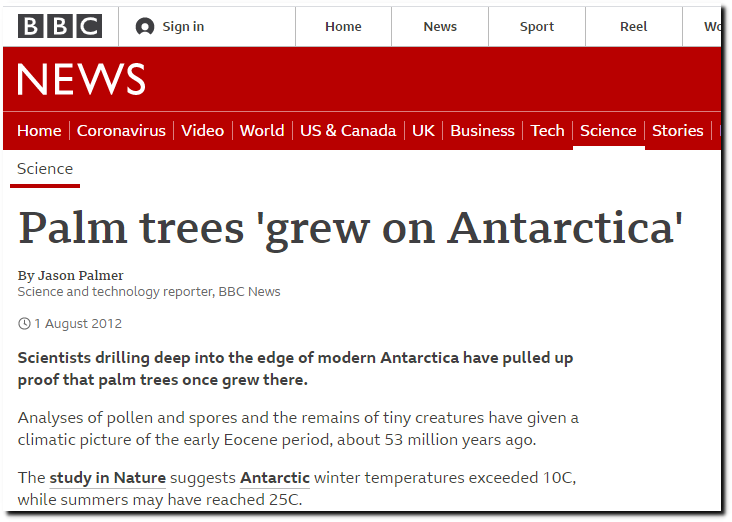
Palm trees ‘grew on Antarctica’ – BBC News
There were crocodiles and palm trees in the Arctic.

Crocodiles and Palm Trees in the Arctic? New Report Suggests Yes.
Posted in Uncategorized
Leave a comment
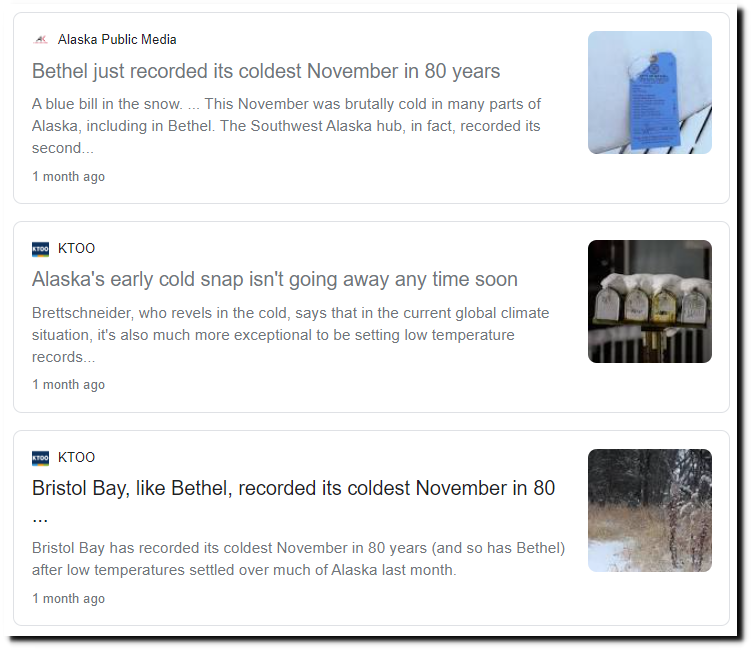
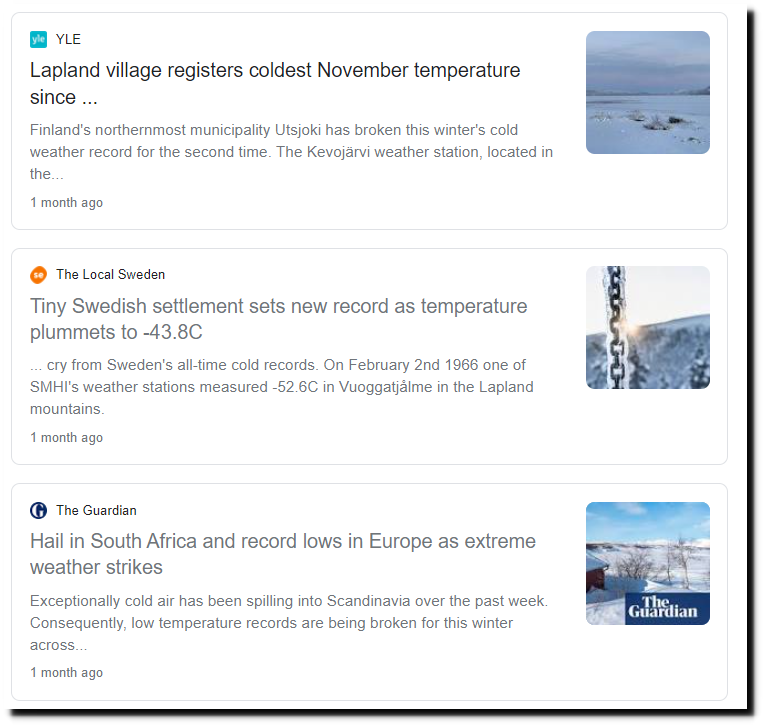
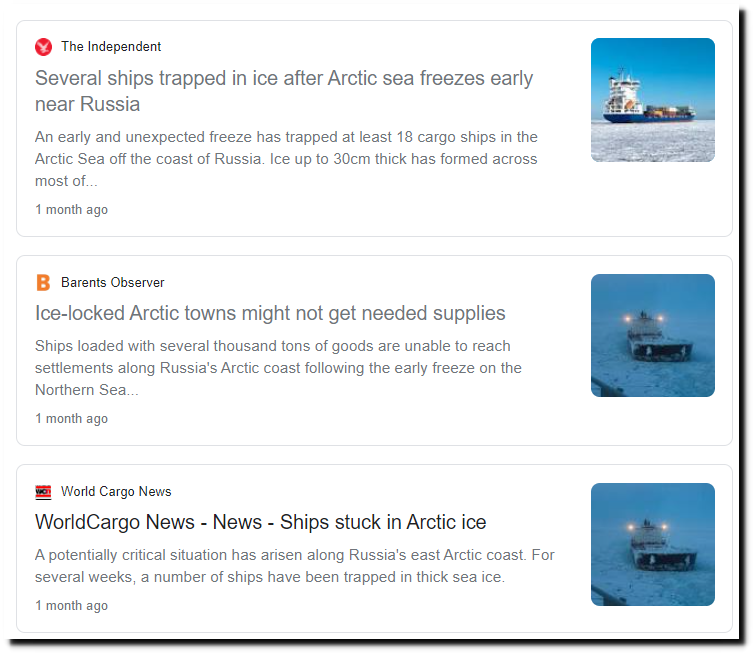
Arctic Reporting Report Card
The press corps has always lied to create fear and support government propaganda. There is nothing new about their non-stop disinformation campaign.
Posted in Uncategorized
Leave a comment
Clown World 2022
Posted in Uncategorized
Leave a comment
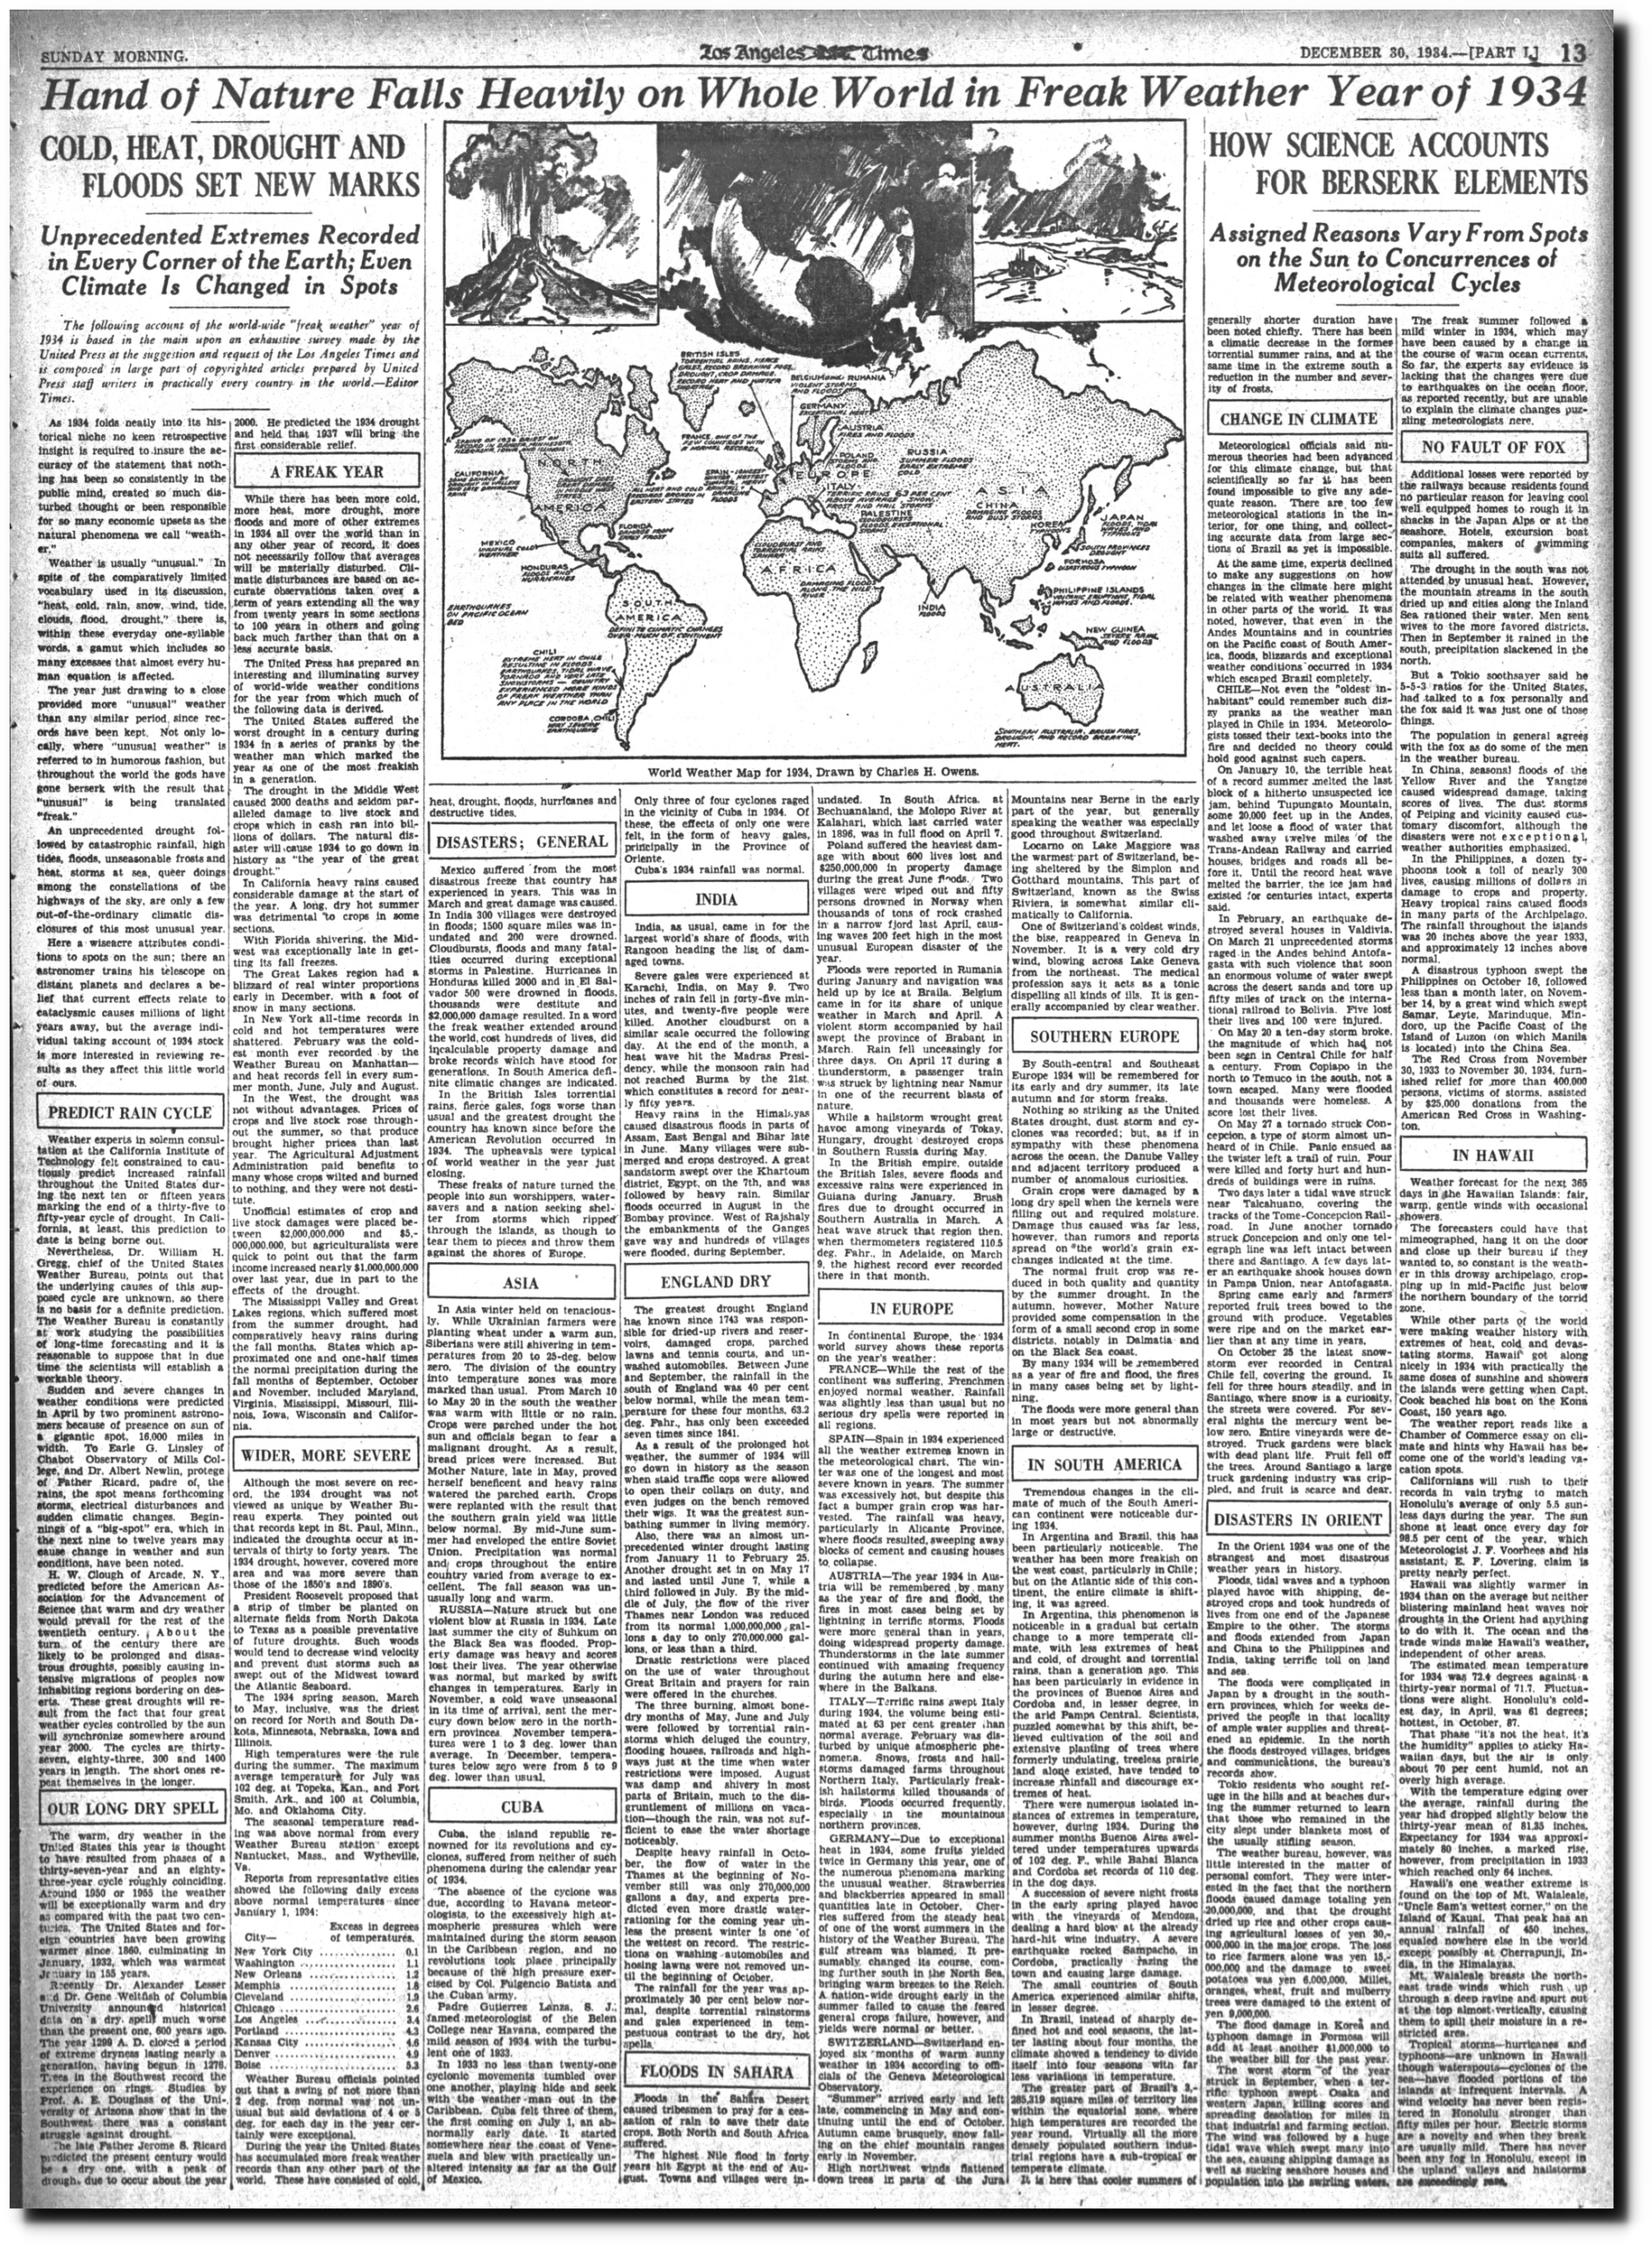
“Freak Weather Year Of 1934”
“COLD, HEAT, DROUGHT AND FLOODS SET NEW MARKS Unprecedented Extremes Recorded in Every Corner of the Earth”
Posted in Uncategorized
Leave a comment
1995 IPCC Report – Declining Hurricane Wind Speeds
The 1995 IPCC report showed that hurricane wind speeds were declining.
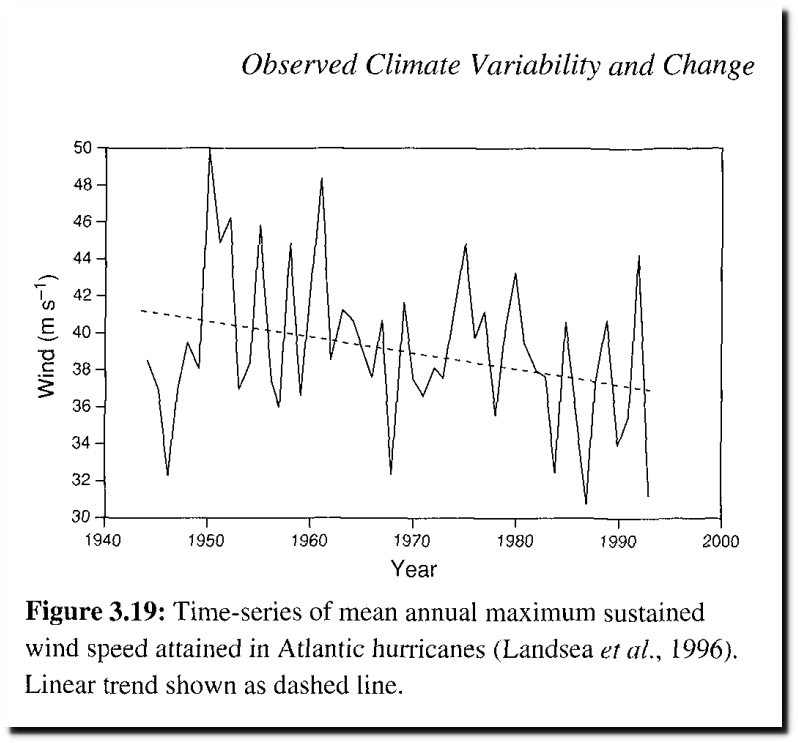
This contradicted claims made by Hansen and others in 1988.
“Global warming may increase the strength of hurricanes, posing a lethal threat to low-lying areas already facing inundation from rising sea levels, atmospheric scientists said Tues-day. At a major conference on global climate change, experts said warmer water temperatures could increase the power of hurricanes by 40 percent to 50 percent. They said while maximum hurricane winds peak at 175 mph now, they could reach 220 mph by the middle of the next century.”
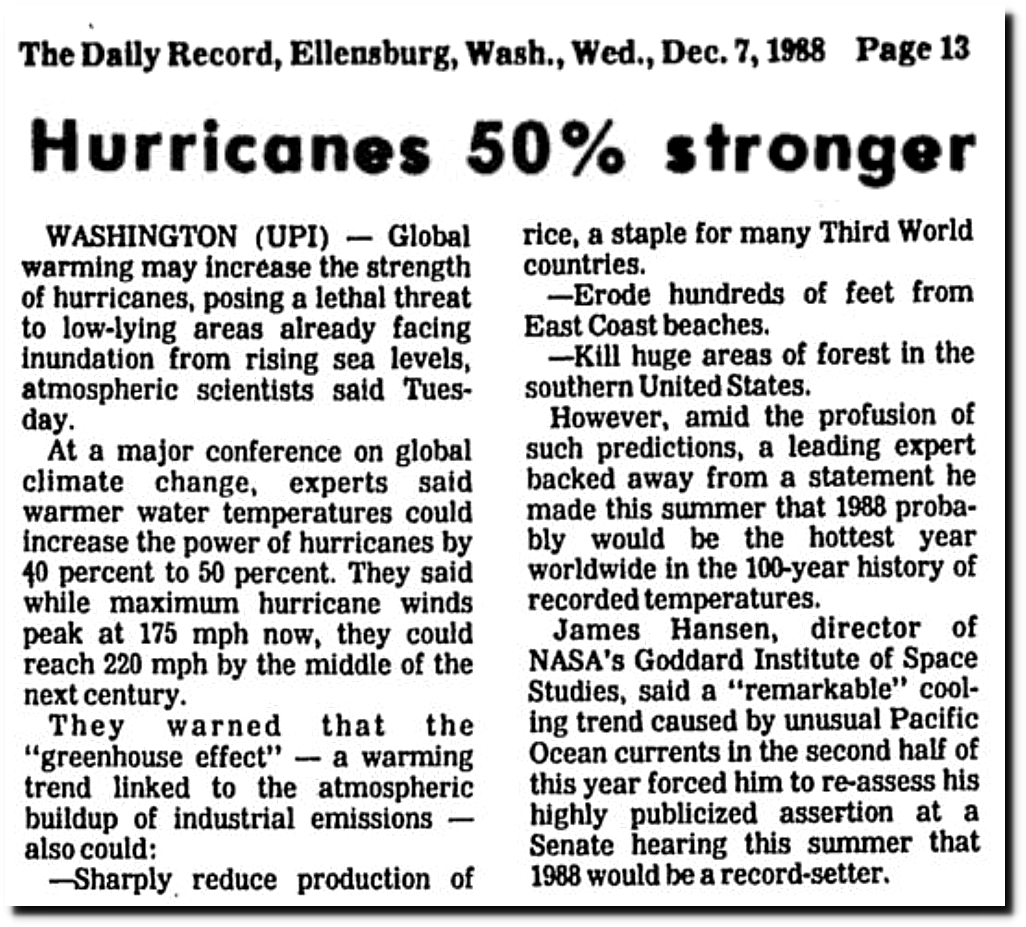
Ellensburg Daily Record – Google News Archive Search
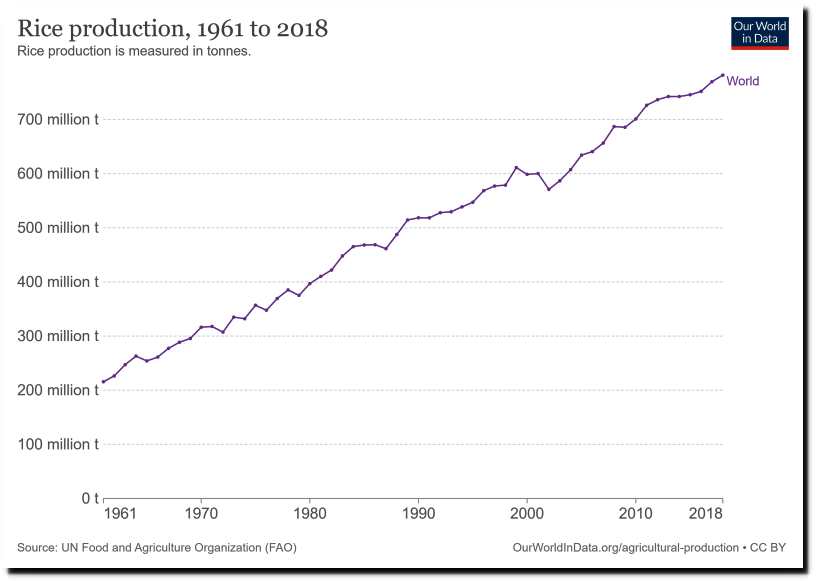
“They warned that the “greenhouse effect” — a warming trend linked to the atmospheric buildup of industrial emissions —also could: —Sharply reduce production of rice, a staple for many Third World countries.”
Posted in Uncategorized
Leave a comment