
Disrupting the Borg is expensive and time consuming!

Google Search
-
Recent Posts
- Is Antarctica Melting?
- High Speed Analysis And Visualization
- El Nino To The Rescue?
- Fake News Update
- Growth Of Antarctic Sea Ice
- 65 Years Of Progress!
- El Nino To The Rescue?
- Worst March Drought On Record
- ChartGL Process Control Demo
- The Biggest Money Laundering Scam
- Drought In The Headwaters Of Lake Powell
- Unrealistic Expectations Of Water Availability
- Did Bill Gates Do This?
- Worst March Drought On Record In The US
- The Real Hockey Stick Graph
- Analyzing The Western Water Crisis
- Gaslighting 1924
- “Why Do You Resist?”
- Climate Attribution Model
- Fact Checking NASA
- Fact Checking Grok
- Fact Checking The New York Times
- New Visitech Features
- Ice-Free Arctic By 2014
- Debt-Free US Treasury Forecast
Recent Comments
- conrad ziefle on Is Antarctica Melting?
- Gordon Vigurs on Is Antarctica Melting?
- Bob G on Is Antarctica Melting?
- conrad ziefle on High Speed Analysis And Visualization
- Bob G on 65 Years Of Progress!
- Bob G on 65 Years Of Progress!
- Gordon Vigurs on 65 Years Of Progress!
- arn on 65 Years Of Progress!
- arn on 65 Years Of Progress!
- Bob G on 65 Years Of Progress!
Vaccinations In India Had No Effect
The “delta variant” curve in India had already passed before they reached 20% vaccinations.
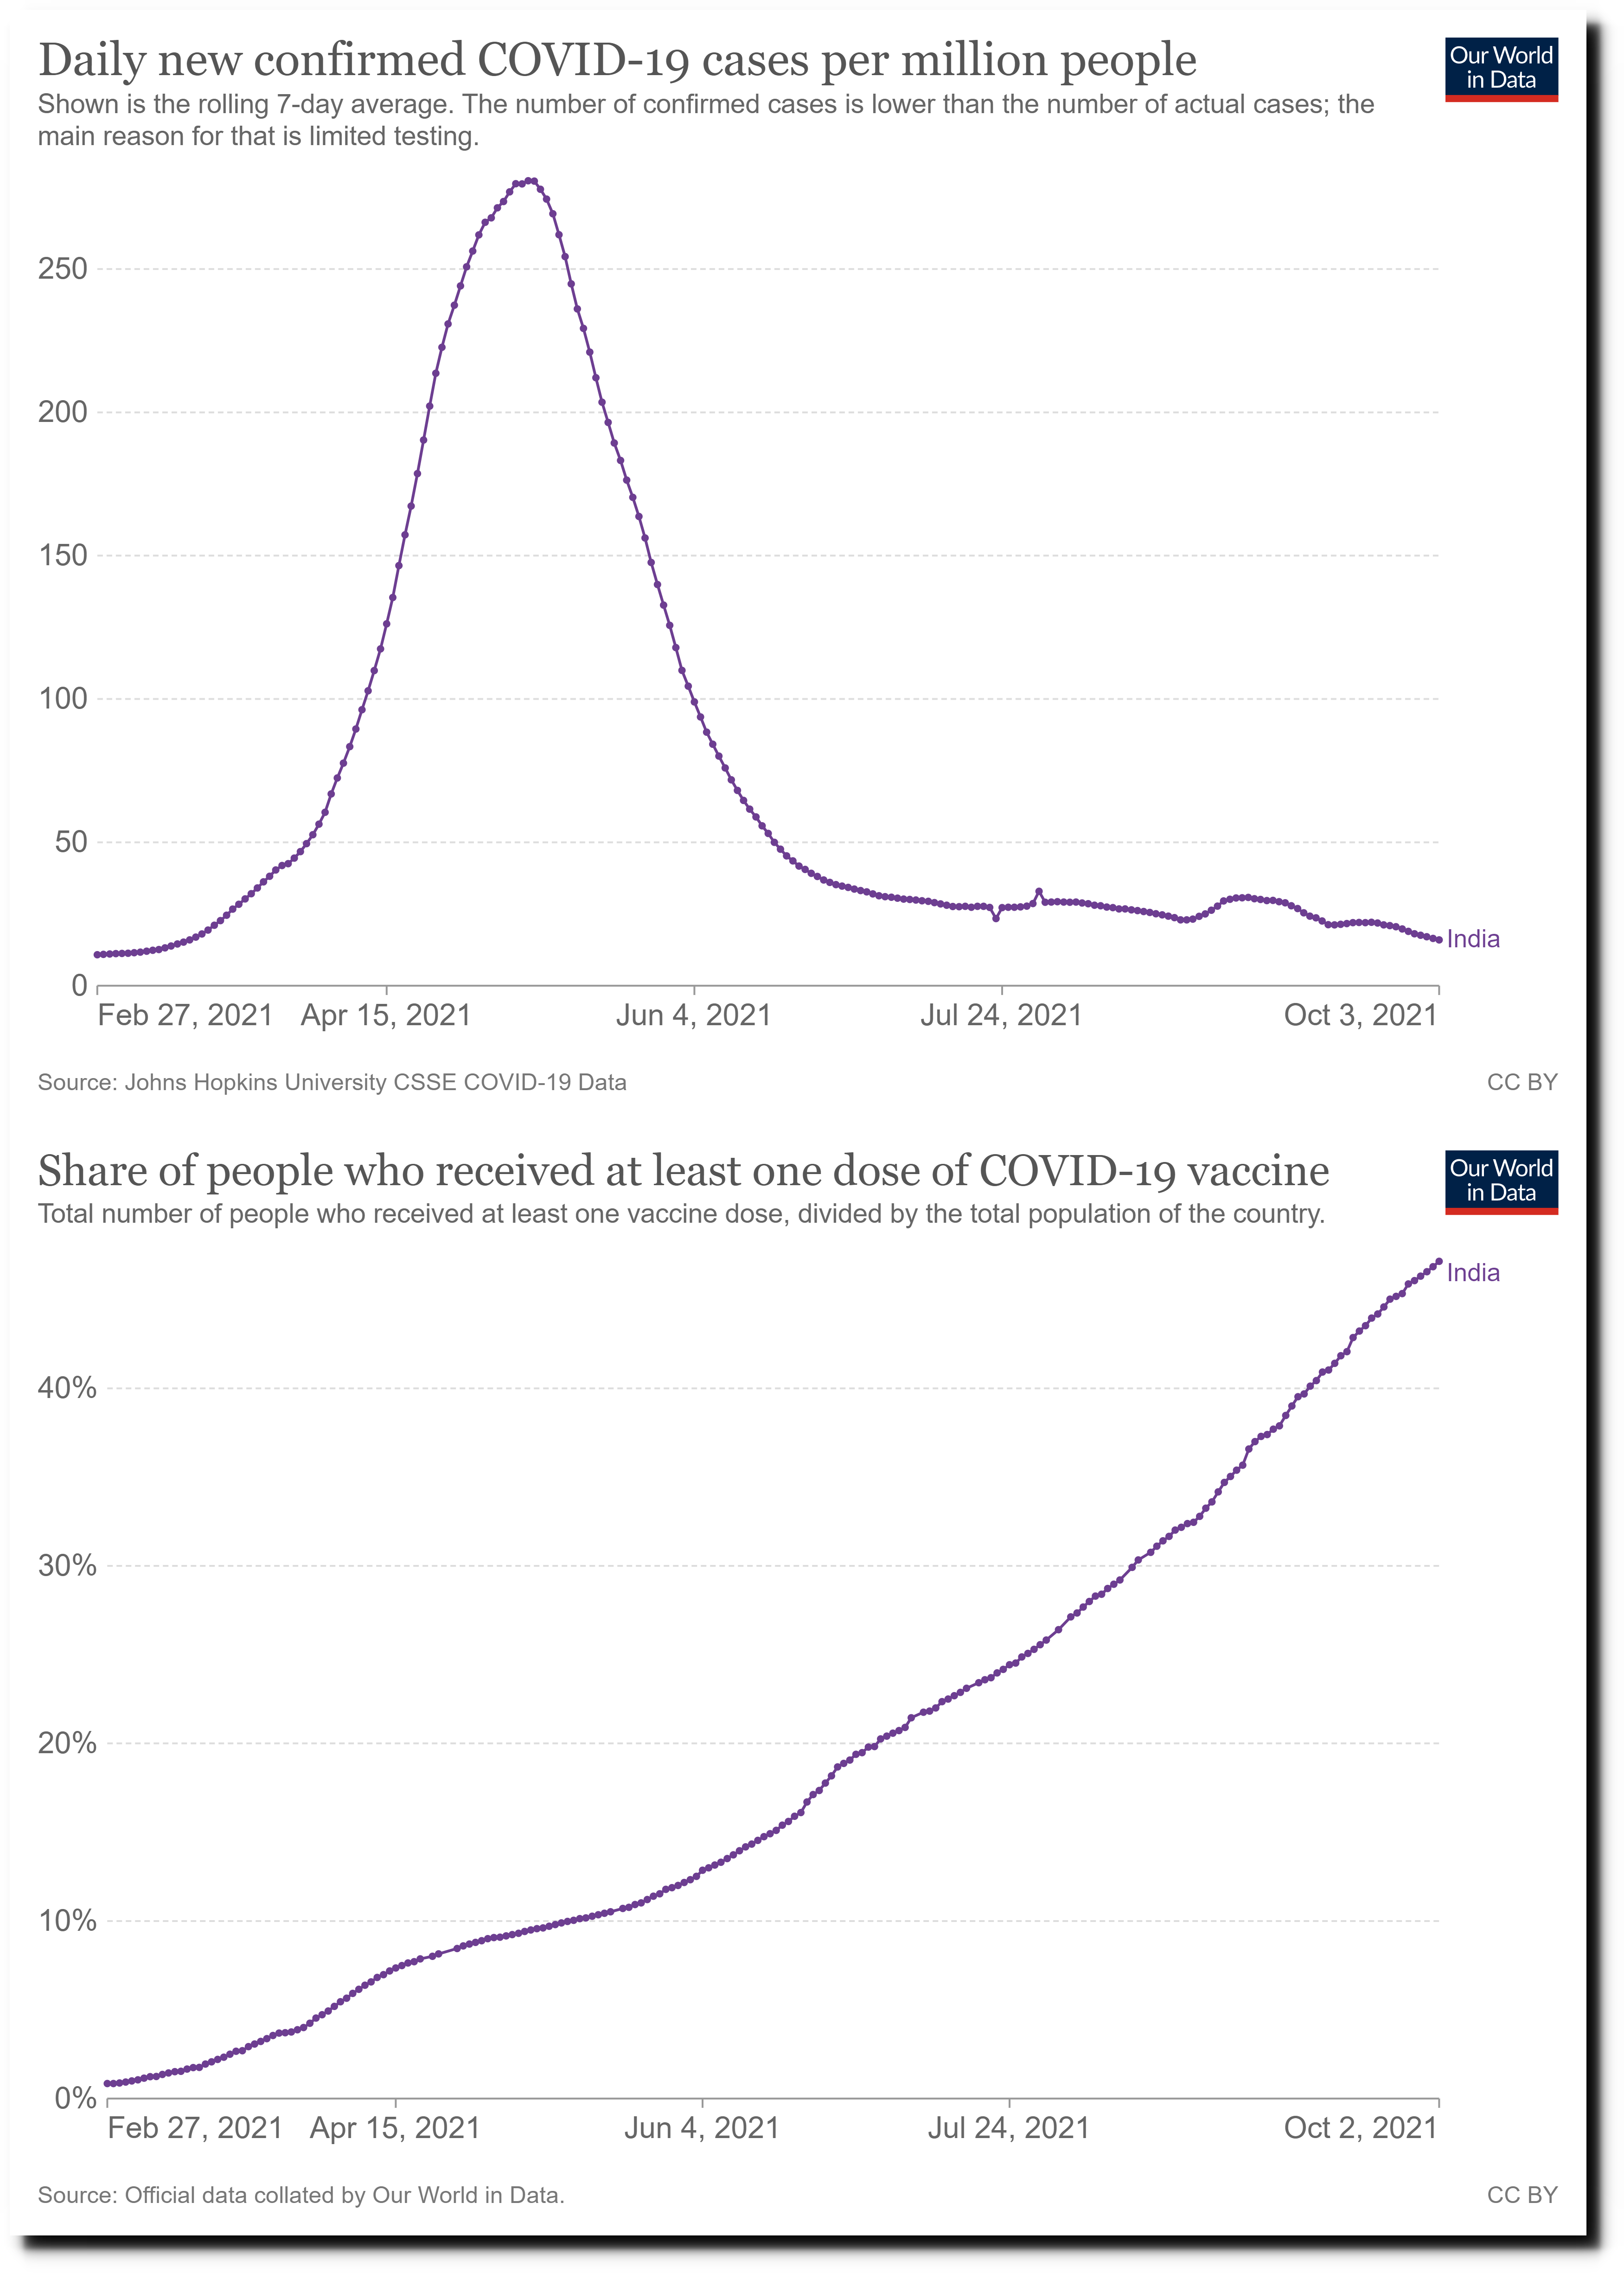
COVID-19 Data Explorer – Our World in Data
But Israel believes they need 100% of people injected at least three times.

Posted in Uncategorized
Leave a comment
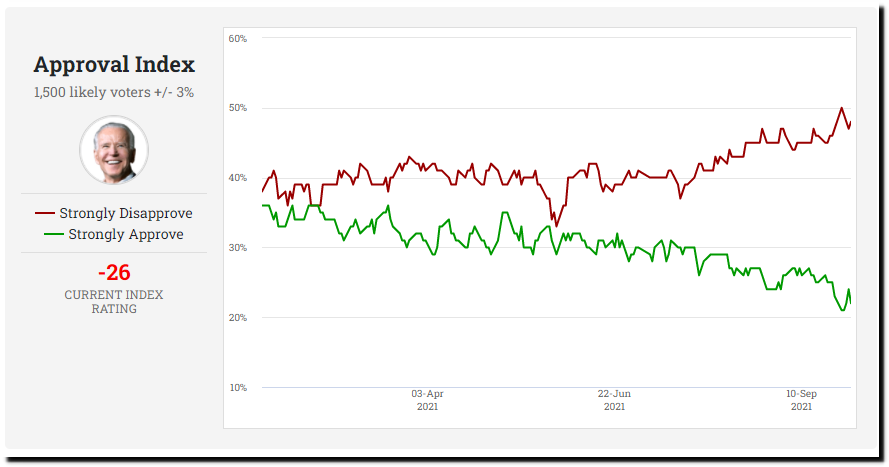
Shocking Opinion Poll
I was shocked to learn there still a few people supporting Joe Biden.
Posted in Uncategorized
Leave a comment
“Deadliest Pandemic In History” “More Younger People Than Before”
The New York Times reports :
“Nearly 700,000 people in the U.S. have now died of Covid-19 — making this the deadliest pandemic in American history. A majority who died recently were in the South and unvaccinated. Many of the victims were also younger than before.“
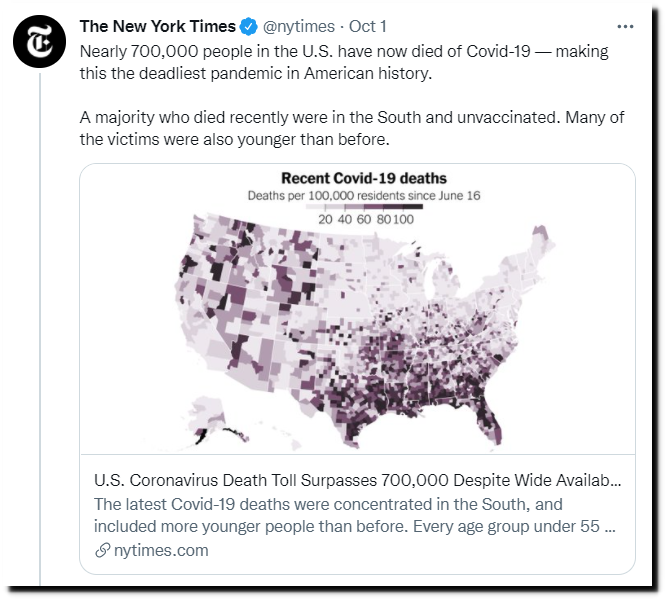
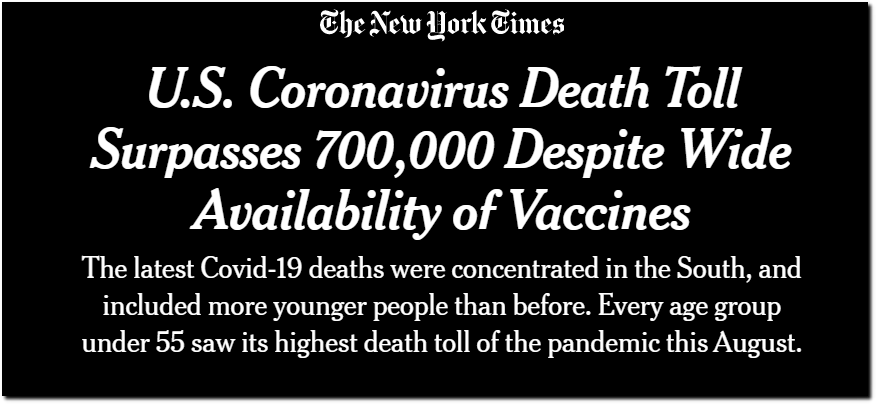
U.S. Covid Death Toll Nears 700,000 Despite Availability of Vaccines – The New York Times
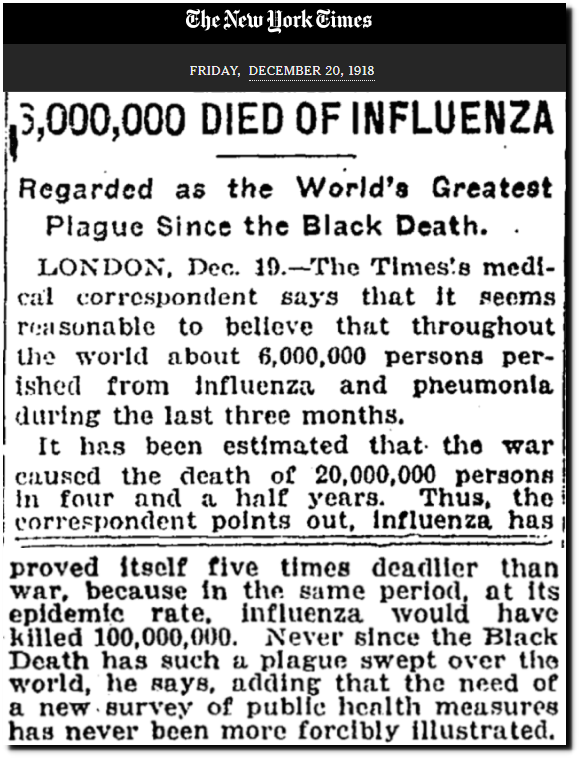
According to the CDC, at least 50 million people died in the 1918-1919 pandemic, which is an average death rate more than twenty times higher than COVID-19.

1918 Pandemic (H1N1 virus) | Pandemic Influenza (Flu) | CDC
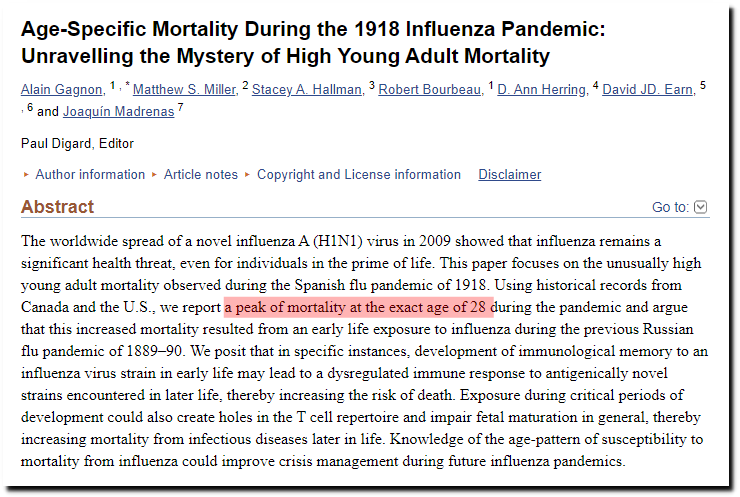
The 1918-1919 pandemic had a peak mortality of age 28.
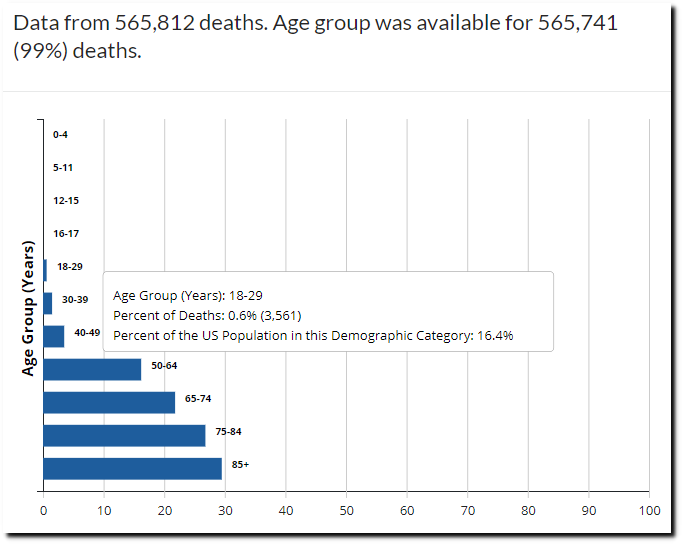
Fewer than four thousand people under age 30 have died from COVID-19 in the US, compared to hundreds of thousands in 19181-1919 pandemic.
Death rates for older people are hundreds of times higher for COVID-19 than for 18 to 29 years old.
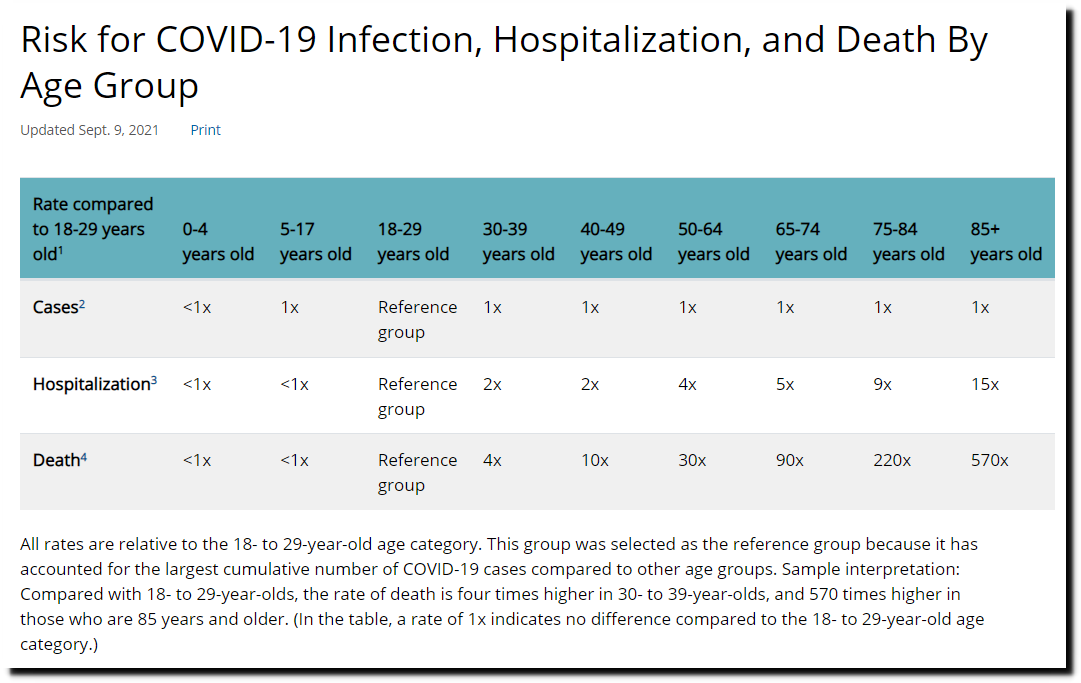
Risk for COVID-19 Infection, Hospitalization, and Death By Age Group | CDC
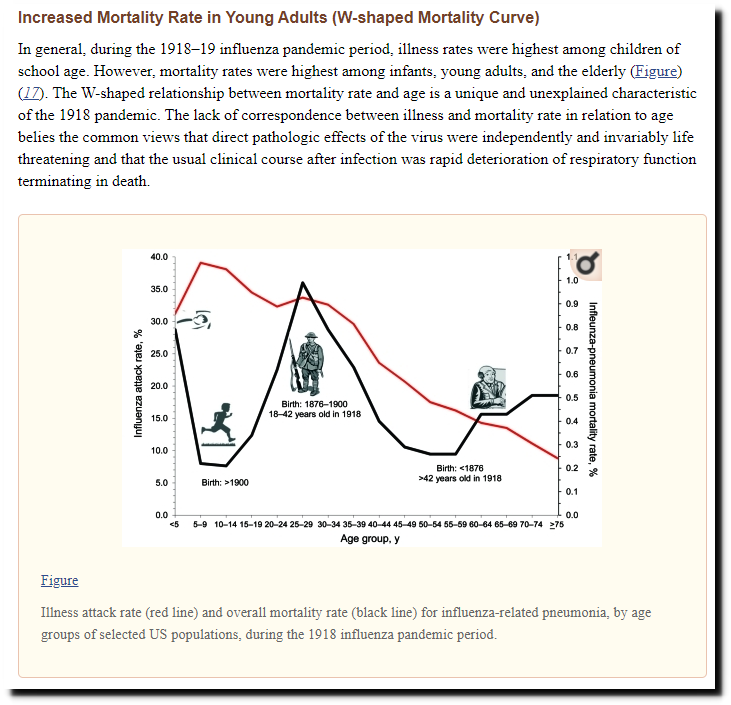
Pathogenic Responses among Young Adults during the 1918 Influenza Pandemic
The average age of death for COVID-19 is 79, the same as for all other causes. By contrast, the 1918-1919 pandemic shortened peoples lives by thirty or forty years.
Then the New York Times went on to show a death rate chart vs. vaccination rate “since June 16” which made it look like New Jersey, New York, Massachusetts and Rhode Island had low death rates,
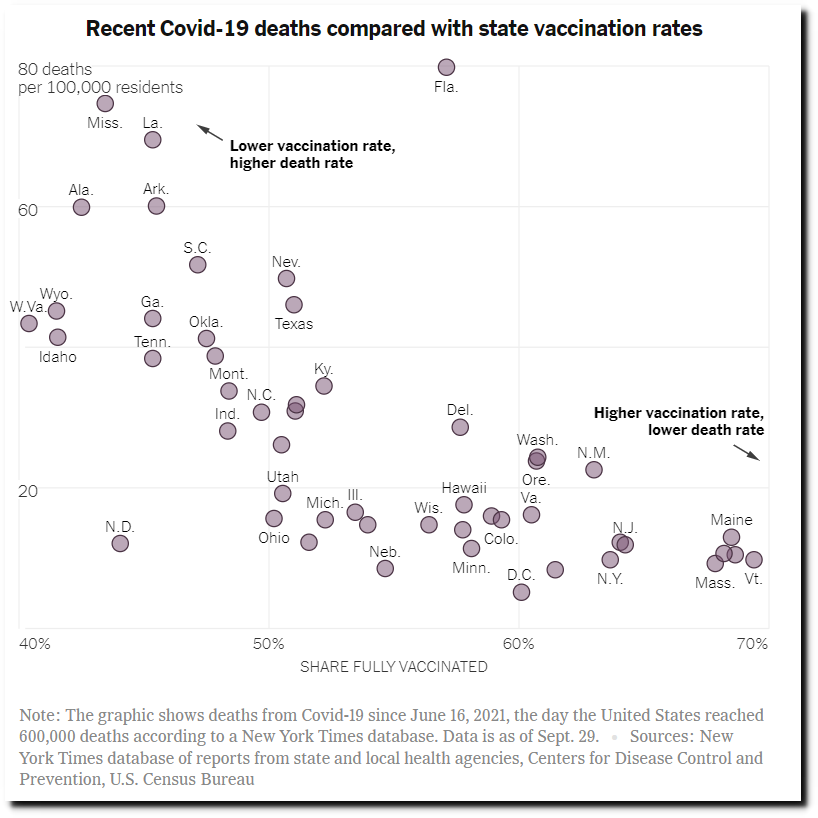
All four states are in the top ten.
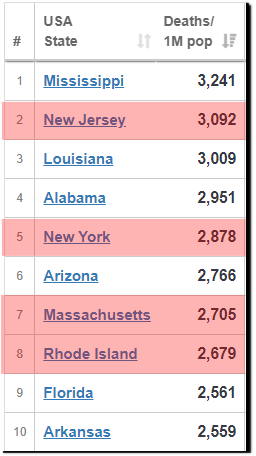
United States COVID: 44,490,897 Cases and 719,674 Deaths – Worldometer
So why did the New York Times pick a start date of June 16? The “delta” pandemic hit the south earlier than the Northeast. It peaked in the south six weeks ago, and is still on the upslope.
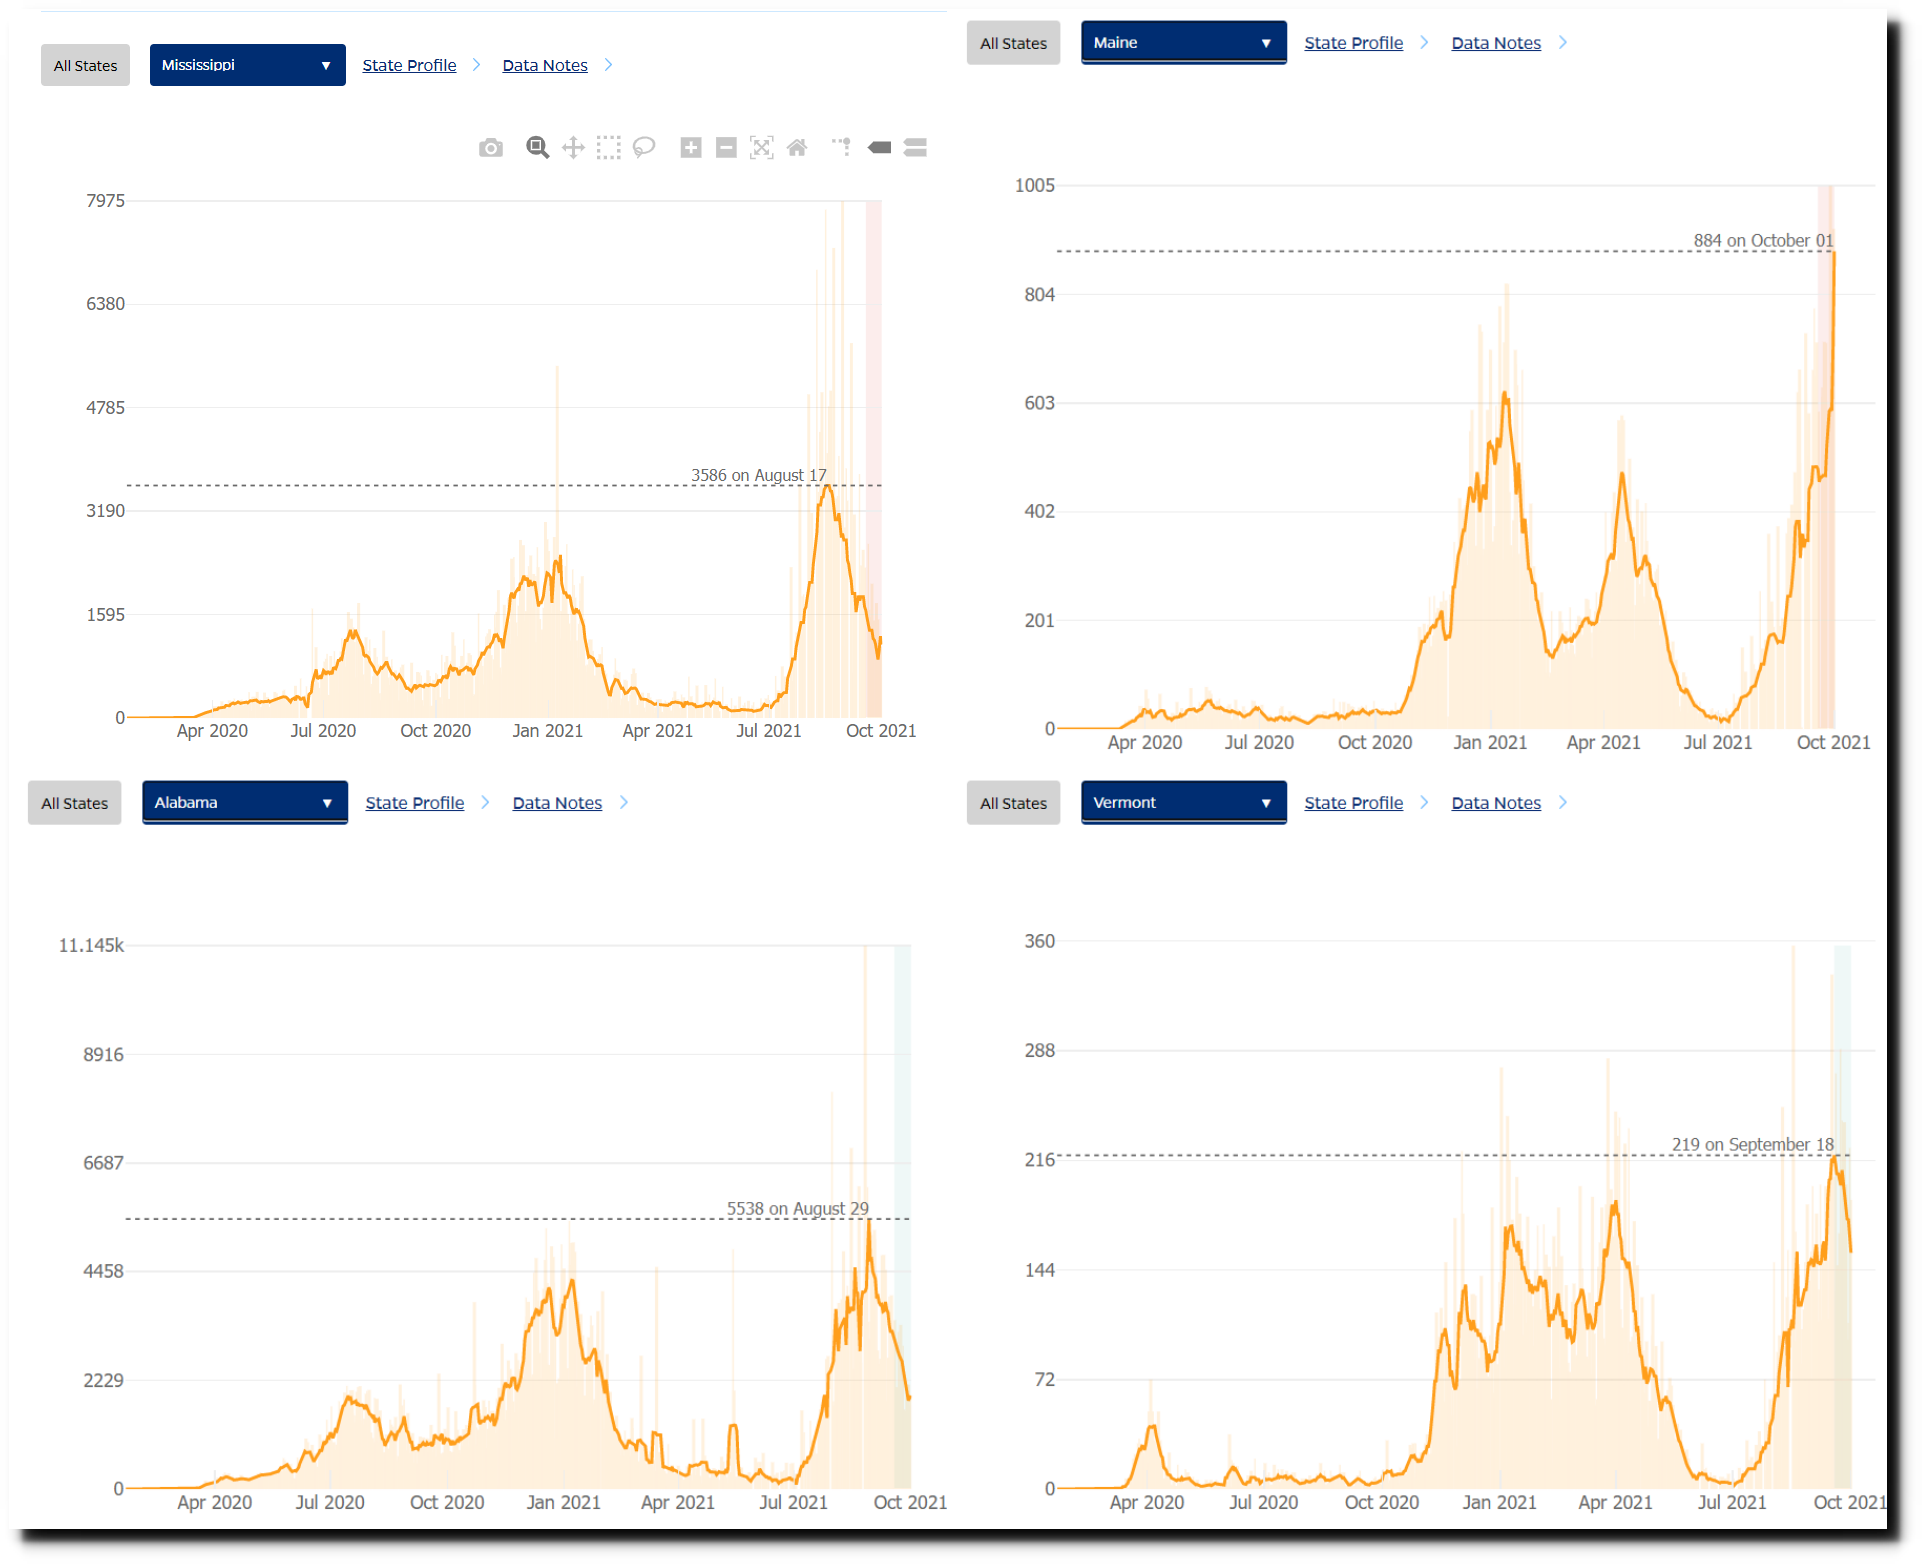
Have we flattened the curve in the US? – Johns Hopkins
Deaths in the northeast are increasing, and decreasing in the south.
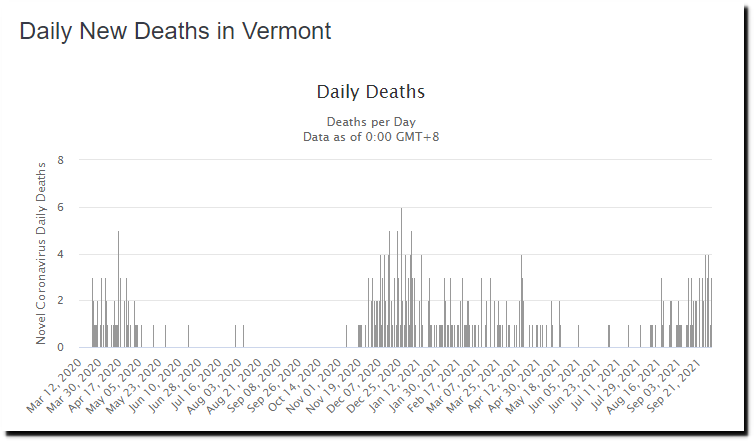
Vermont COVID: 34,081 Cases and 321 Deaths – Worldometer
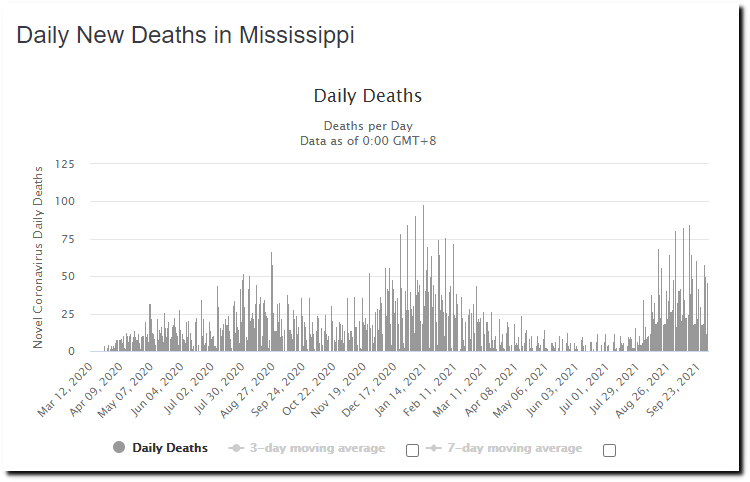
Mississippi COVID: 489,216 Cases and 9,646 Deaths – Worldometer
By cherry-picking the start date the New York Times is trying to make it look like vaccines work.
In 1918 they reported the flu was worse than the black death.
Posted in Uncategorized
Leave a comment
“Deadliest Pandemic In History”
Dissecting the Orwellian disinformation campaign by the New York Times in support of the pharmaceutical industry
Posted in Uncategorized
Leave a comment
Science Requires Actual Thinking
In 2009, NASA claimed that East Antarctica was losing ice.
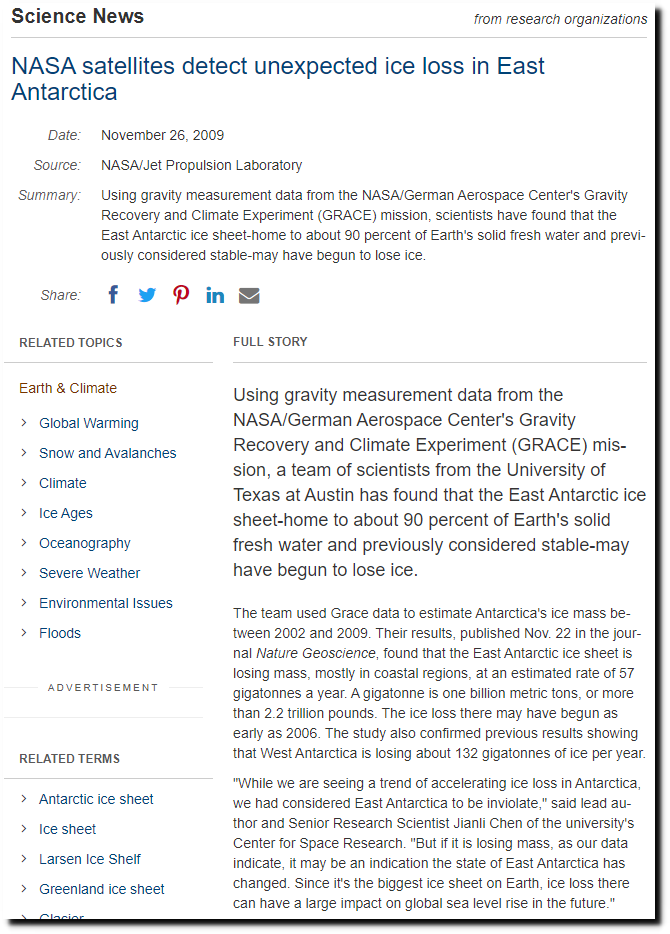
NASA satellites detect unexpected ice loss in East Antarctica — ScienceDaily
I explained a few months later what they were doing wrong.
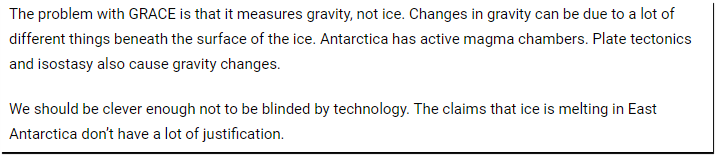
Amazing Grace – Watts Up With That?
And a few months later even TIME Magazine acknowledged the error.
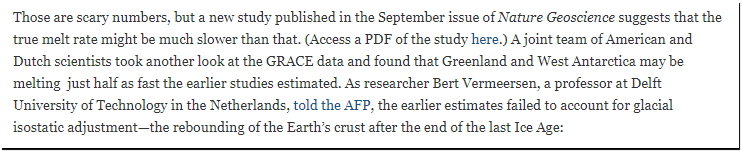
Climate Change: New Study Halves the Rate of Ice Cap Melt | TIME.com
In 2015 NASA’s Jay Zwally acknowledged the obvious – that East Antarctica was not losing ice.
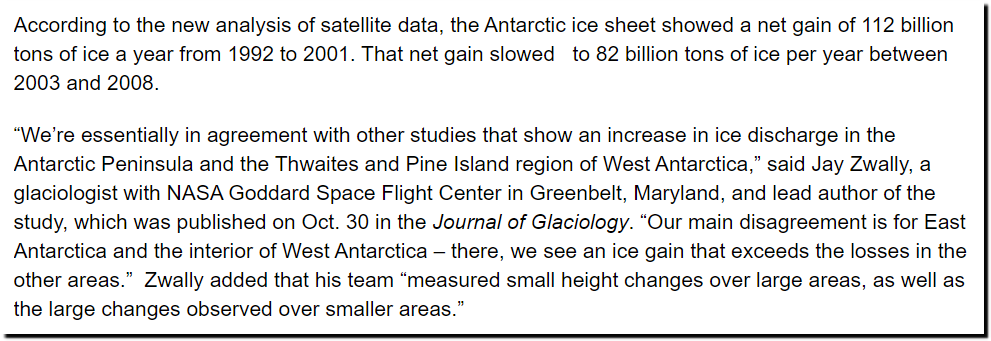
NASA Study: Mass Gains of Antarctic Ice Sheet Greater than Losses | NASA
And now, NASA is back claiming the same nonsense.
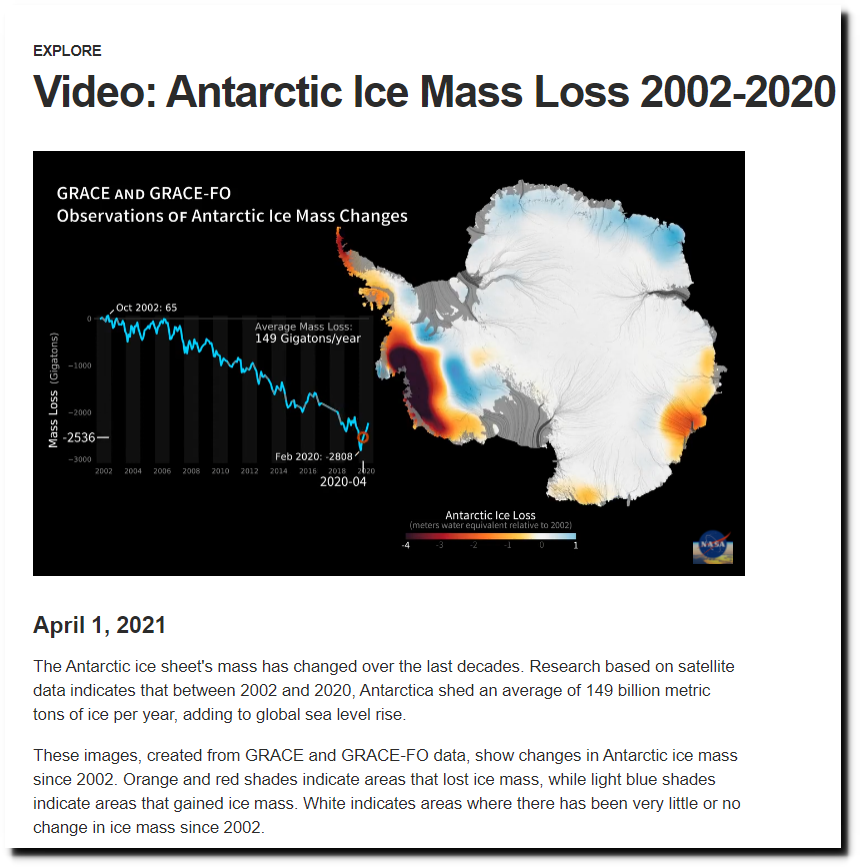
Video: Antarctic Ice Mass Loss 2002-2020 – Climate Change: Vital Signs of the Planet
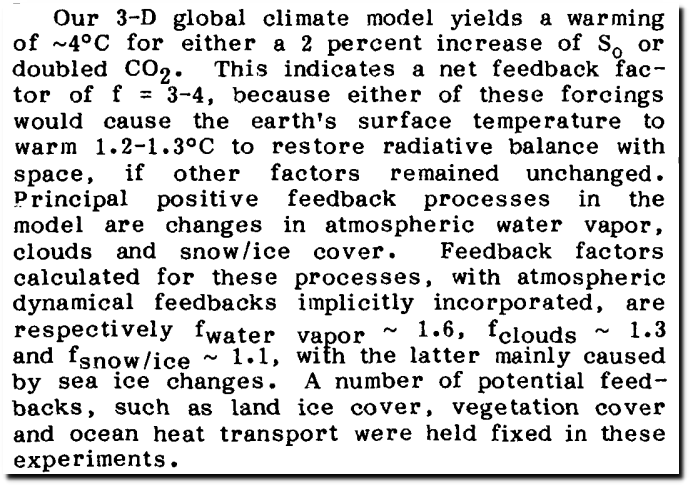
In 1984, NASA’s James Hansen predicted 4C global warming and 5-8C warming in Antarctica.
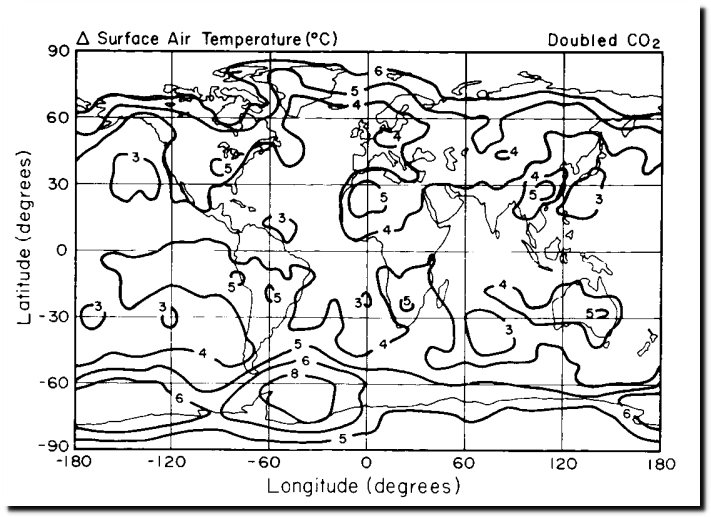
Meanwhile, Antarctica probably just had their coldest winter on record.
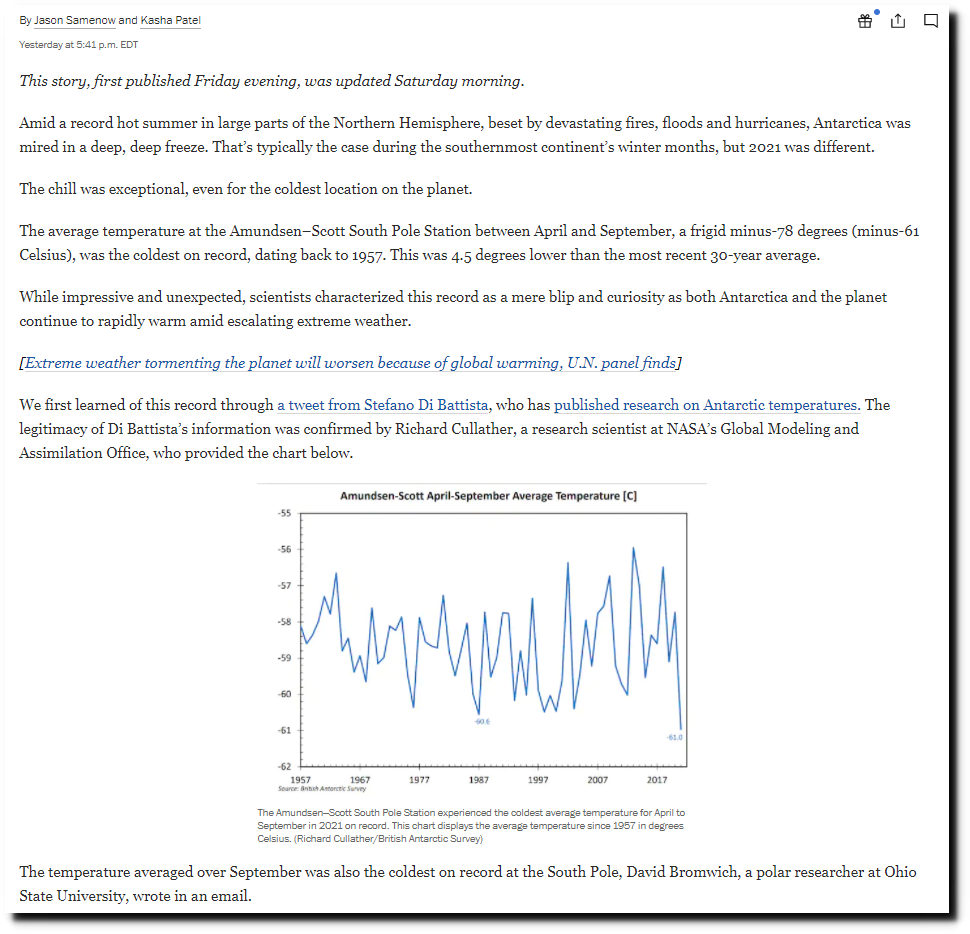
The South Pole just had its most severe cold season on record – The Washington Post
Hansen’s warming estimates were off by a factor of ten.
By 1906, Antarctic sea ice had retreated thirty miles – during NASA’s coldest years on record.
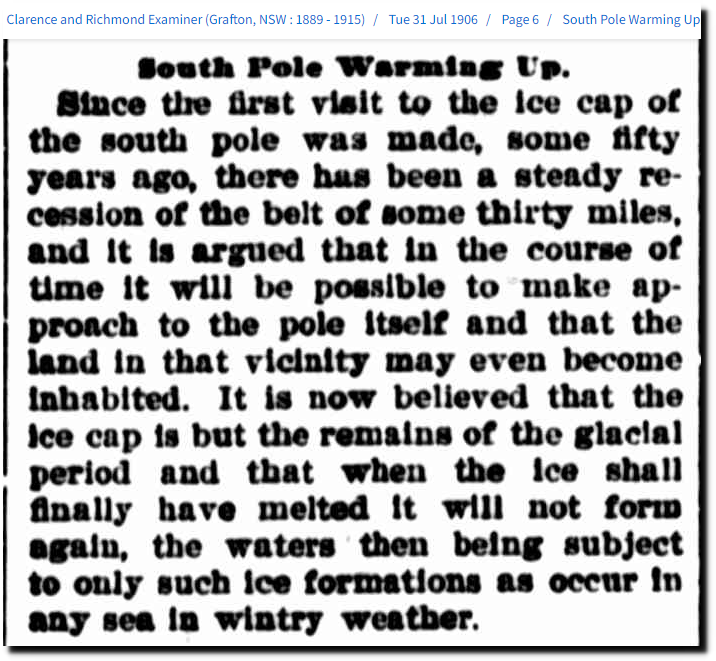
31 Jul 1906 – South Pole Warming Up
Posted in Uncategorized
Leave a comment