

Disrupting the Borg is expensive and time consuming!

Google Search
-
Recent Posts
- Is Antarctica Melting?
- High Speed Analysis And Visualization
- El Nino To The Rescue?
- Fake News Update
- Growth Of Antarctic Sea Ice
- 65 Years Of Progress!
- El Nino To The Rescue?
- Worst March Drought On Record
- ChartGL Process Control Demo
- The Biggest Money Laundering Scam
- Drought In The Headwaters Of Lake Powell
- Unrealistic Expectations Of Water Availability
- Did Bill Gates Do This?
- Worst March Drought On Record In The US
- The Real Hockey Stick Graph
- Analyzing The Western Water Crisis
- Gaslighting 1924
- “Why Do You Resist?”
- Climate Attribution Model
- Fact Checking NASA
- Fact Checking Grok
- Fact Checking The New York Times
- New Visitech Features
- Ice-Free Arctic By 2014
- Debt-Free US Treasury Forecast
Recent Comments
- conrad ziefle on Is Antarctica Melting?
- Gordon Vigurs on Is Antarctica Melting?
- Bob G on Is Antarctica Melting?
- conrad ziefle on High Speed Analysis And Visualization
- Bob G on 65 Years Of Progress!
- Bob G on 65 Years Of Progress!
- Gordon Vigurs on 65 Years Of Progress!
- arn on 65 Years Of Progress!
- arn on 65 Years Of Progress!
- Bob G on 65 Years Of Progress!
SMH Calls For Tattooing People Who Tell the Truth About Climate
Ten years ago today …
“Surely it’s time for climate-change deniers to have their opinions forcibly tattooed on their bodies.”

The dangers of bone-headed beliefs

Posted in Uncategorized
Leave a comment
Forest Fires Of 1910
March of 1910 was the warmest and driest on record in the US.

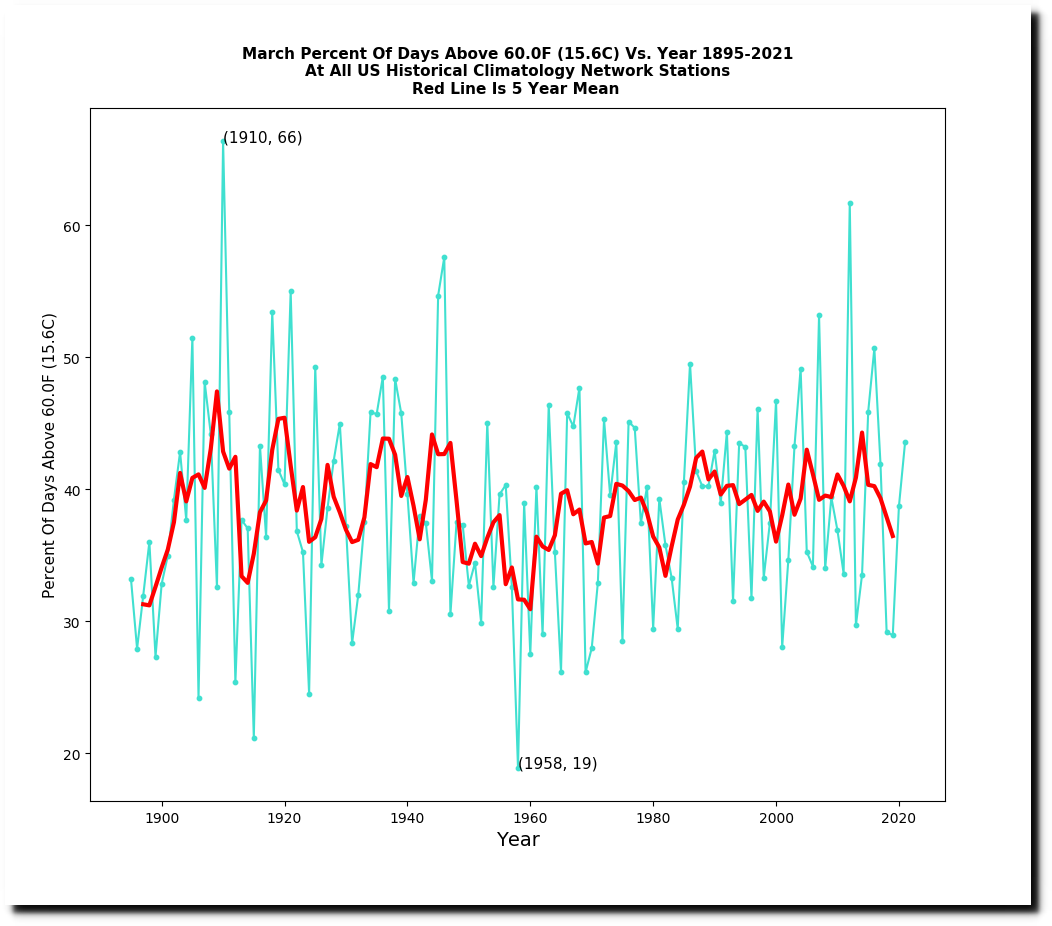

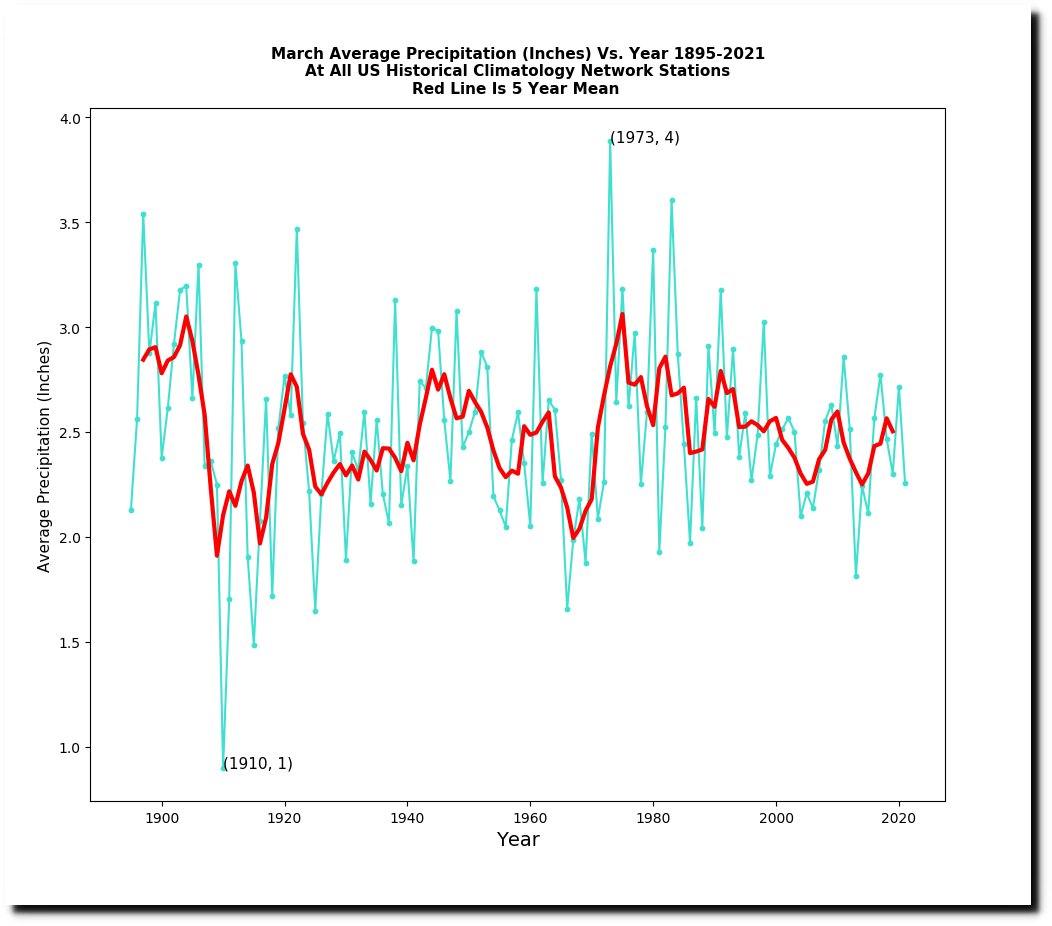
This led to the largest and some of the deadliest fires in US history.
On October 7 a forest fire raged out of control across Lake of the Woods County, Minnesota, leveling everything in its path.
Baudette fire of 1910 – Wikipedia
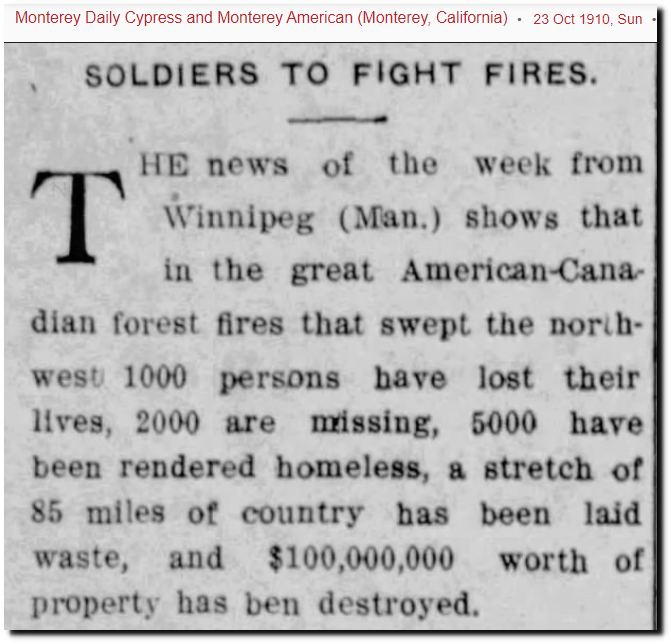
23 Oct 1910, 6 – Monterey Daily Cypress and Monterey American at Newspapers.com

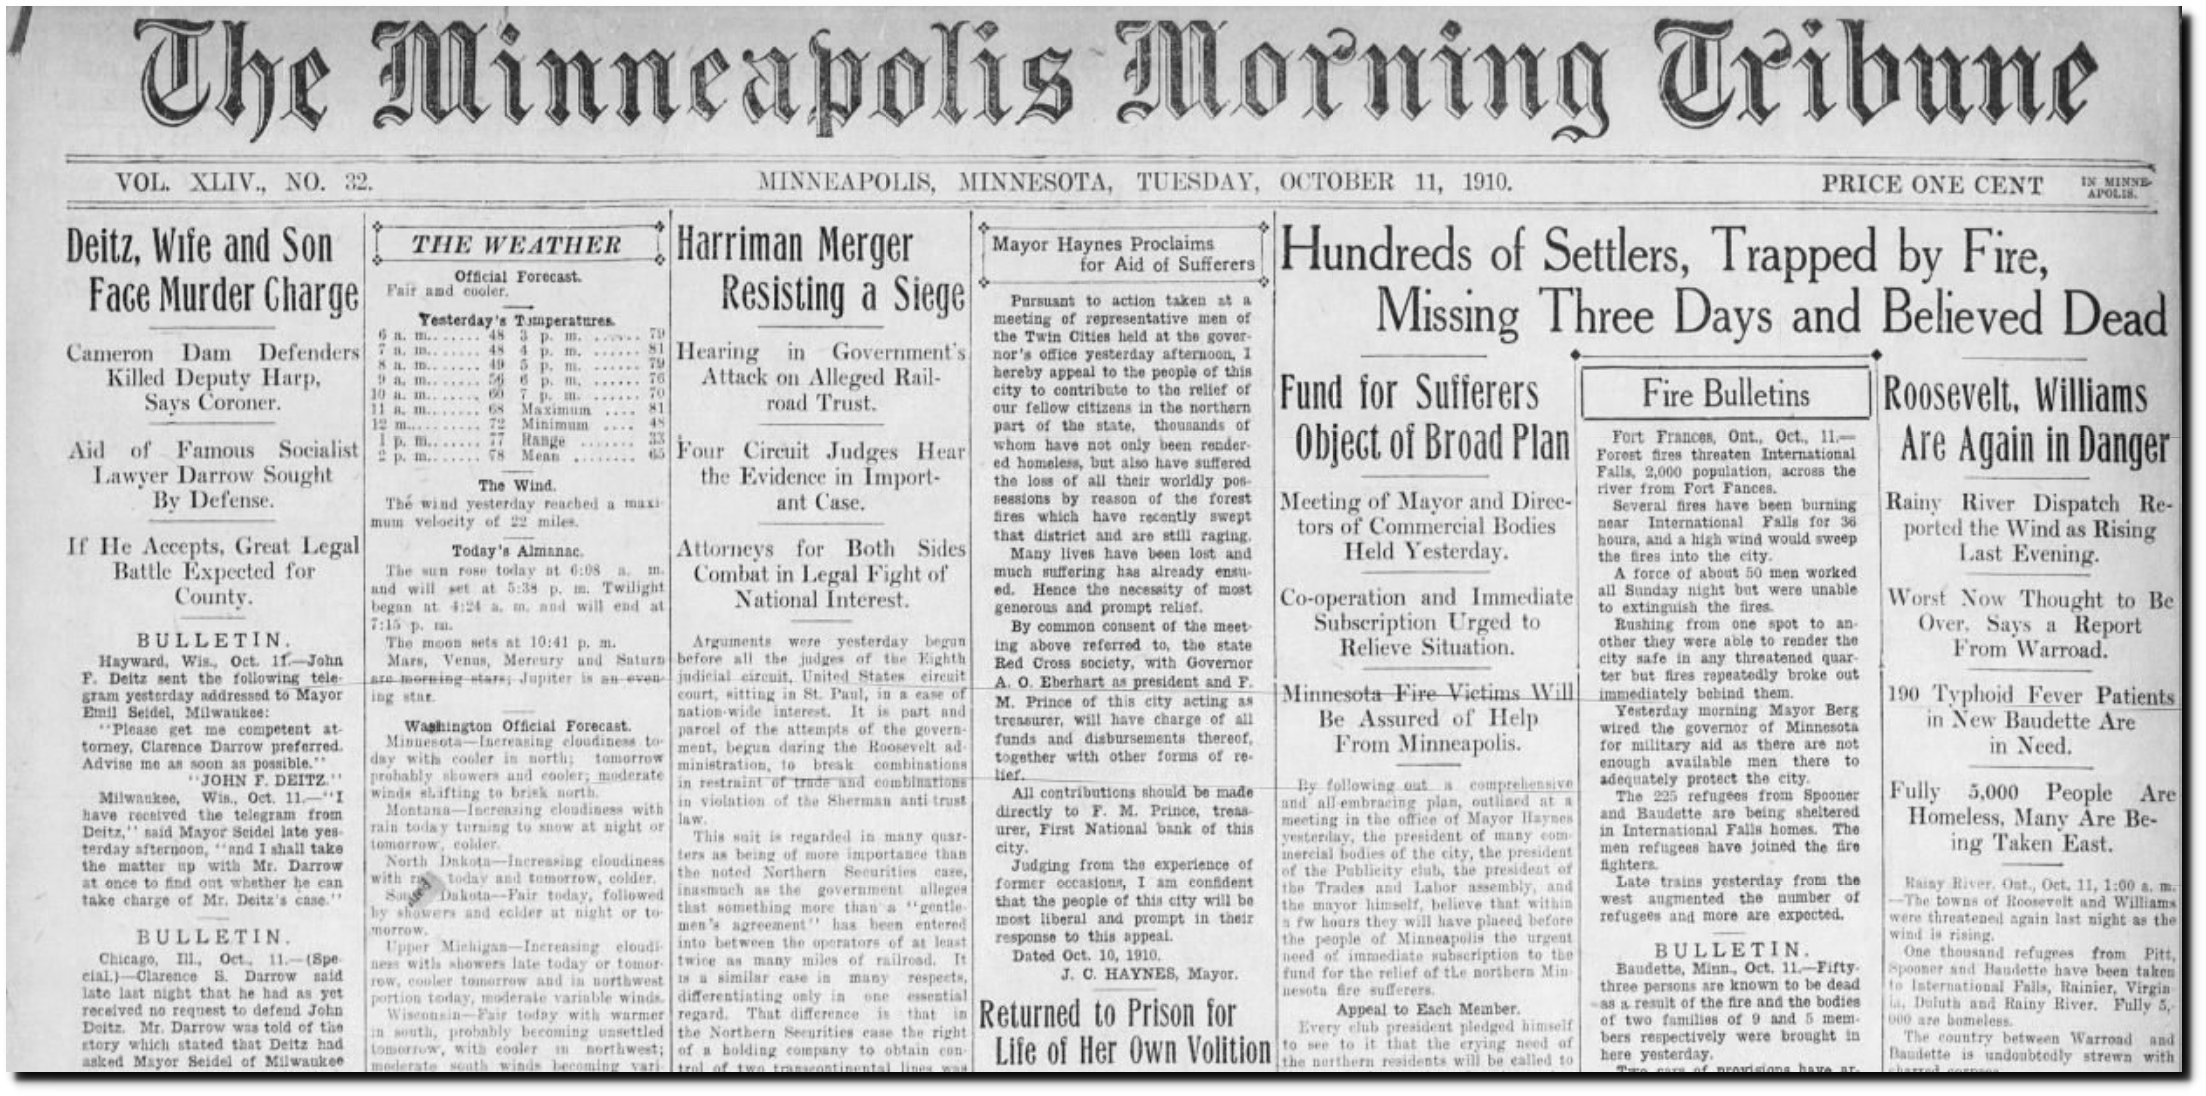
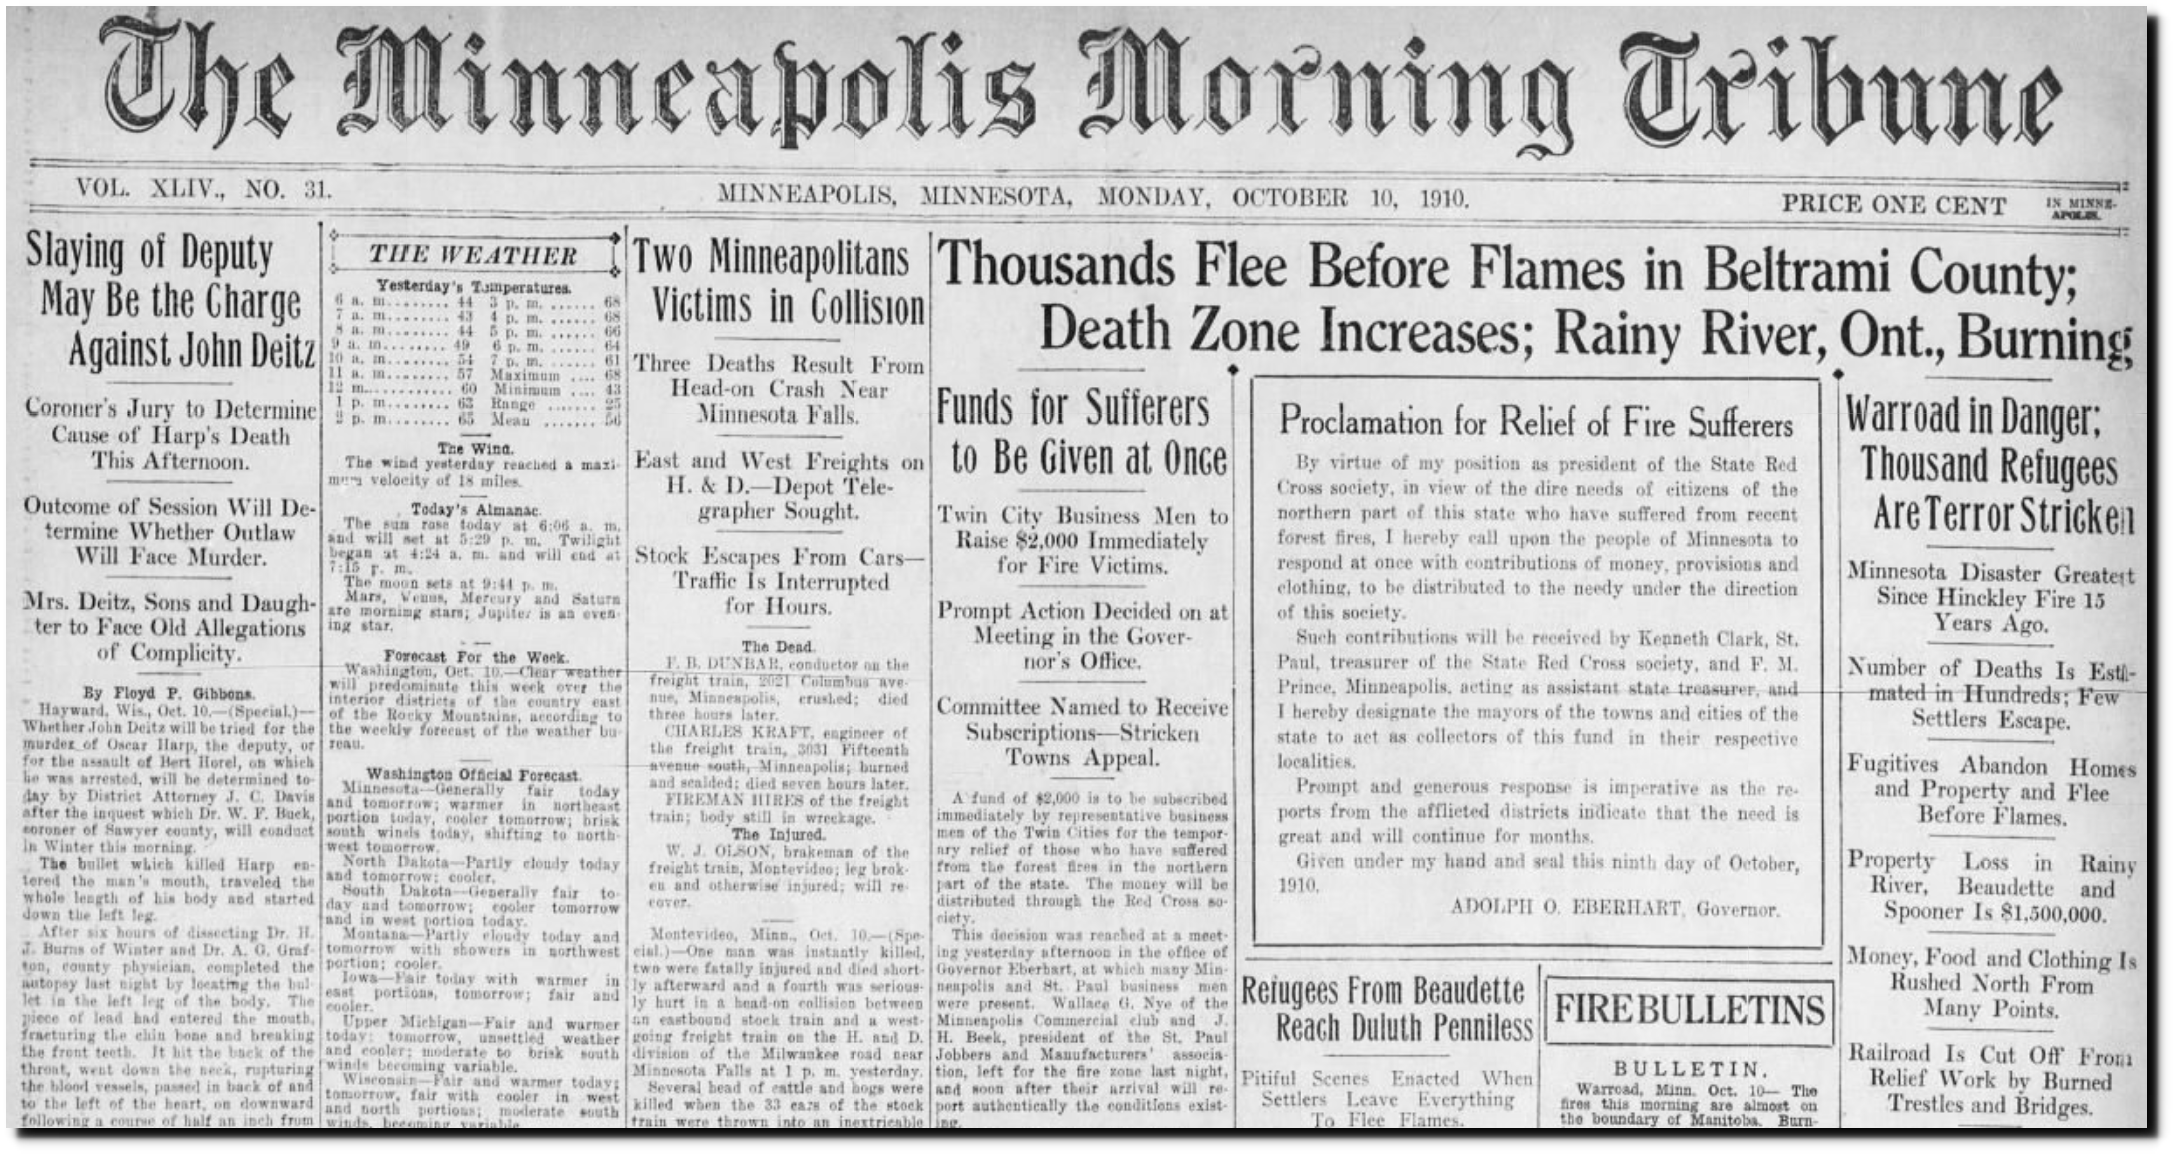
10 Oct 1910, Page 1 – Star Tribune at Newspapers.com
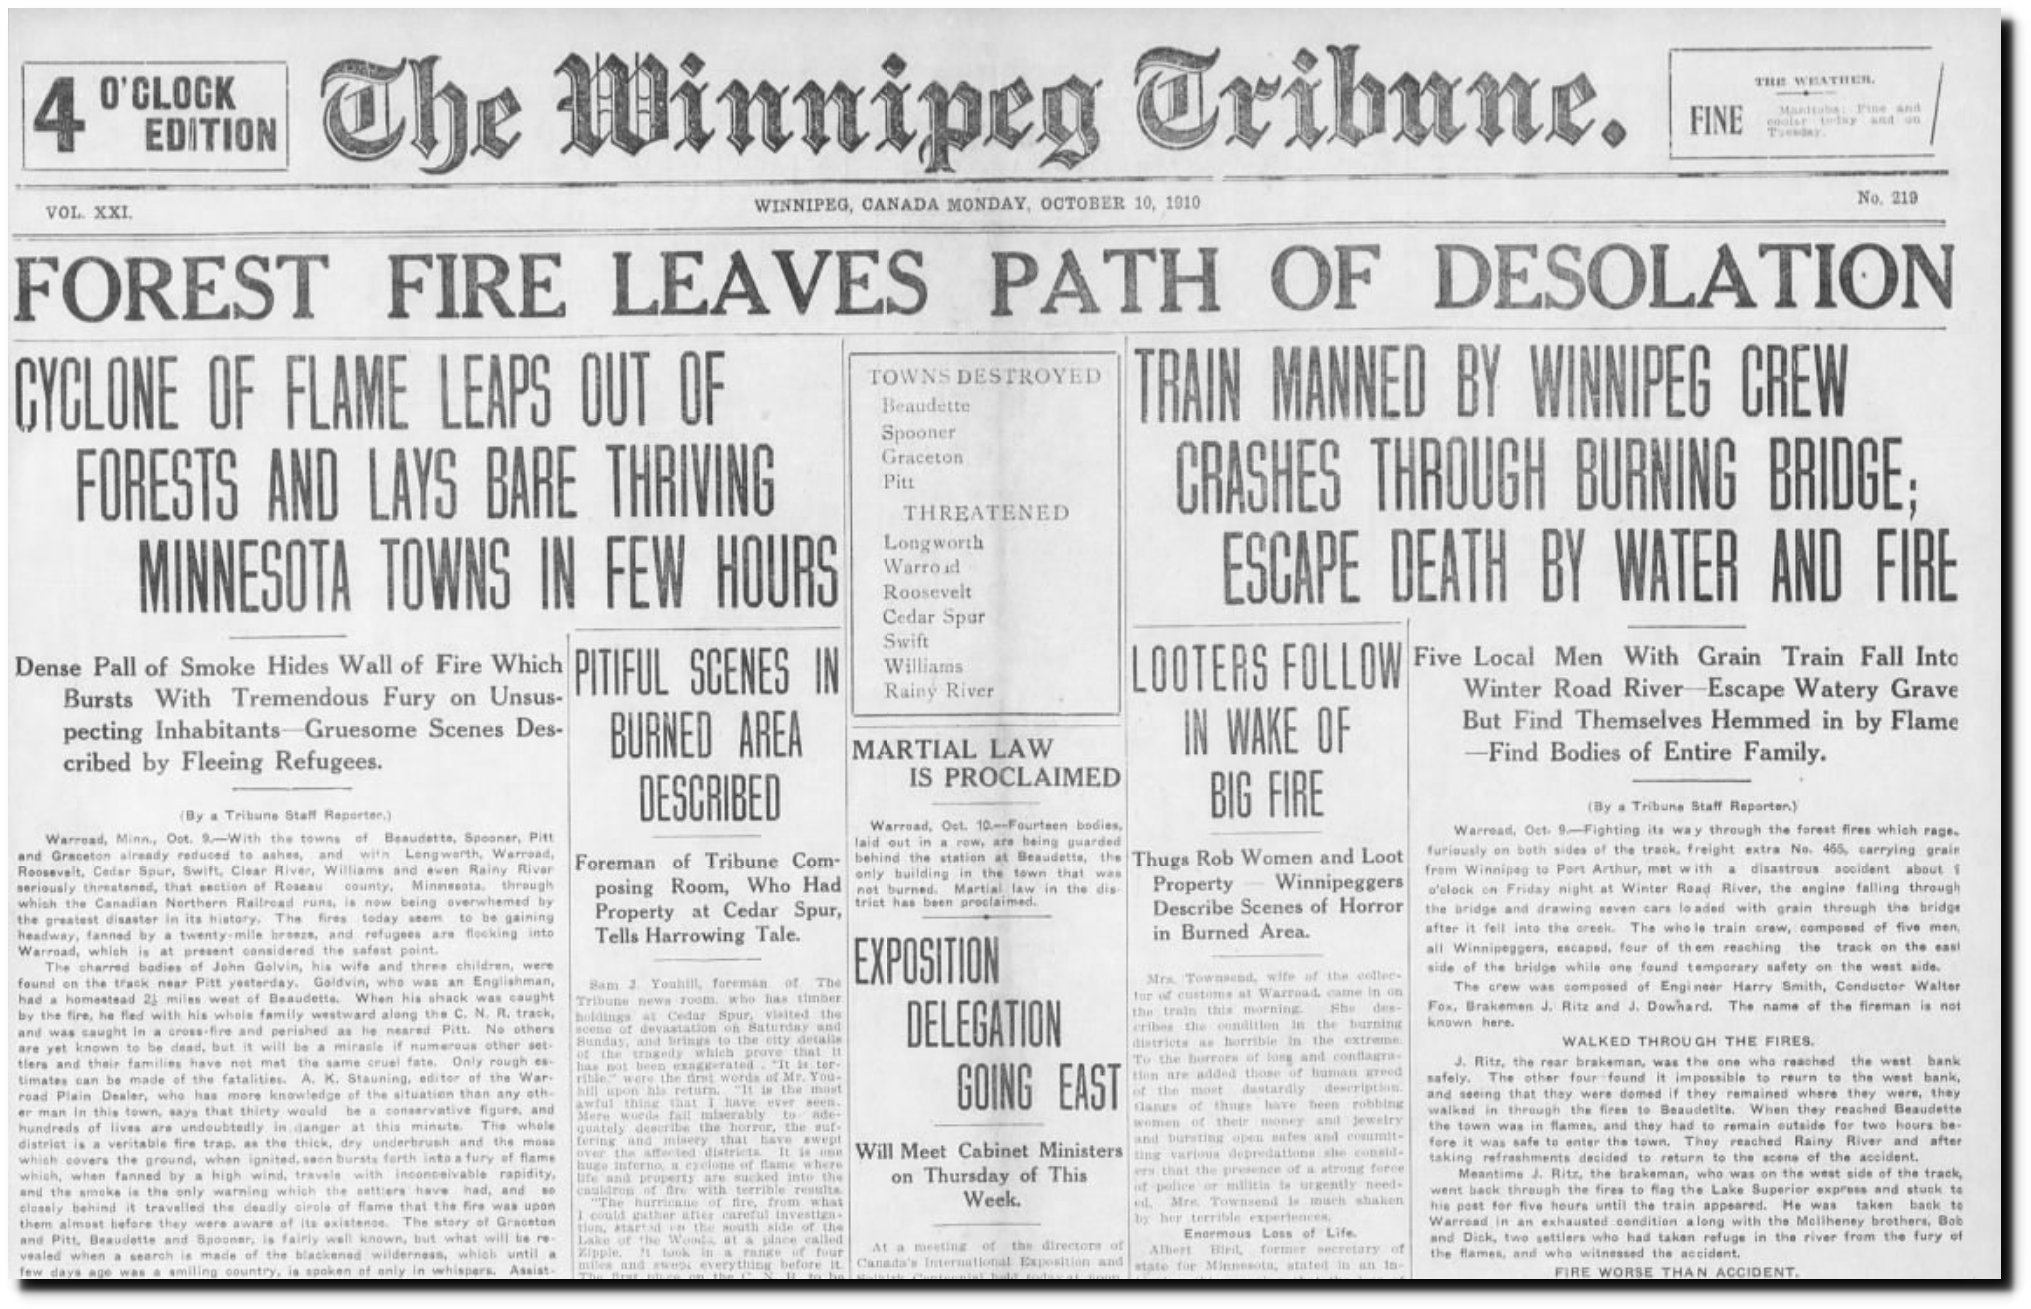
10 Oct 1910, Page 1 – The Winnipeg Tribune at Newspapers.com
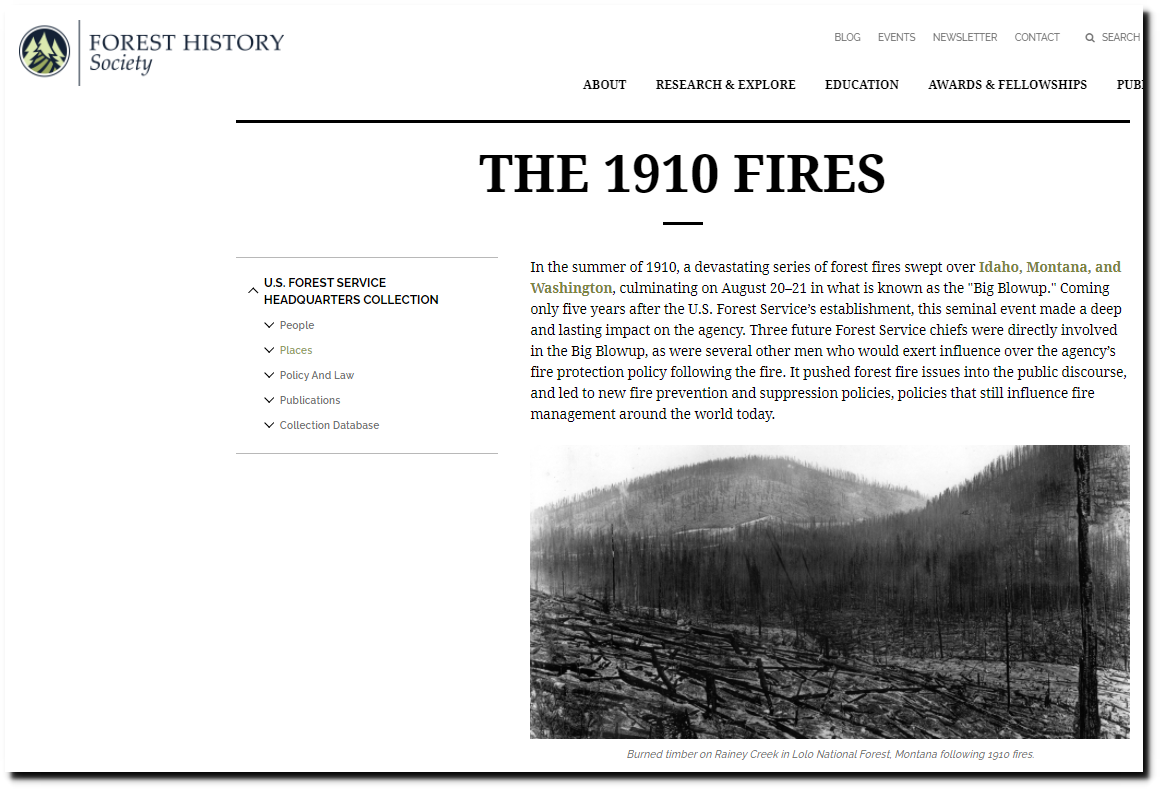
A few weeks earlier was the largest forest fire in US history, along the Idaho/Montana border.
Posted in Uncategorized
Leave a comment
Lies, Damned Lies, And Biden Fire Statistics
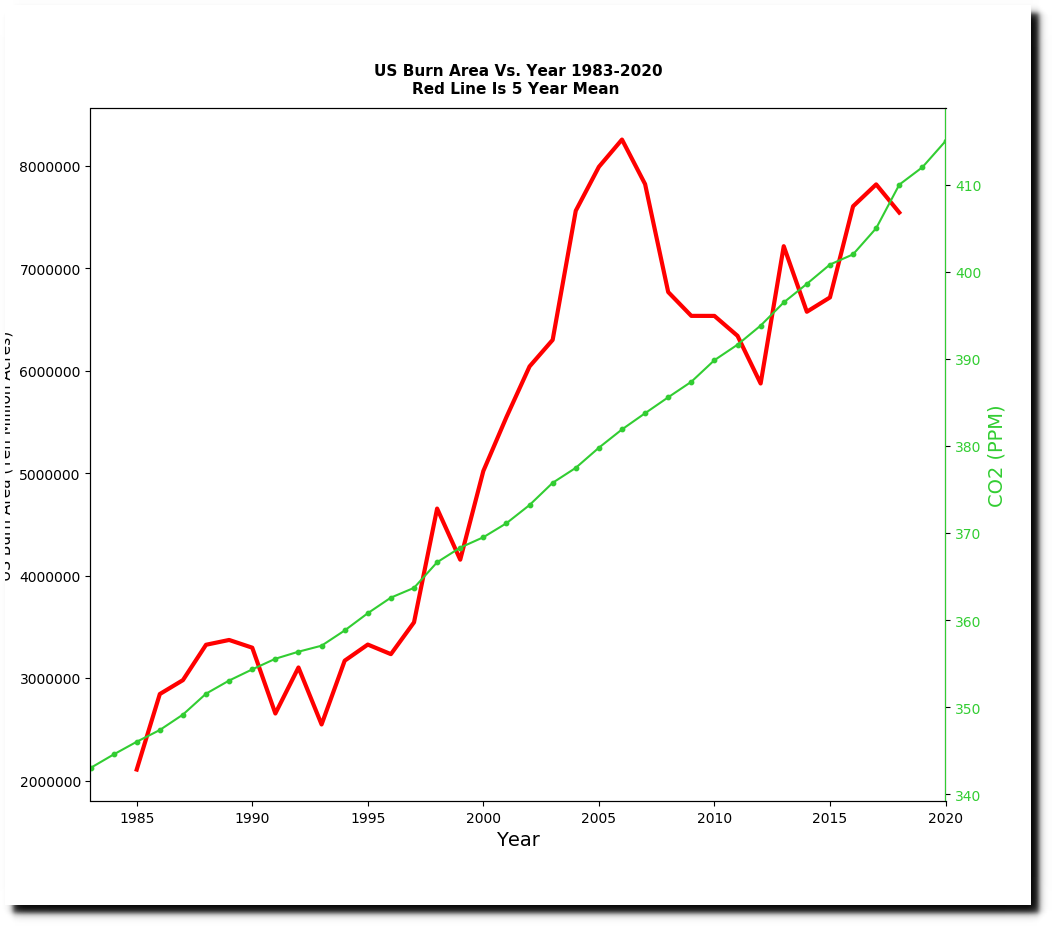
The EPA has a new graph on their website which shows that the US Forest Service collected fire data from 1983 to 1997 and the National Interagency Fire Center collected fire data starting in 1983. According to their graph burn acreage in the US has increased by 400%.

Climate Change Indicators: Wildfires | Climate Change Indicators in the United States | US EPA
But this report from ten years ago showed that US Forest Service collected fire data from at least 1916 to 2008, and that burn acreage is down 80% since the 1930s.
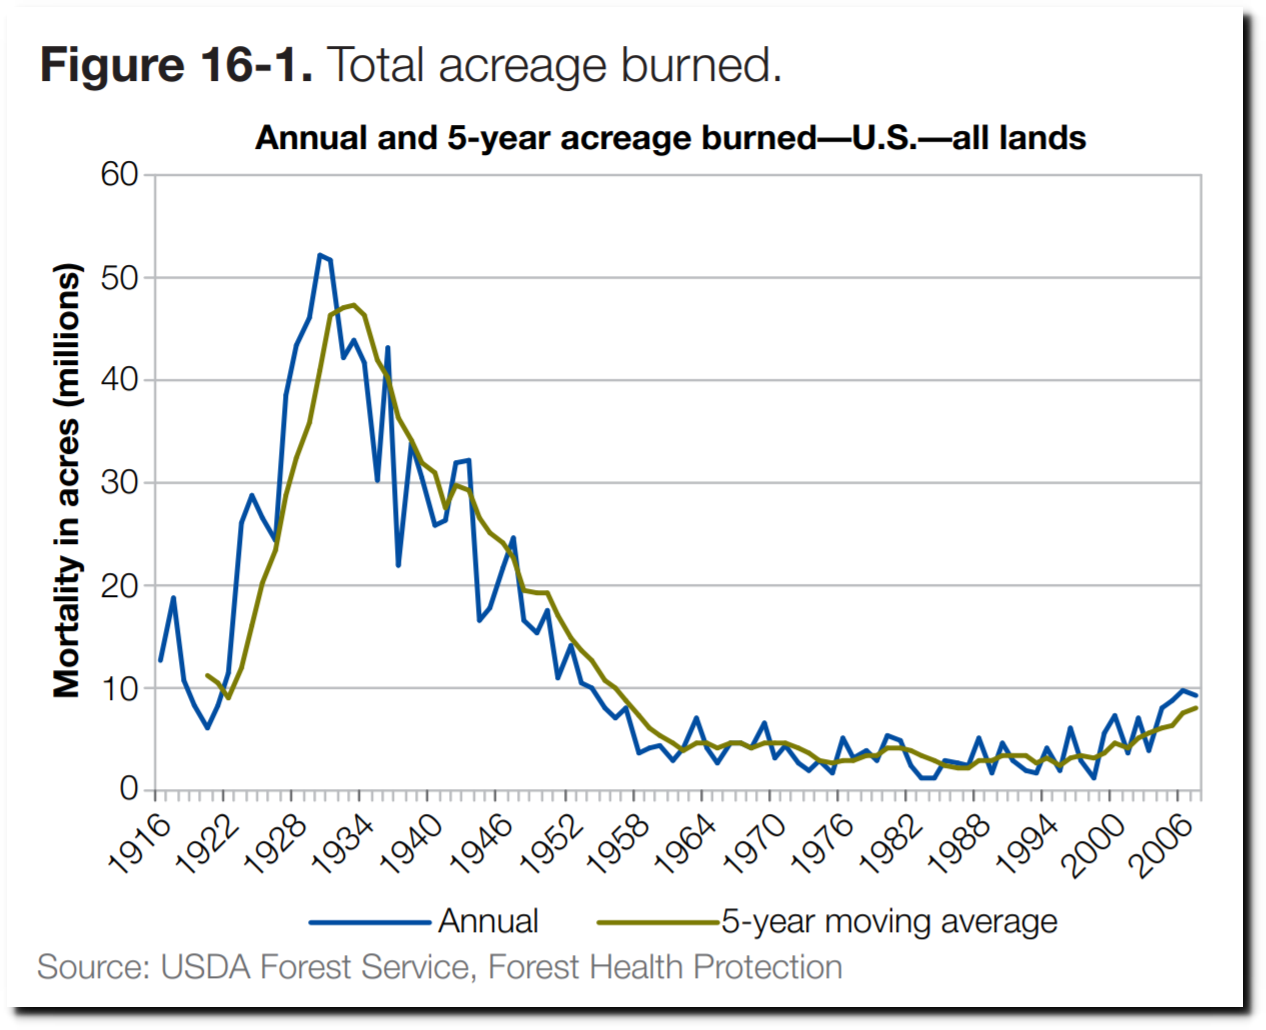
2010-sustainability-report.pdf
This 1938 New York Times article confirmed the data in Forest Service graph.
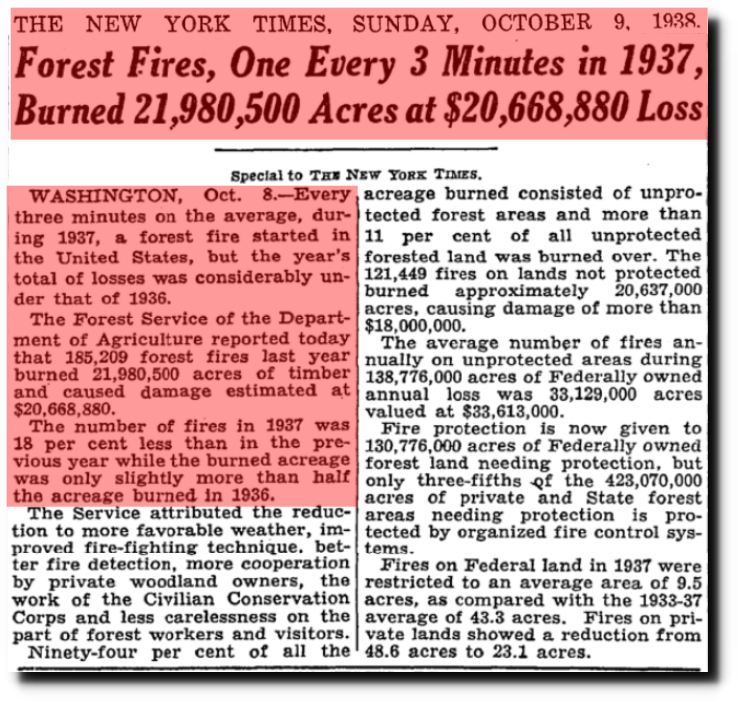
TimesMachine: October 9, 1938 – NYTimes.com
The National Interagency Fire Center website shows burn acreage back to 1983.
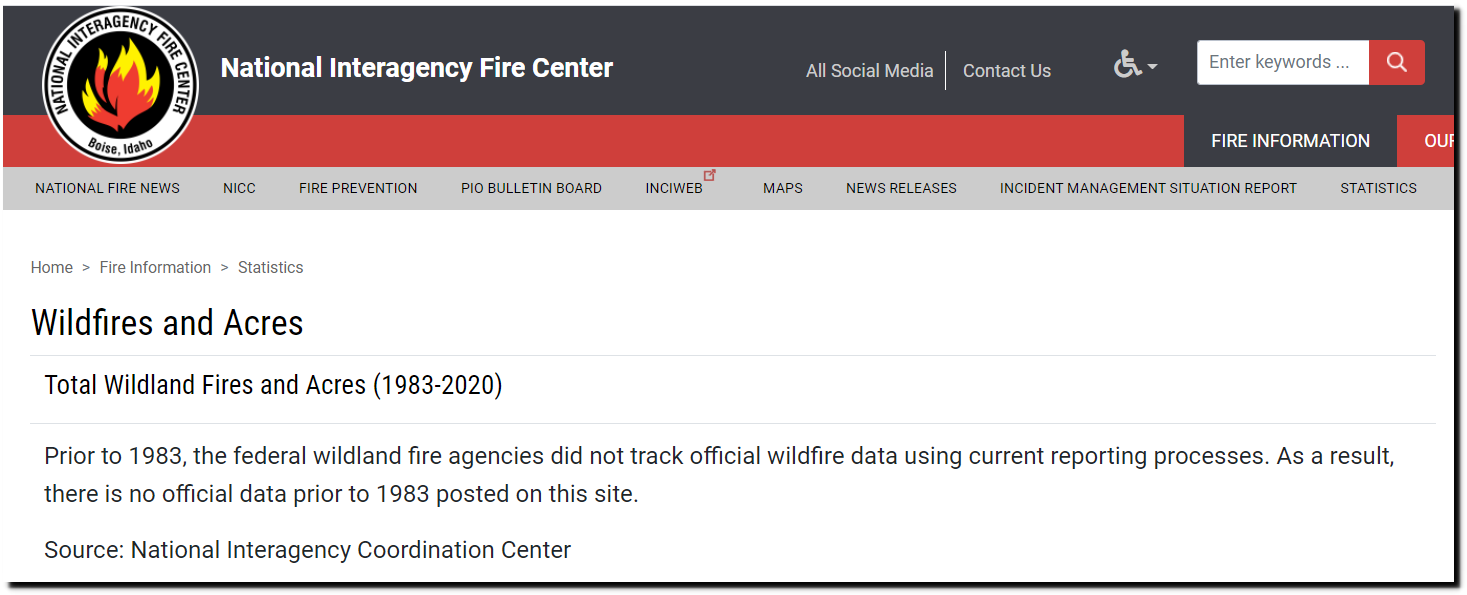
http://www.nifc.gov/fireInfo/fireInfo_stats_totalFires.html
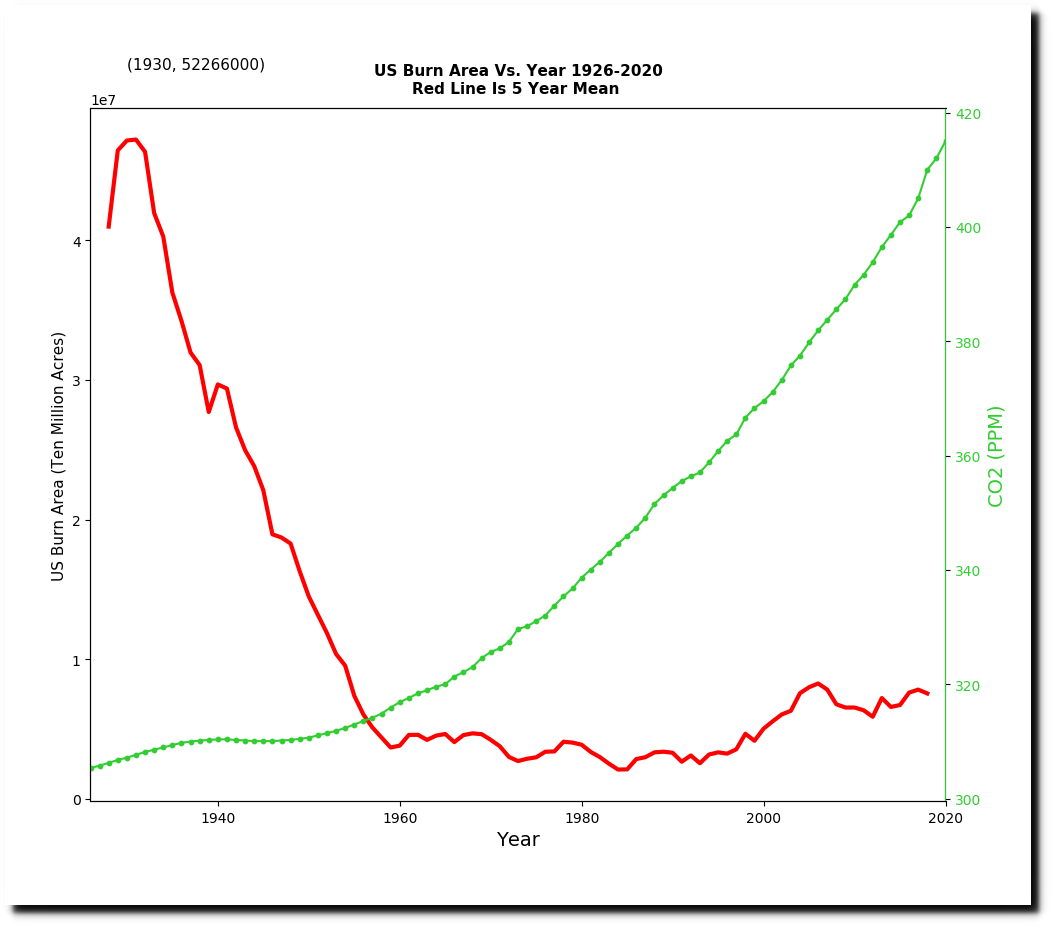
As of January 29 of this year, the same website showed burn acreage back to 1926.
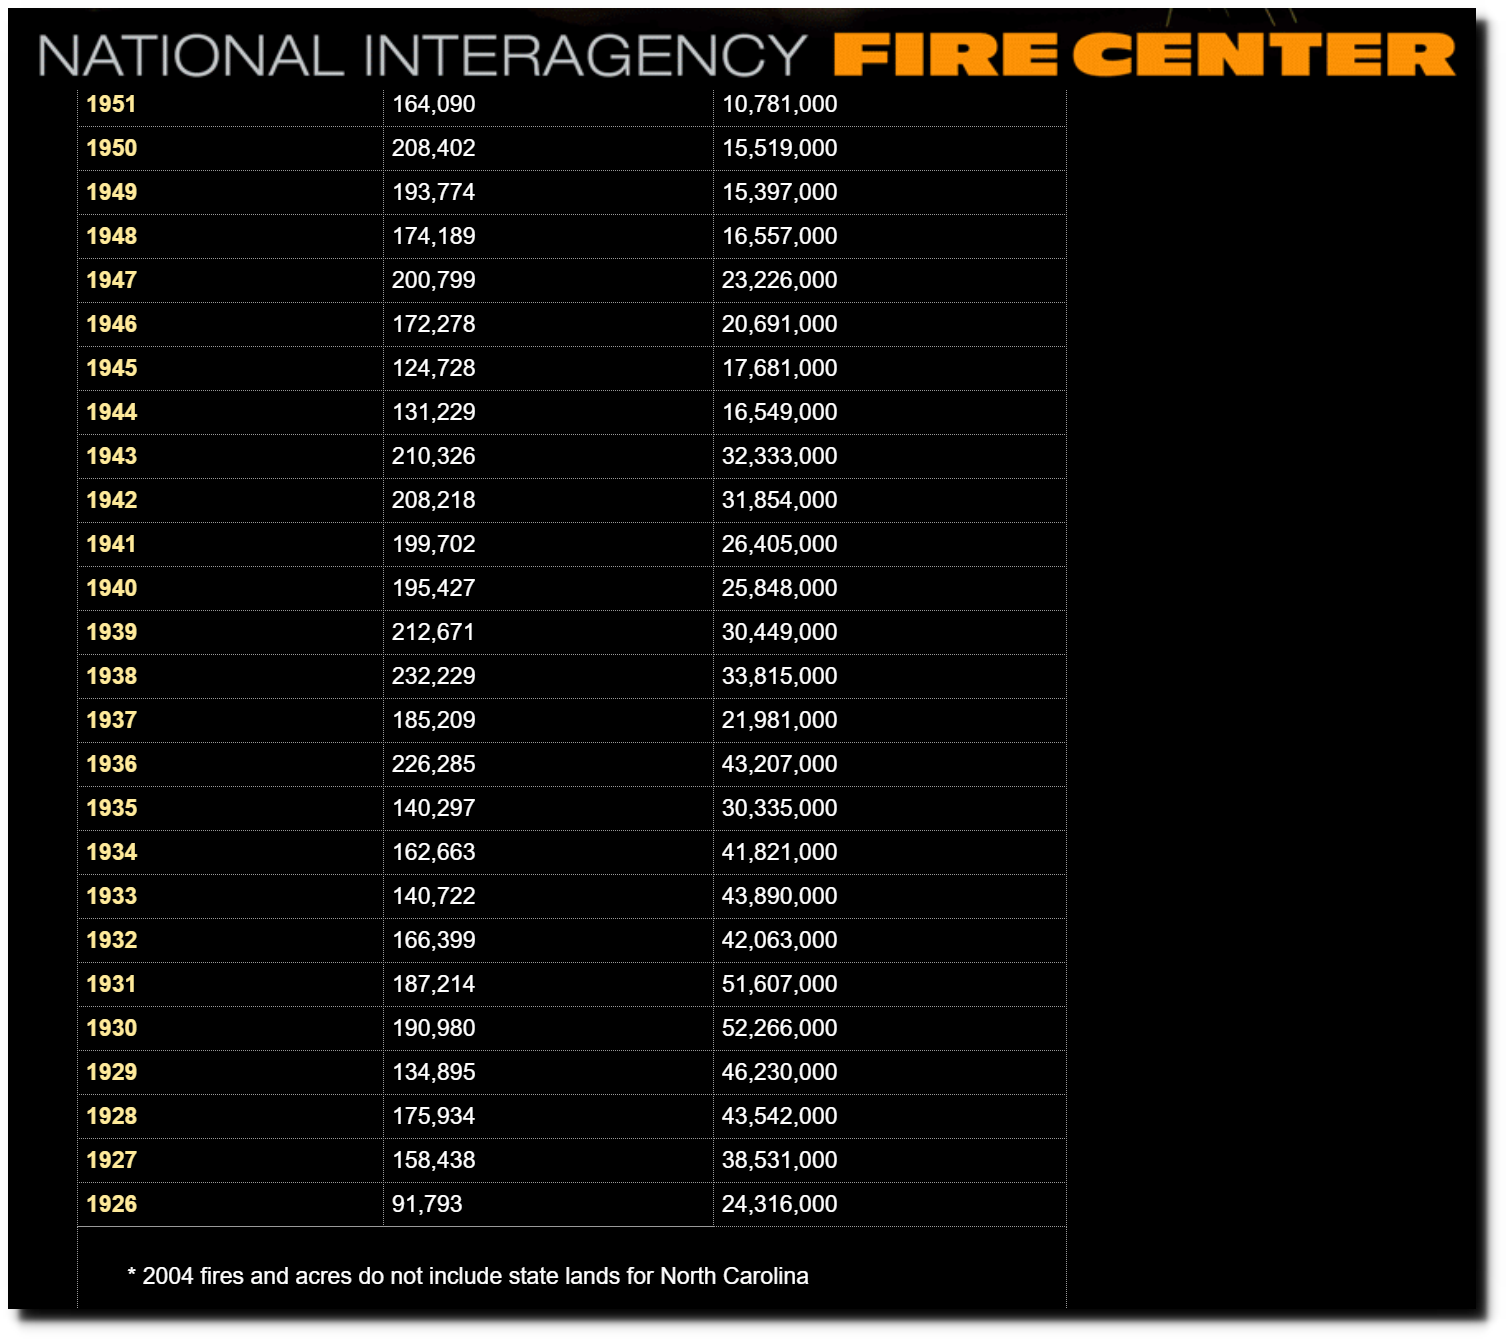
National Interagency Fire Center
The Biden administration picked the low point of the graph to start their new graph and hid all of the earlier data.
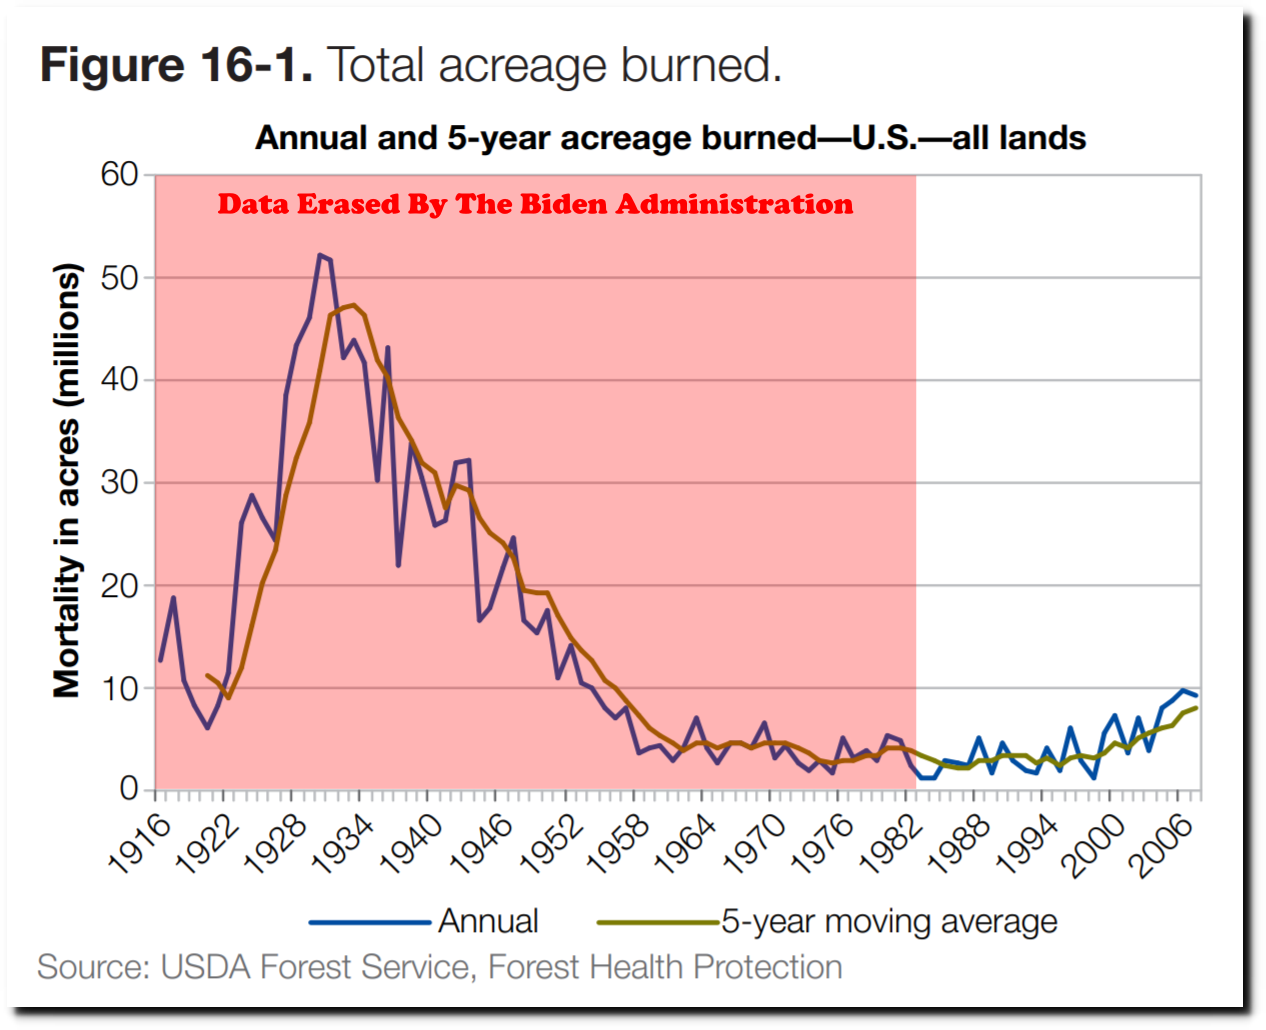
By starting in 1983, they can claim there is a correlation between CO2 and burn acreage.
But the complete data set shows the exact opposite.
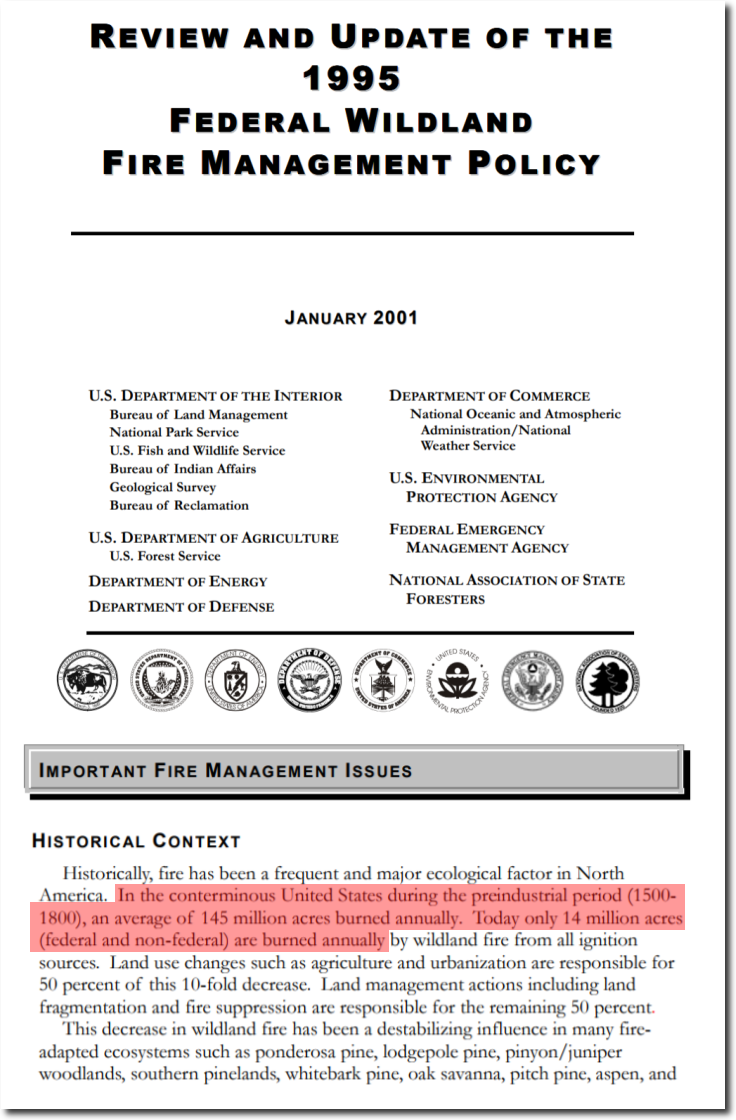
On November 1 of last year, the National Interagency Fire Center had this document on their web site.
“In the conterminous United States during the preindustrial period (1500- 1800), an average of 145 million acres burned annually. Today only 14 million acres (federal and non-federal) are burned annually by wildland fire from all ignition sources.”
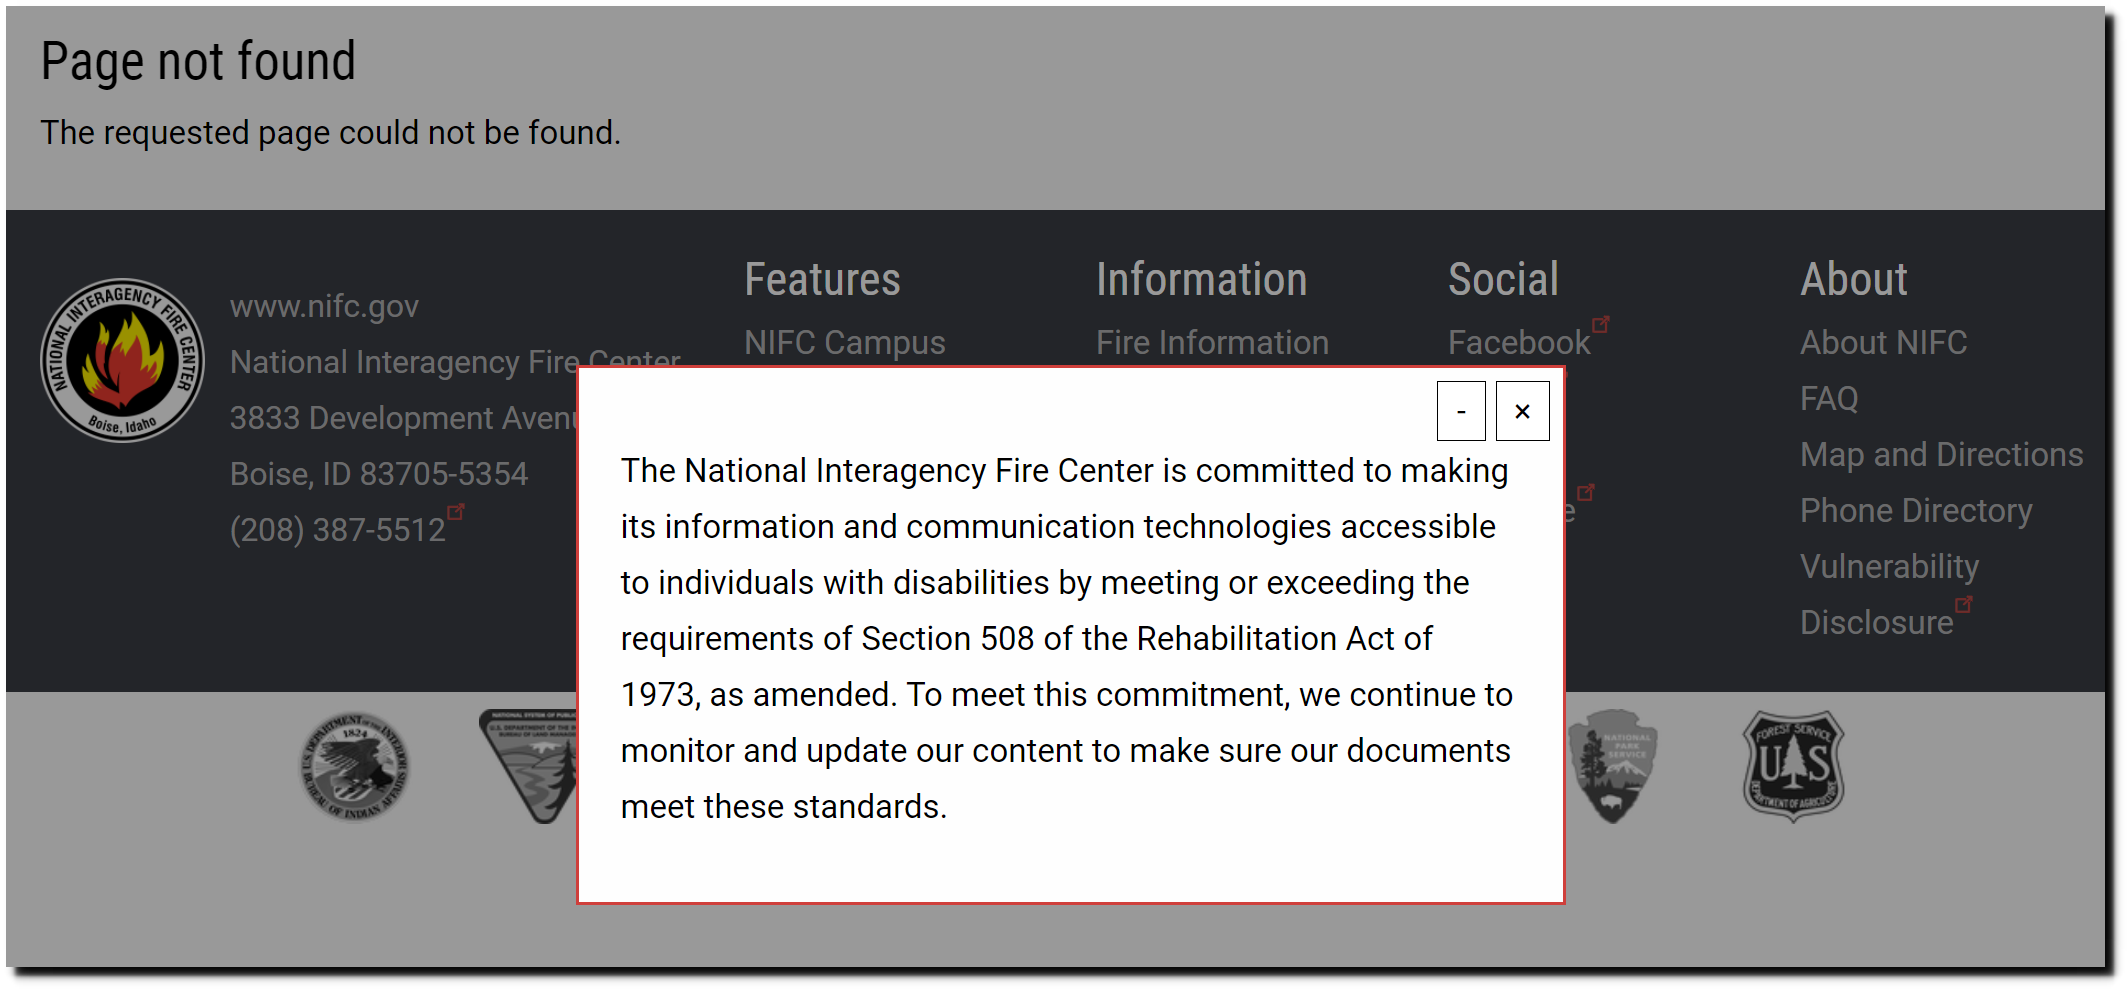
That page has also been erased and now shows this :
“The National Interagency Fire Center is committed to making its information and communication technologies accessible to individuals with disabilities”
Posted in Uncategorized
Leave a comment
Climate Cancel Culture
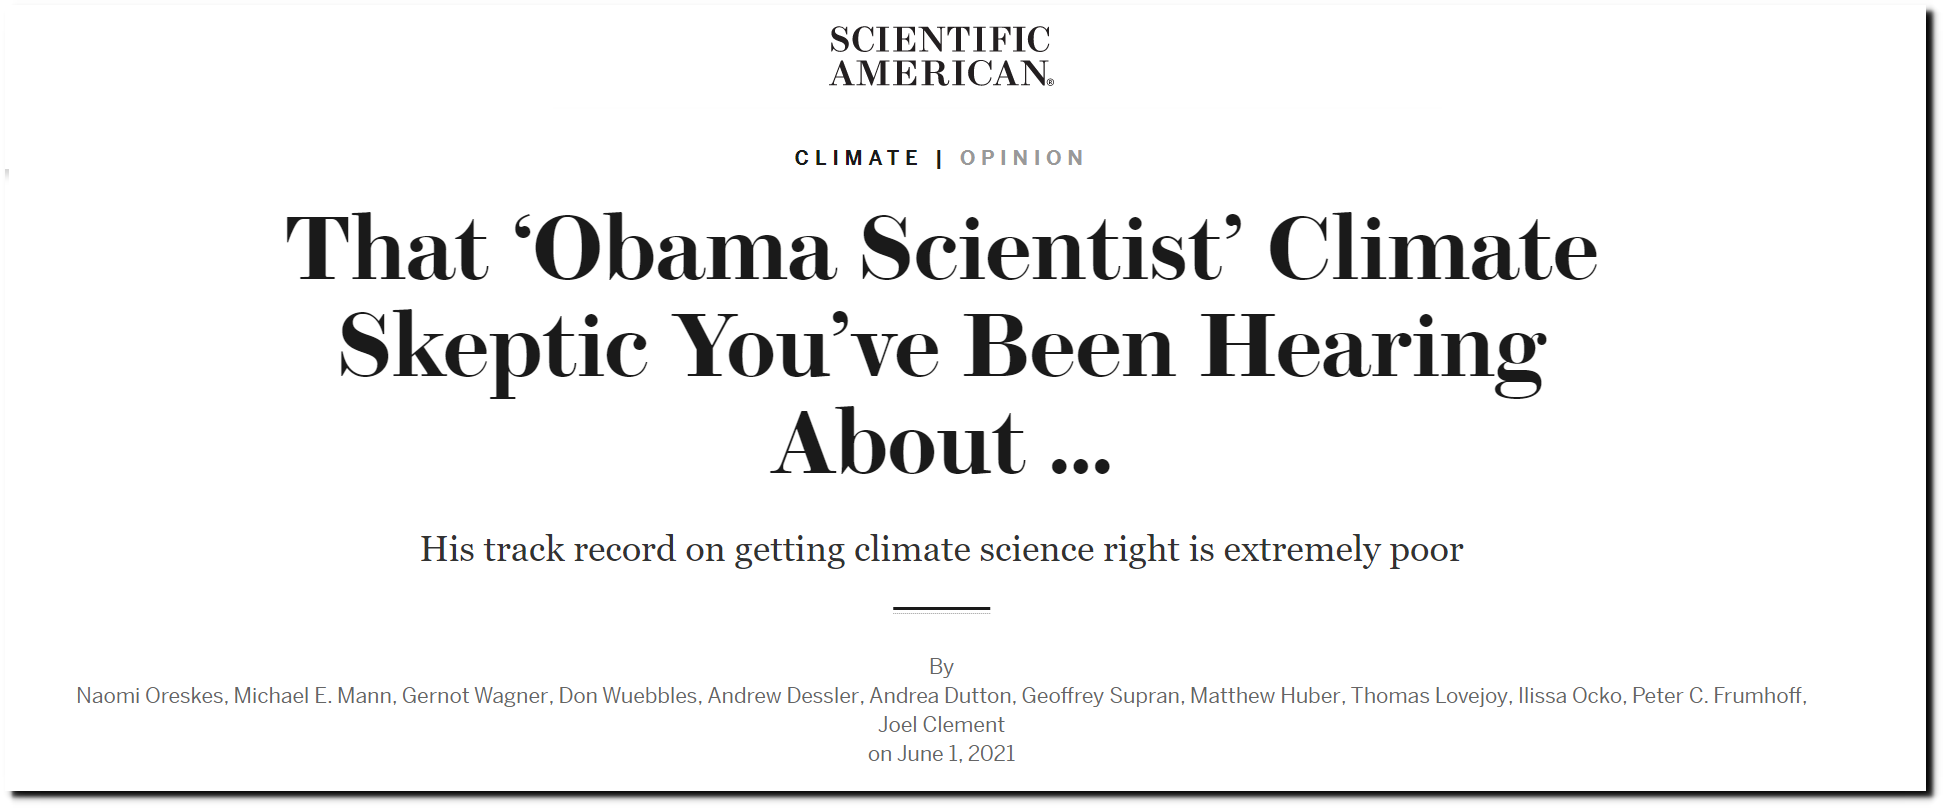
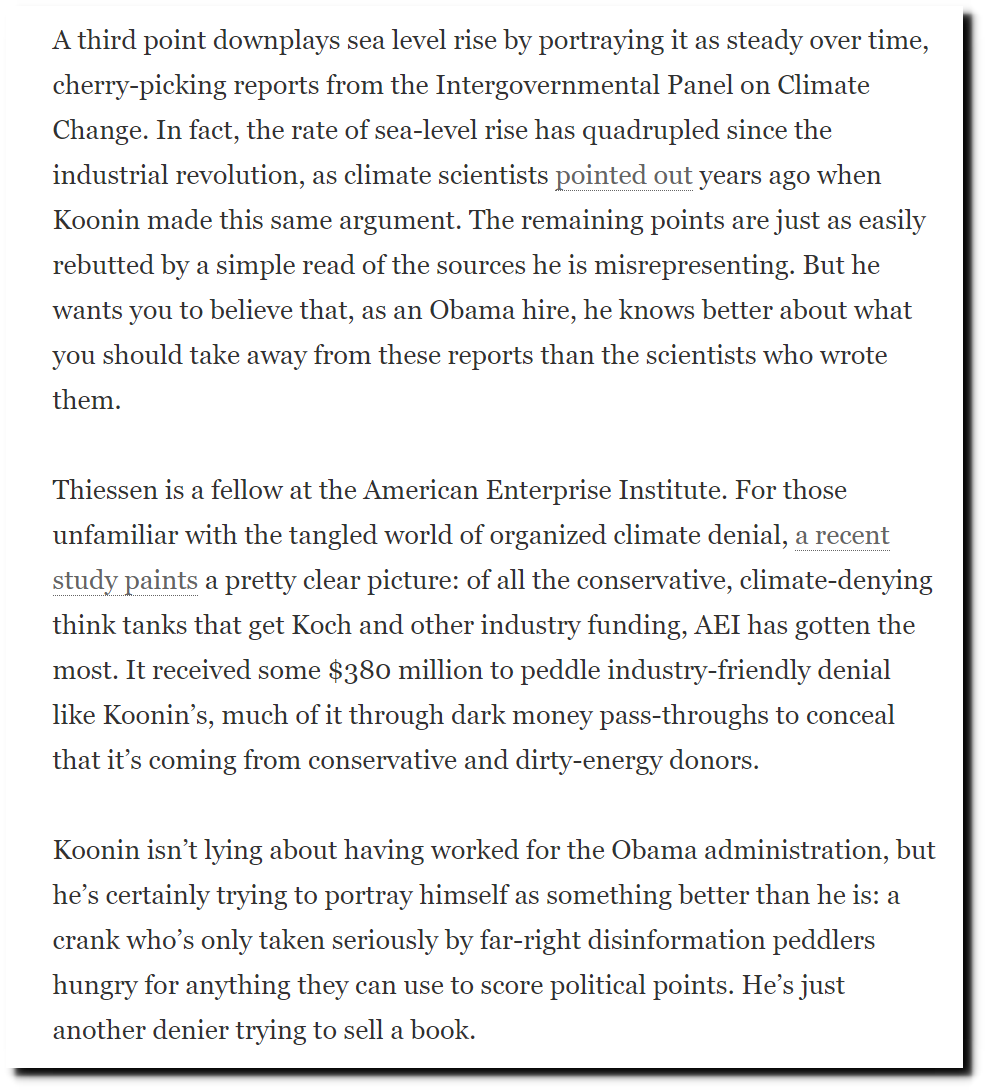
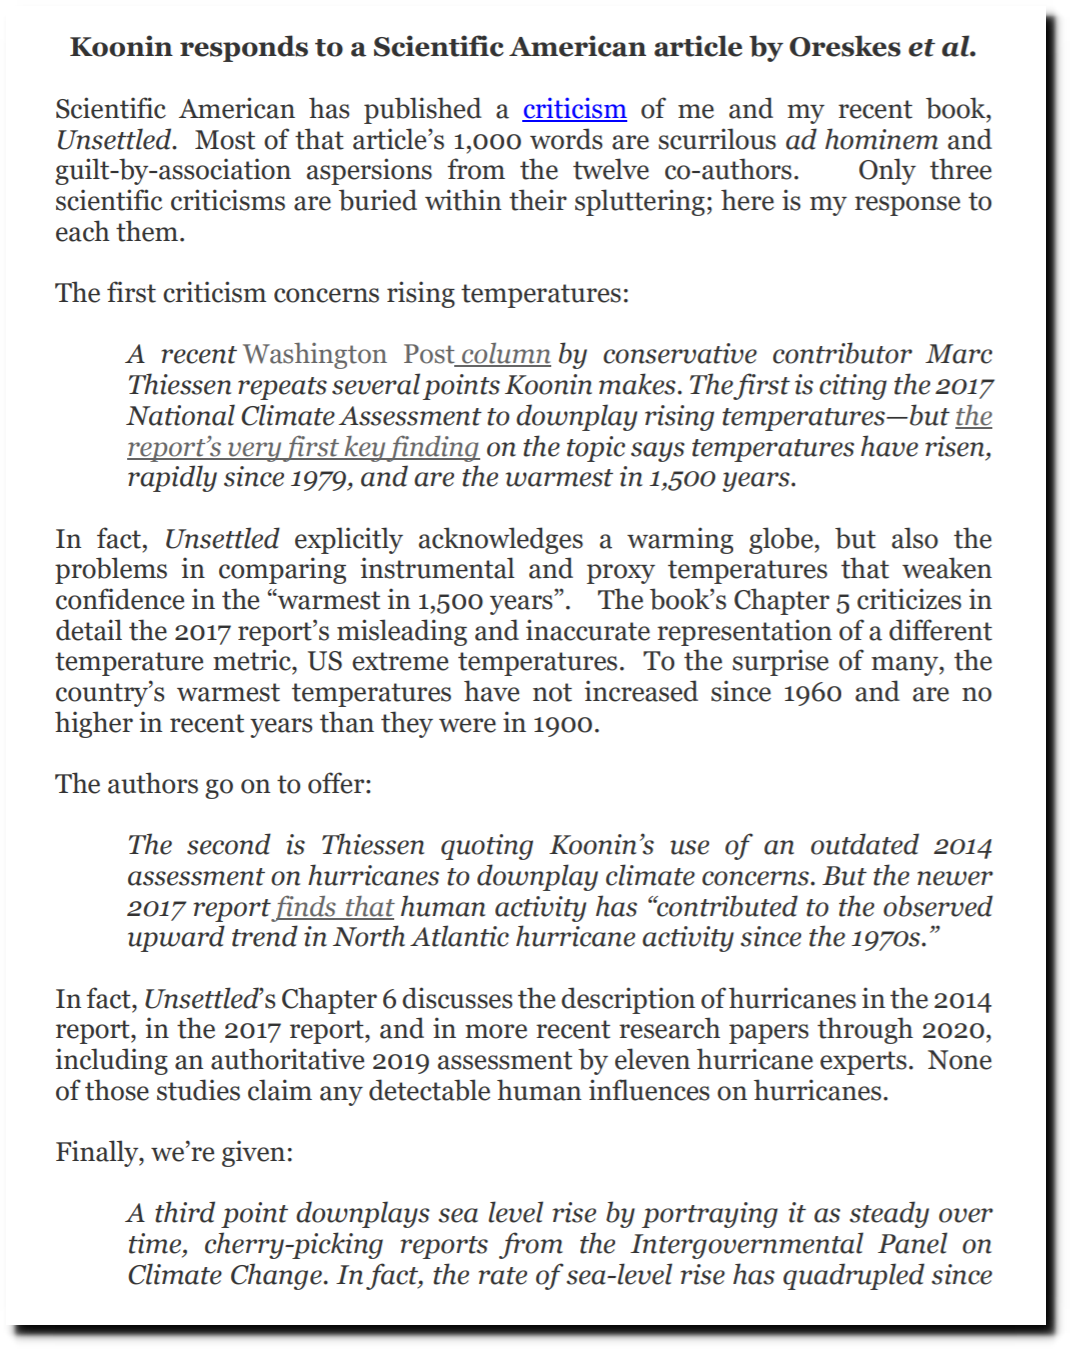
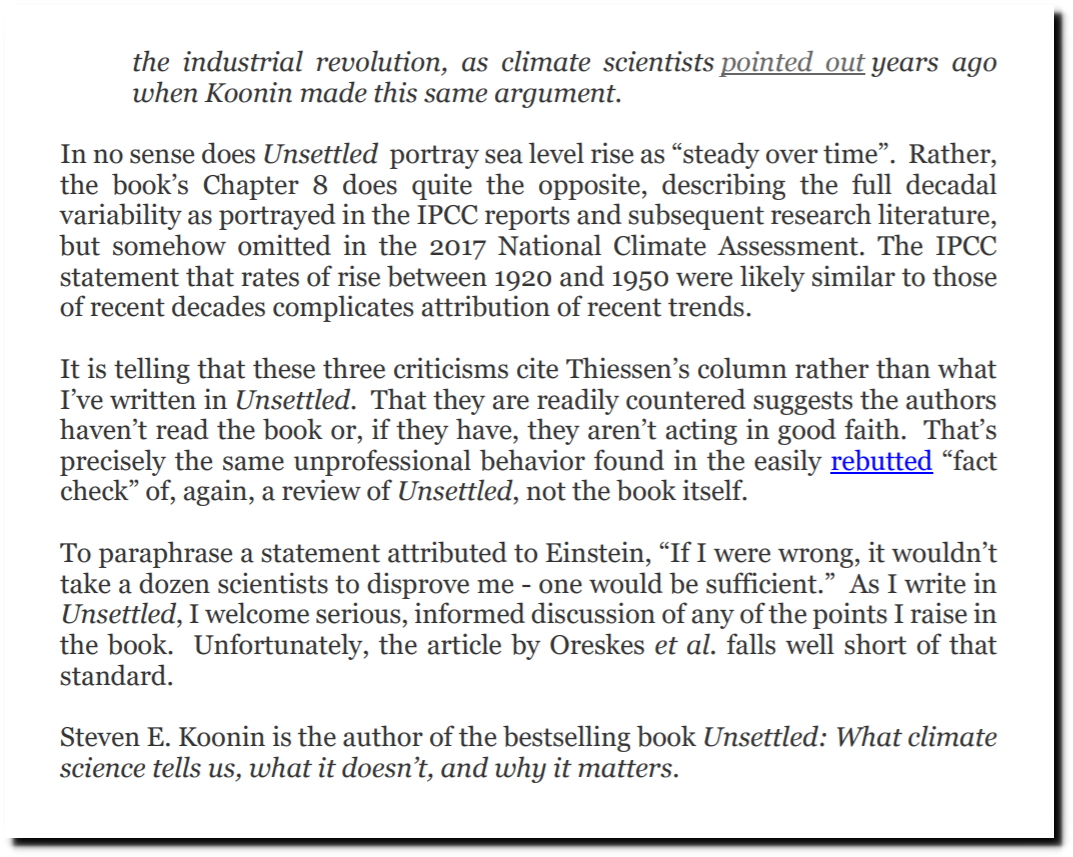
That ‘Obama Scientist’ Climate Skeptic You’ve Been Hearing About … – Scientific American
I attach a response that I submitted yesterday to Scientific American. Not surprisingly, they declined to publish it. Please do distribute my response freely among your contacts or websites.
Steve Koonin
Milloy Says Climate Activism ‘A Cancer on Our Society,’ Before Preaching About Dehumanizing Language

Posted in Uncategorized
Leave a comment
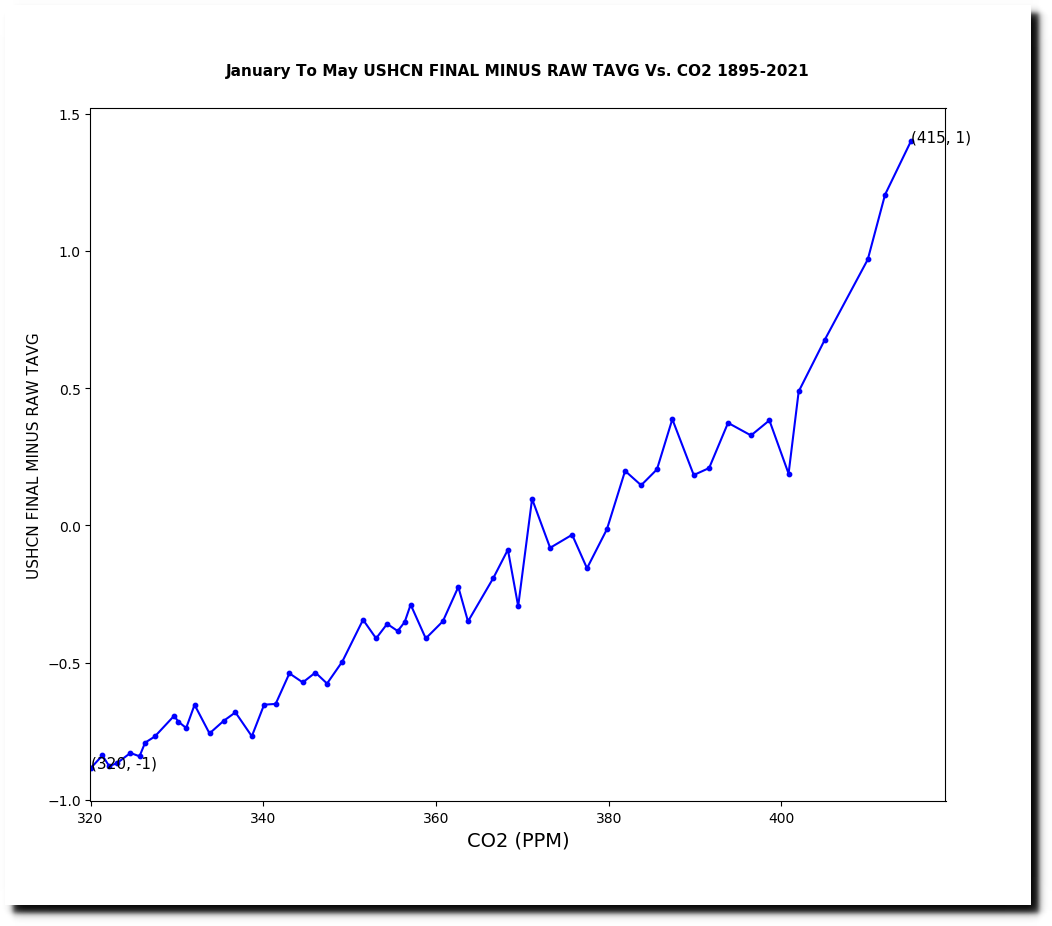
Altering Data To Match Theory
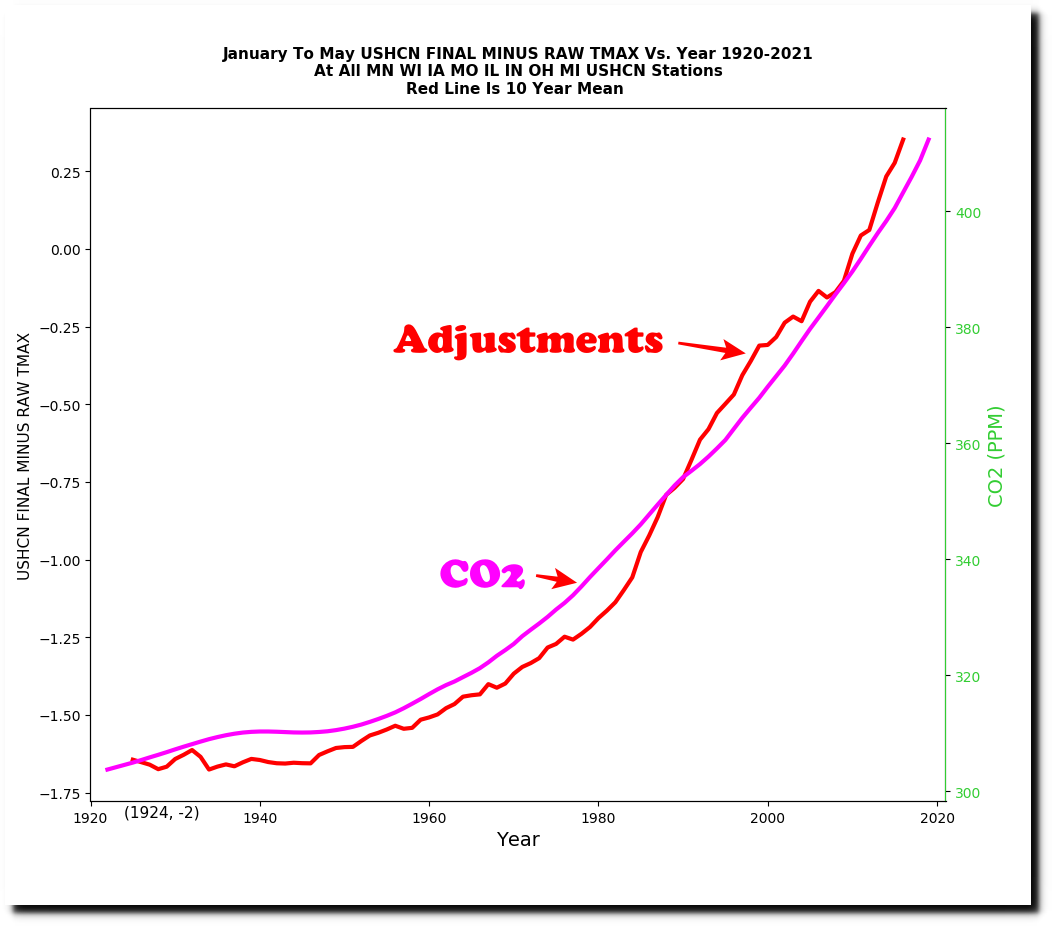
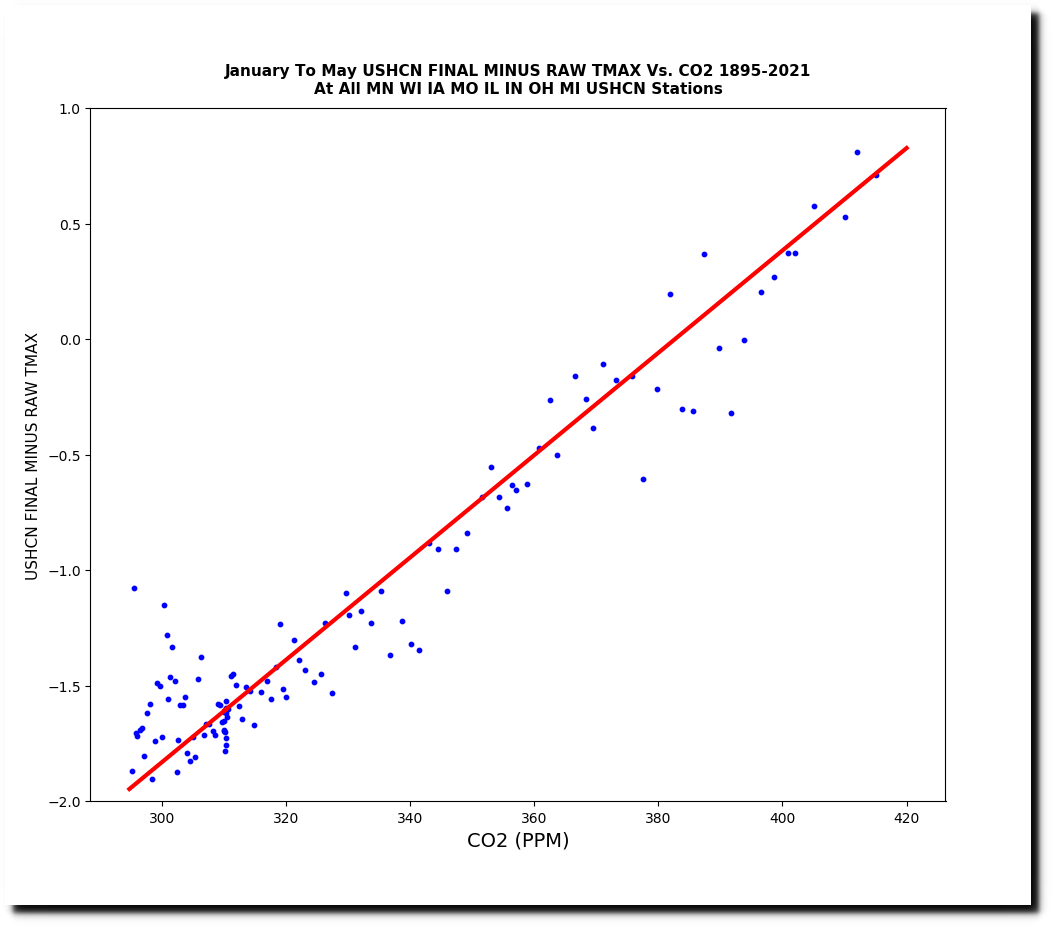
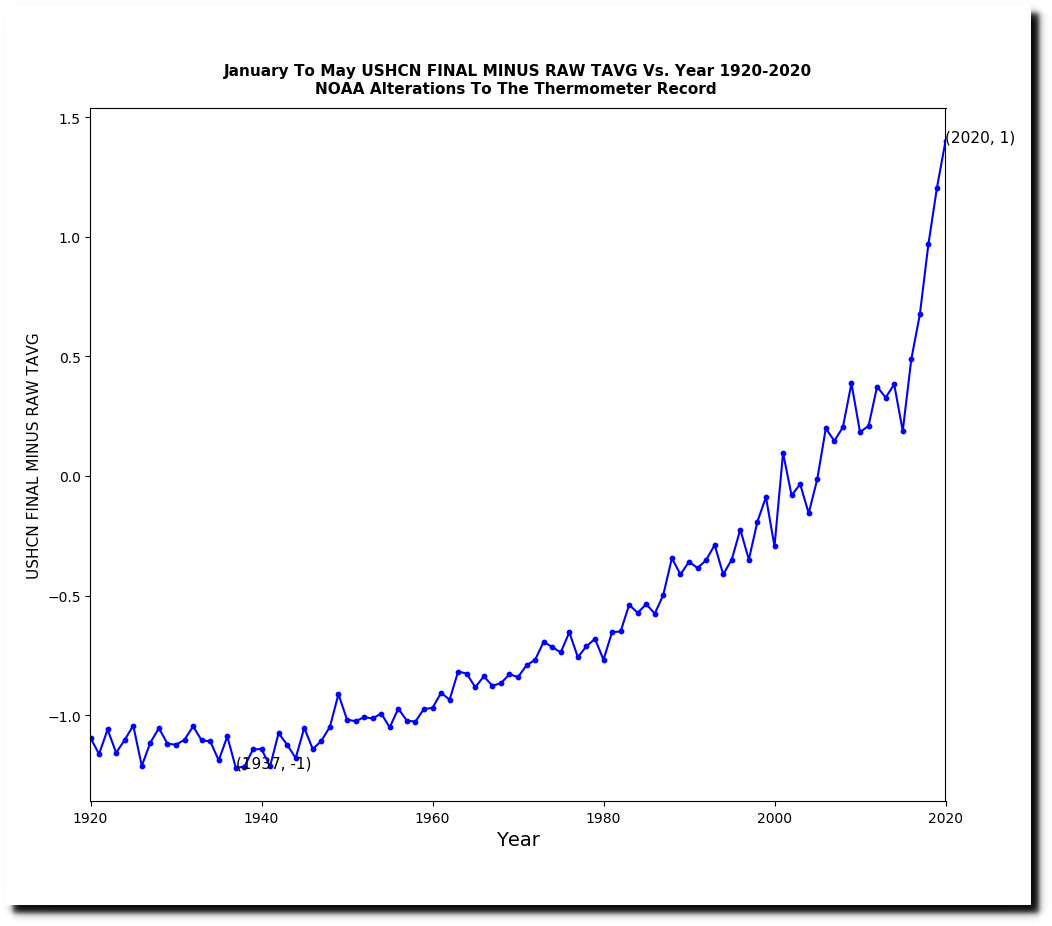
As part of one of the largest racketeering frauds in history, NOAA alters US temperatures almost precisely to match the increase in CO2. The data doesn’t support their greenhouse warming theory, so they tamper with the data.
Posted in Uncategorized
Leave a comment
A New Fraud Algorithm From NOAA
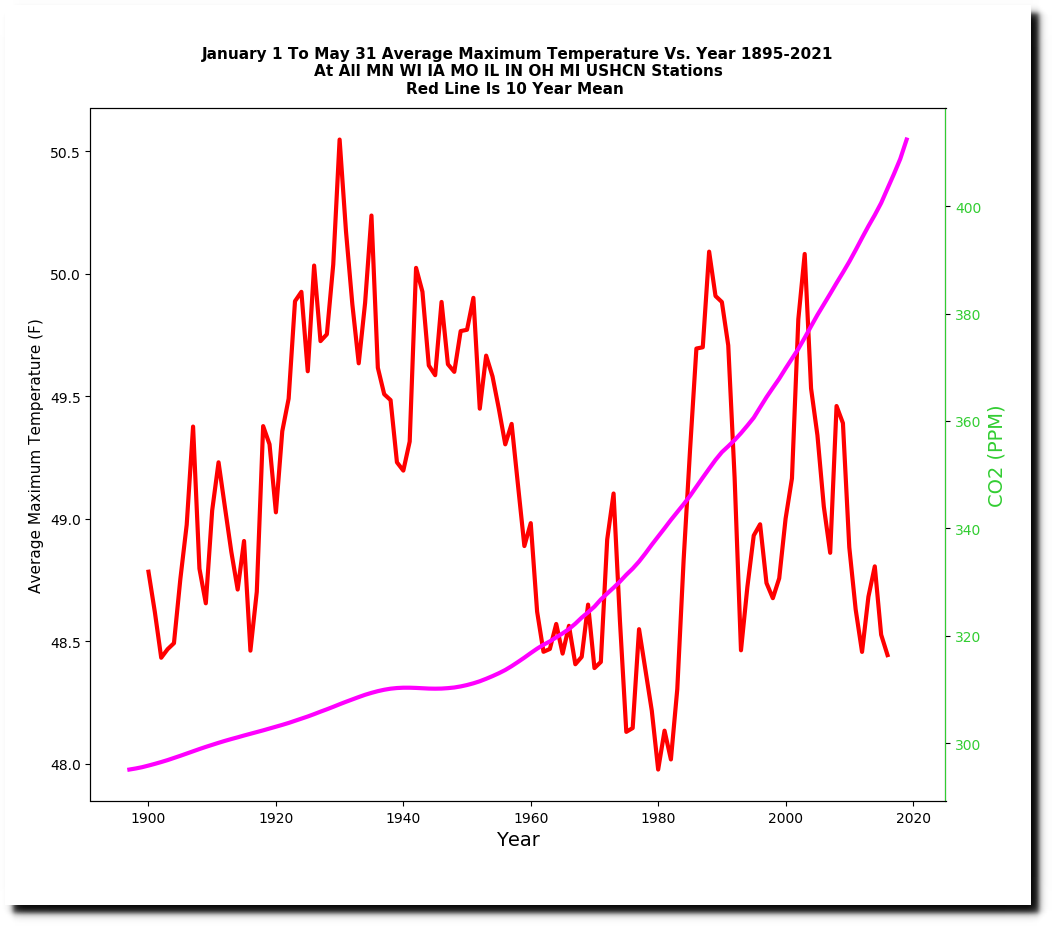
US January-May temperatures have dropped over the past forty years and particularly over the past twenty years.
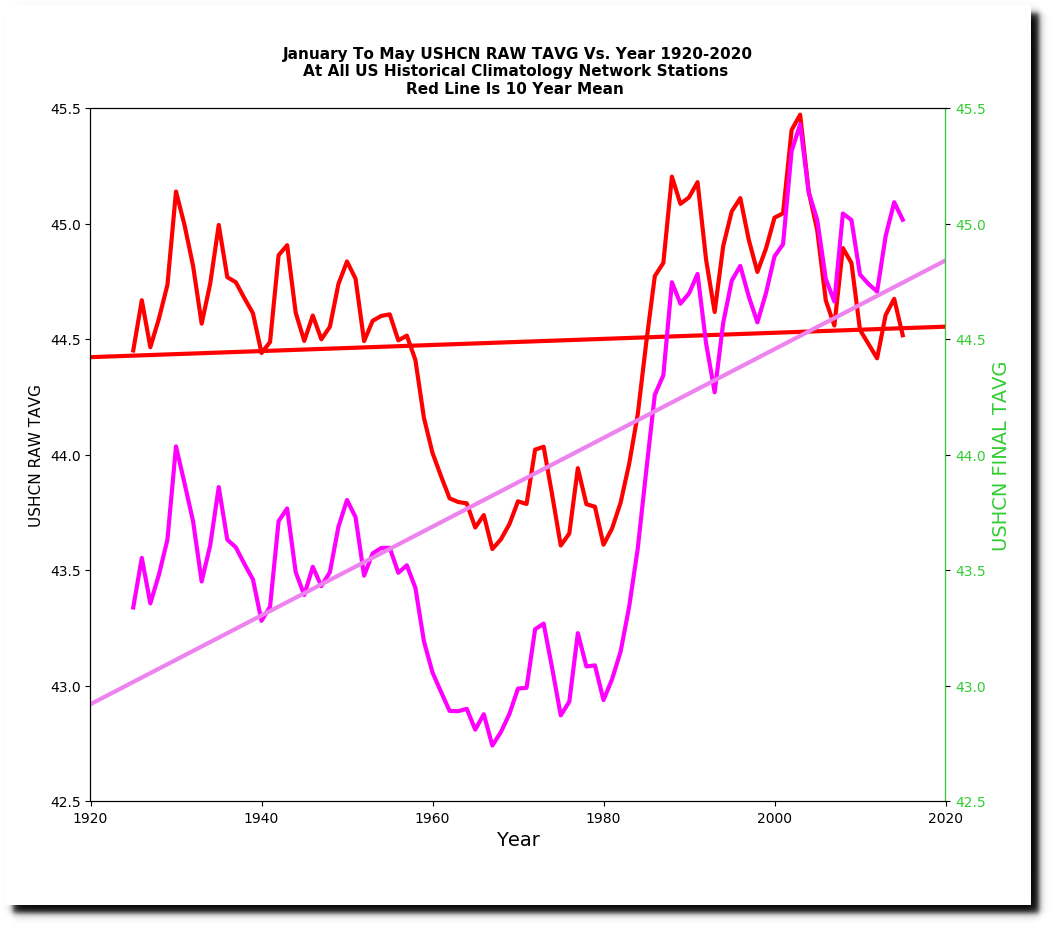
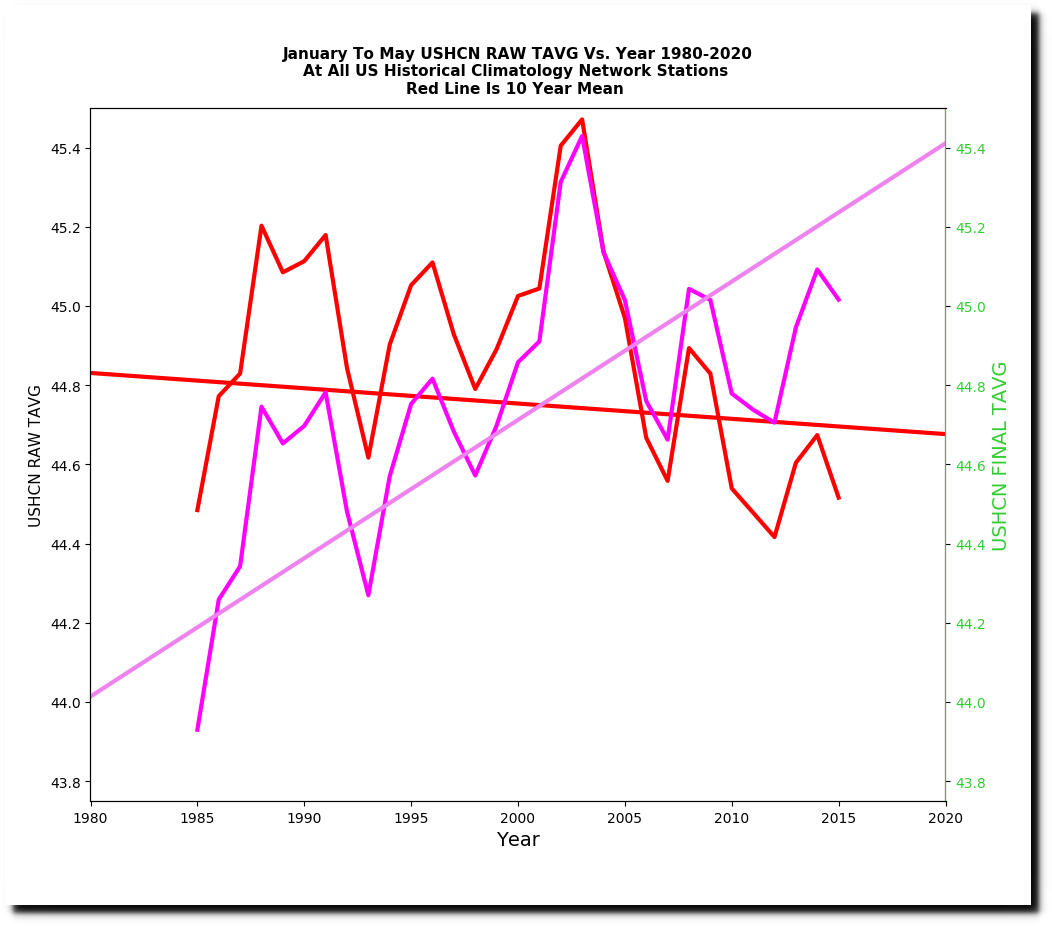
The last three January-May periods in the US have had the least warm weather since the start of the 20th century.


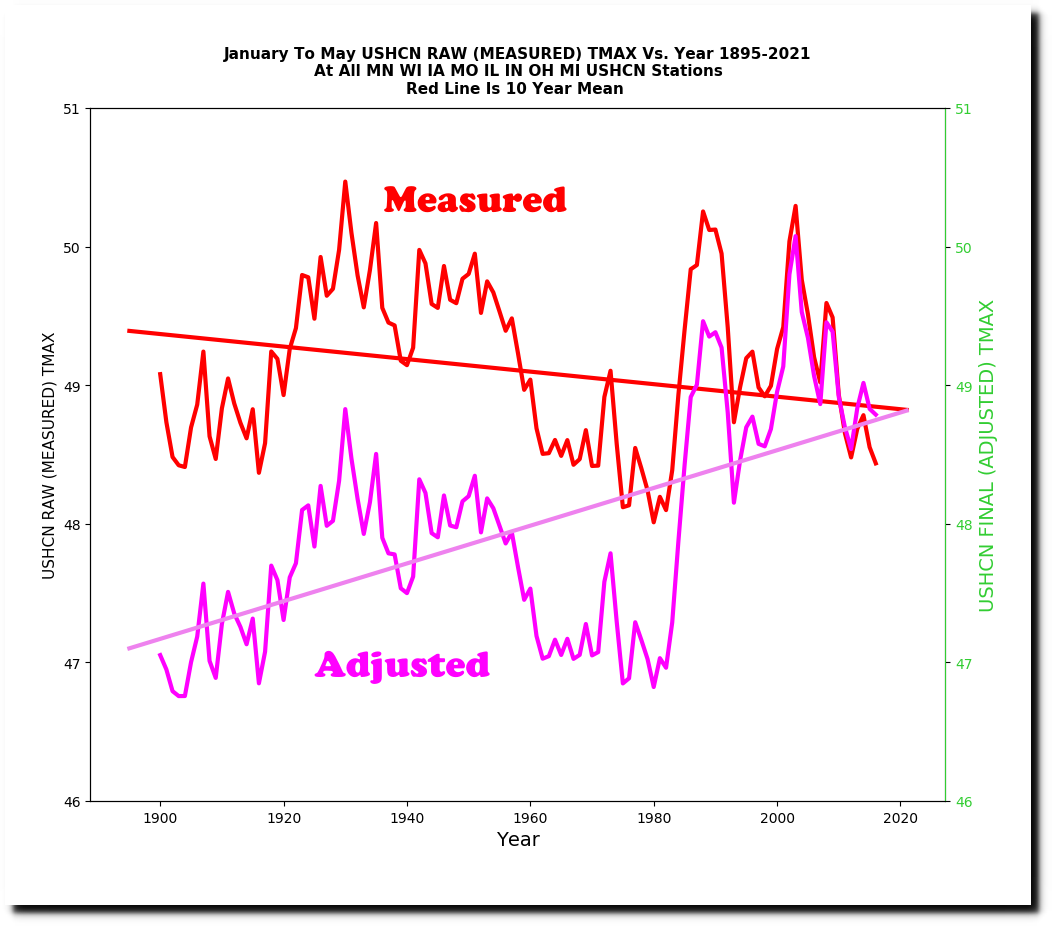
In order to hide this, NOAA has adopted a new algorithm over the past five years where they simply add huge amounts of additional data tampering on top of their normal fraud.
The tampering is particularly bad for maximum temperatures.
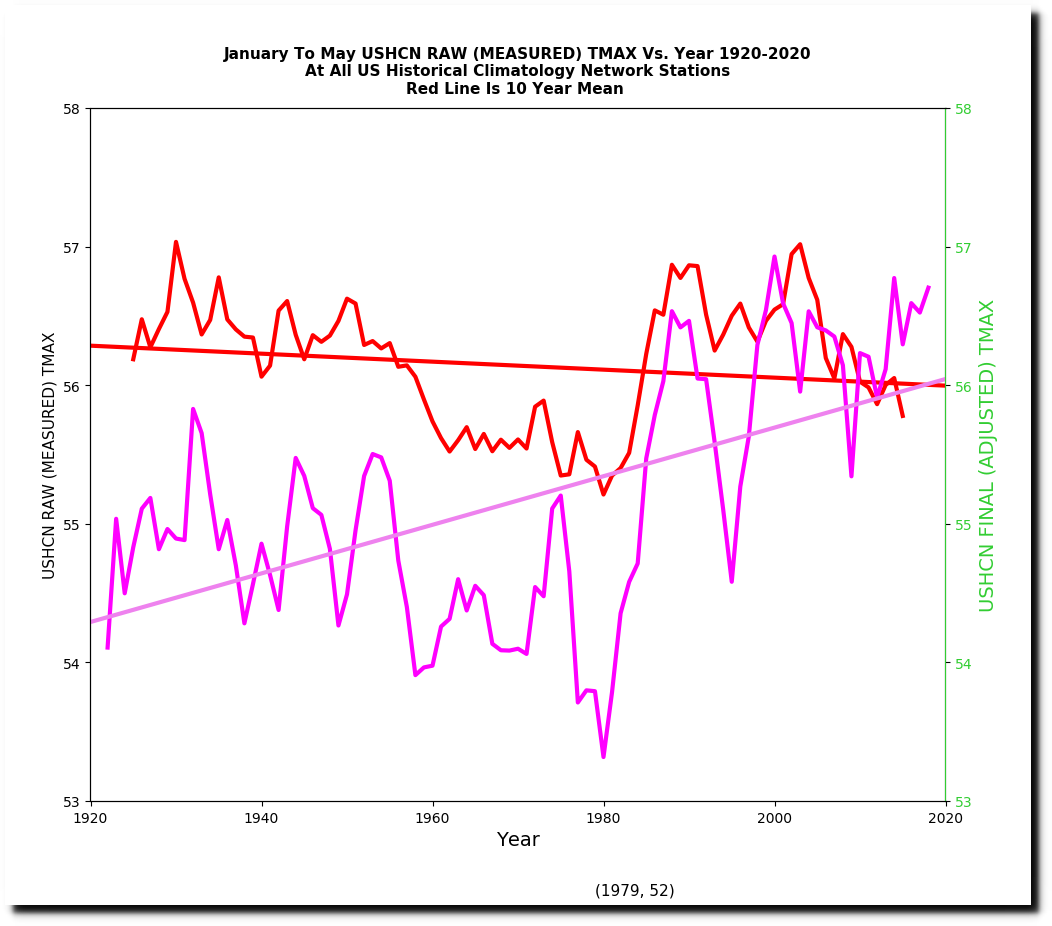
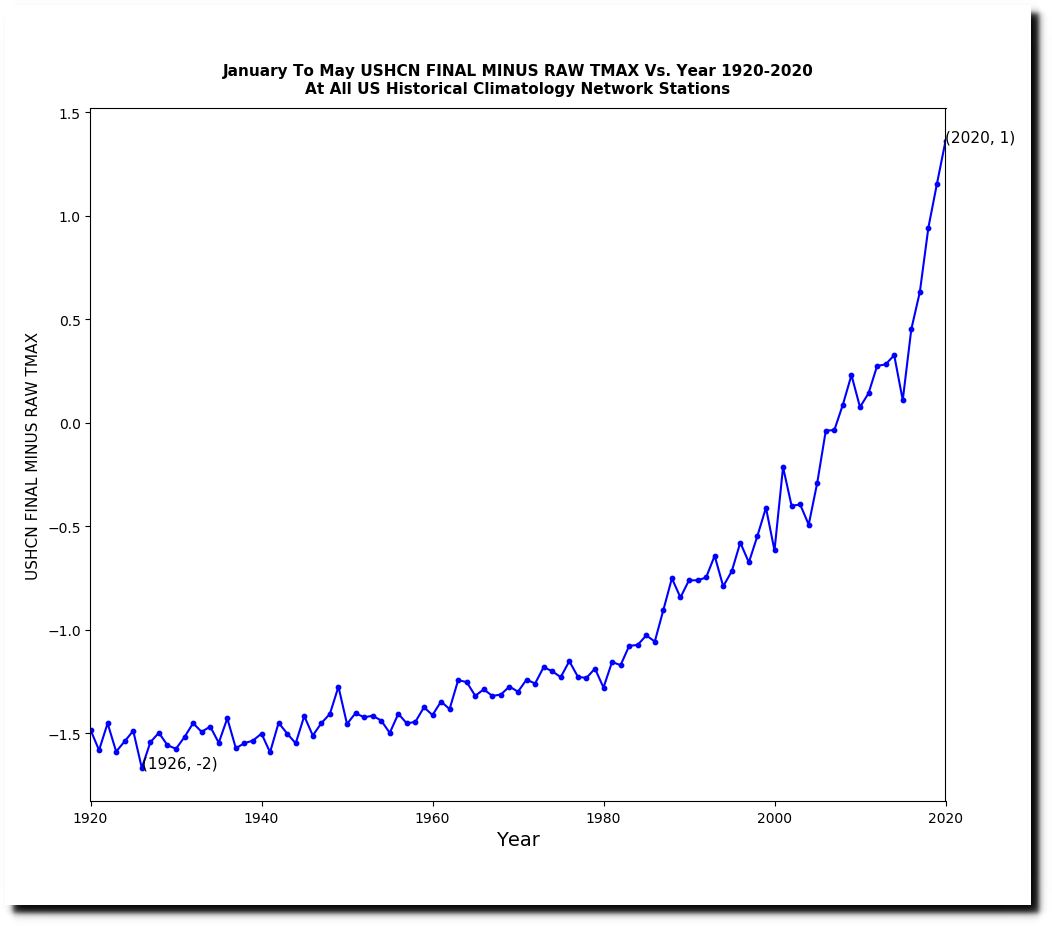
Until 400 PPM CO2, the data tampering used to track CO2, but even that fraud wasn’t enough to keep up with the cooling, so they have adopted new tactics.
Posted in Uncategorized
Leave a comment