

Joe Biden was the most inspiring candidate in election history, and received more than 80 million votes.

Joe Biden was the most inspiring candidate in election history, and received more than 80 million votes.
Ten years ago today, the Daily Mail announced that global warming was causing early springs.
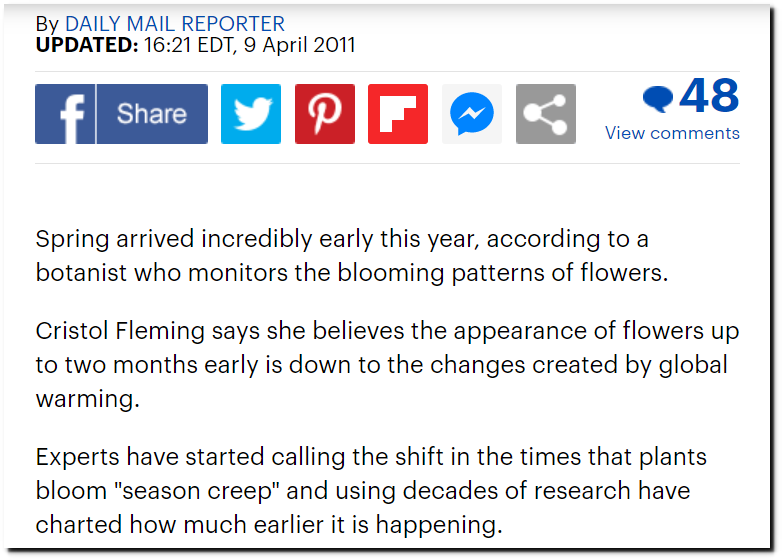
The seasons shift: how spring is coming EARLIER thanks to global warming | Daily Mail Online
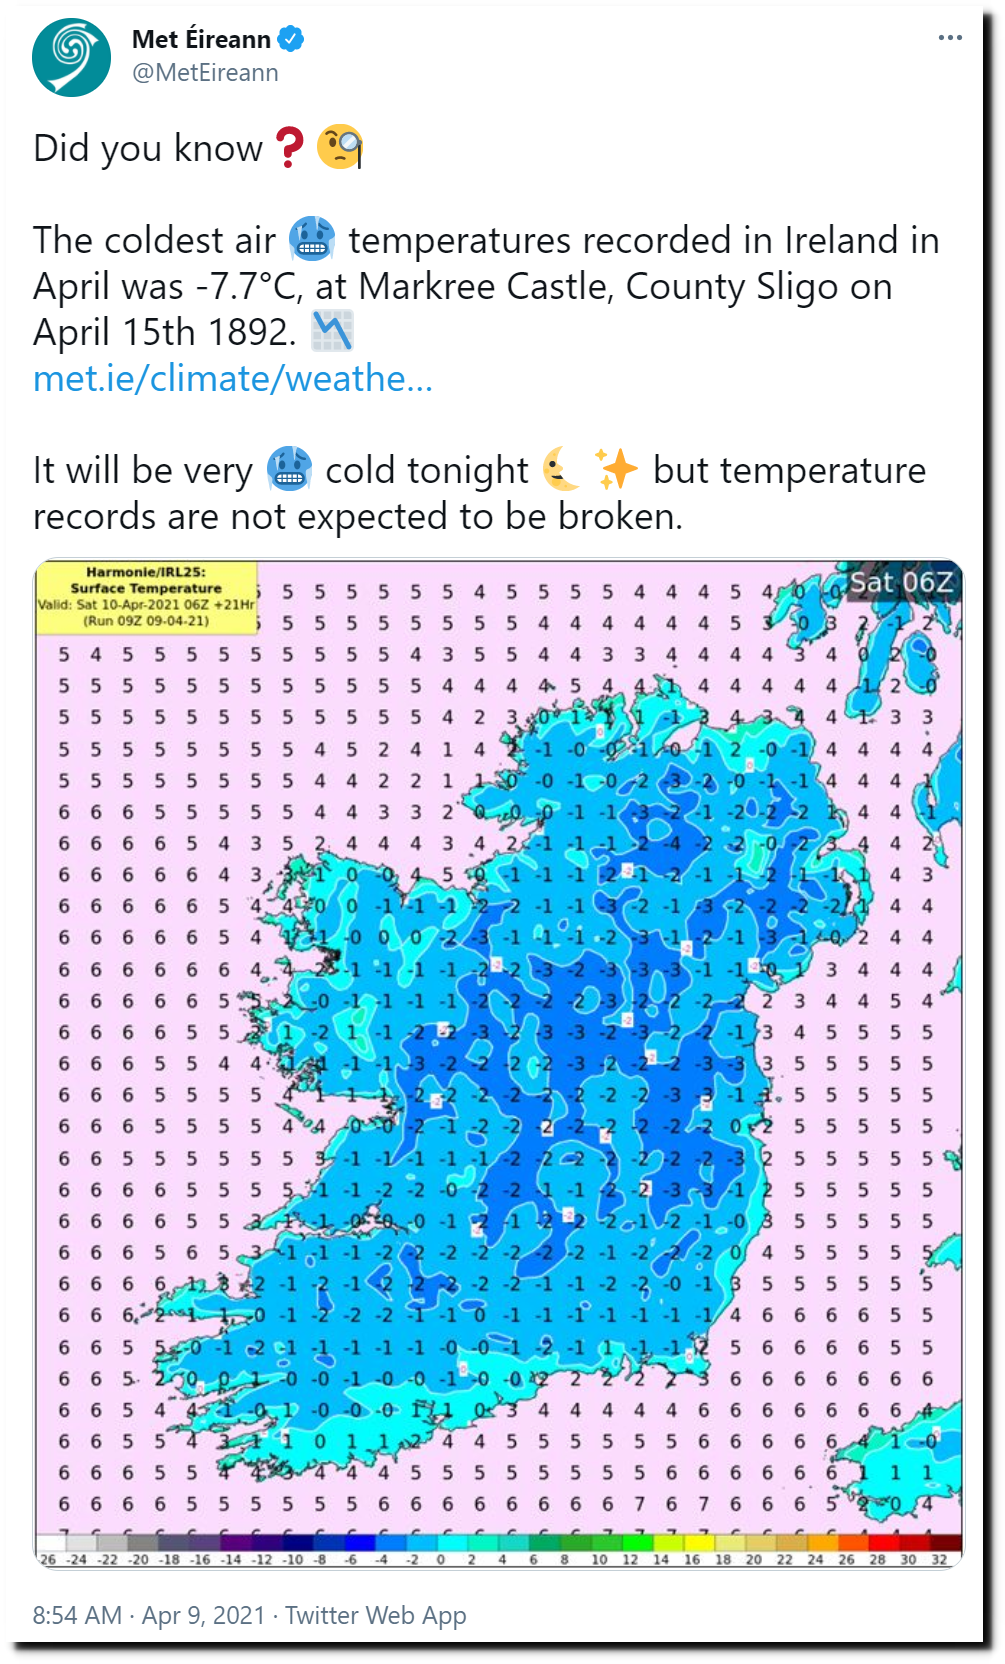
And today, the Irish Met Office predicted the coldest April night in almost 130 years.
“In the event that I am reincarnated, I would like to return as a deadly virus, to contribute something to solving overpopulation.”
– Prince Philip 1988

31 Oct 2005, Page 9 – The Palm Beach Post at Newspapers.com
Al Gore started America down a dangerous path 30 years ago, and Joe Biden is poised to push America over the cliff now. This video covers the last 30 years of global warming superstition, corruption and madness.
“The fact is that we can’t account for the lack of warming at the moment and it is a travesty that we can’t”
– Kevin Trenberth NCAR 2009
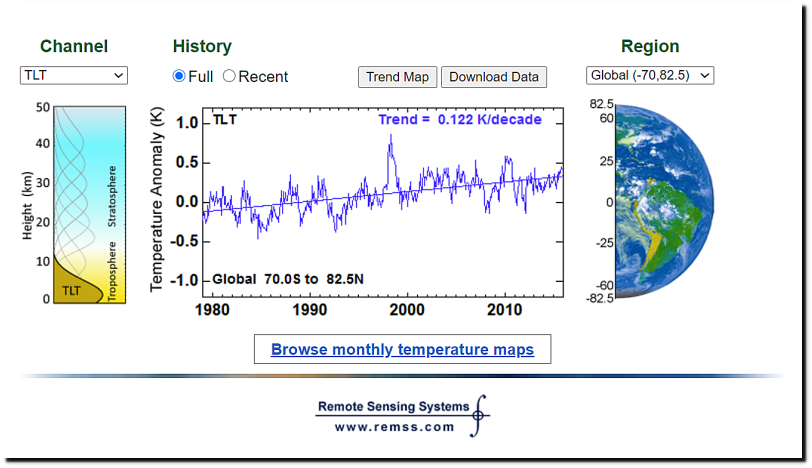
In 2015, satellites showed that the world had cooled since the beginning of the century.
A Pattern Of Repeated Fraud By Climate Scientists | Real Climate Science
This didn’t suit the agenda, so government scientists declared the “pause” to be invalid.
US scientists: Global warming pause ‘no longer valid’ – BBC News
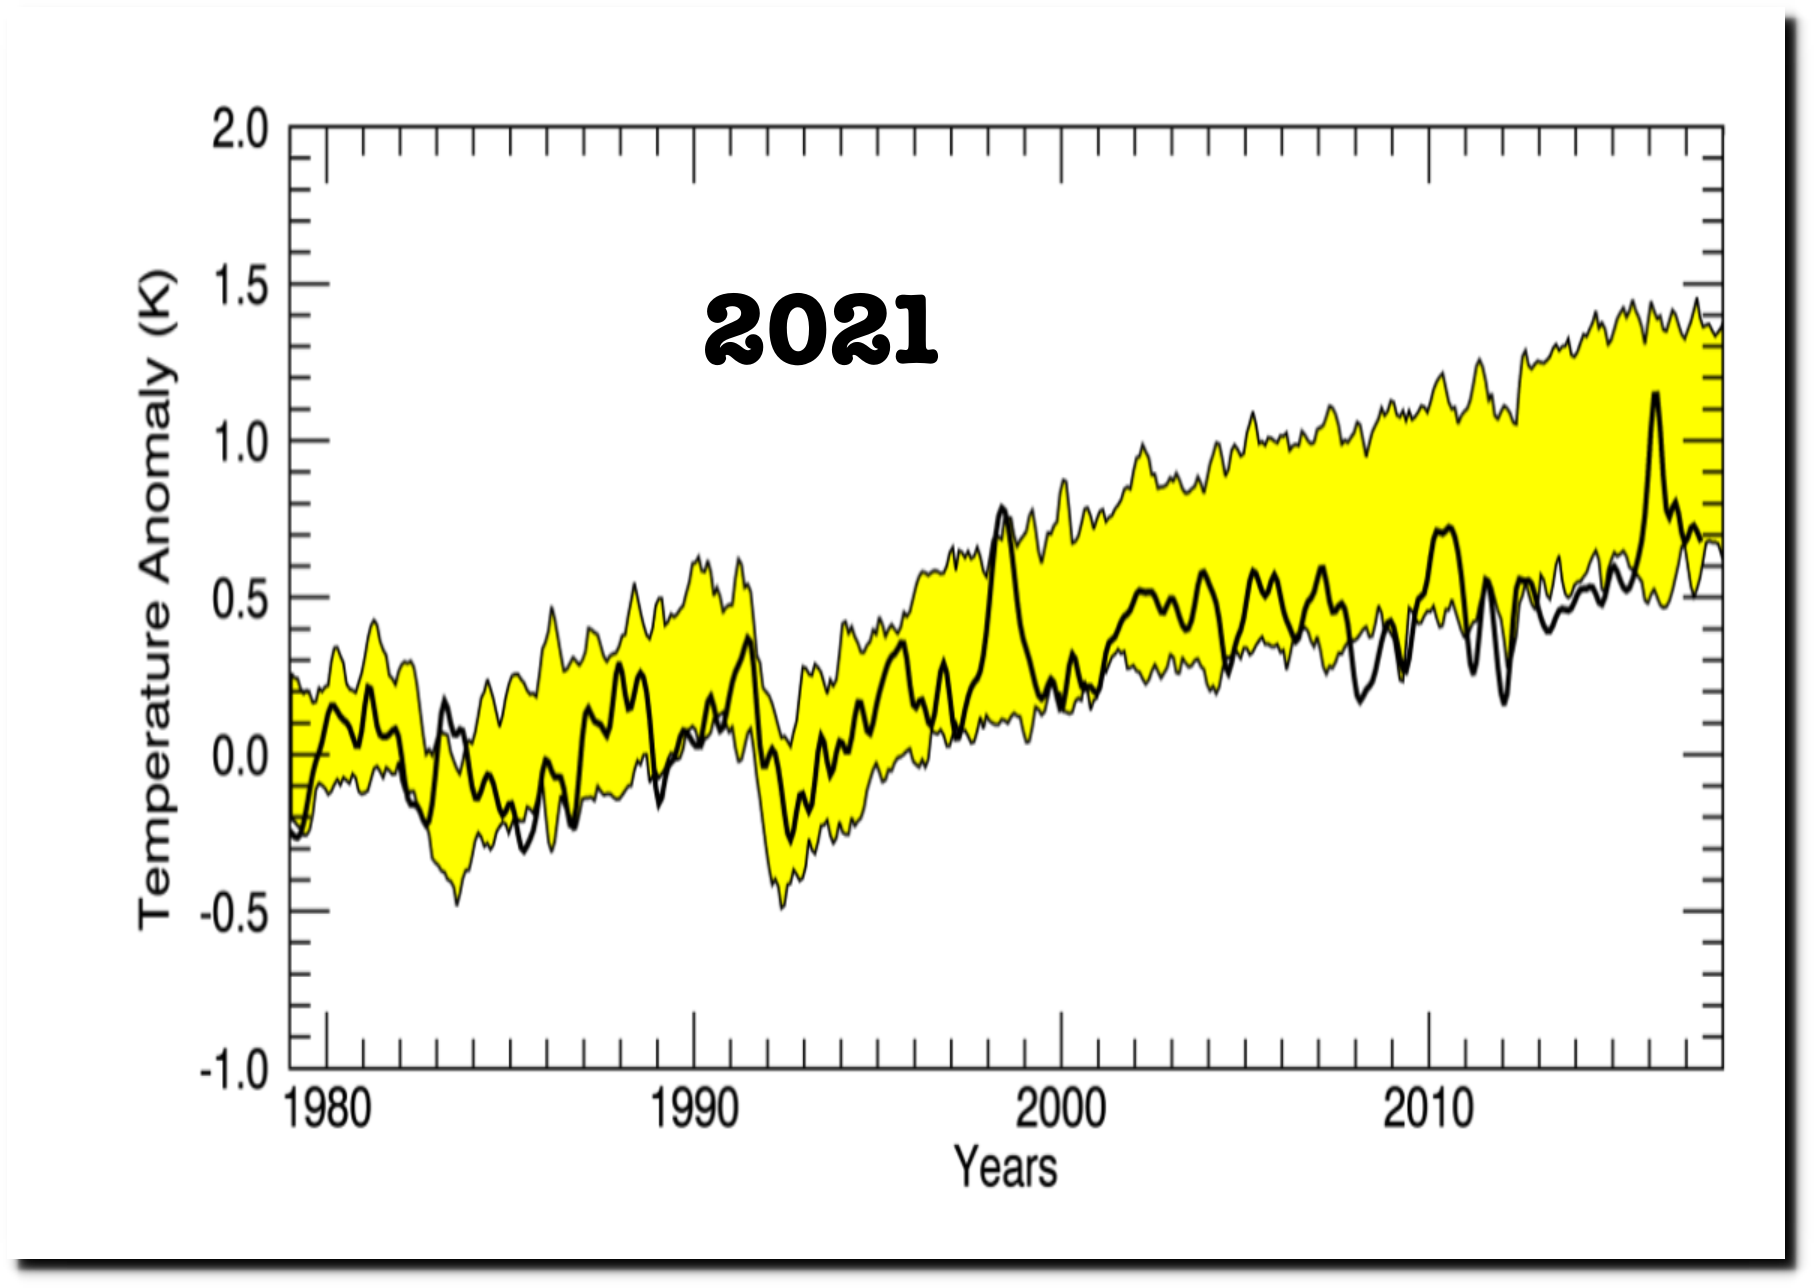
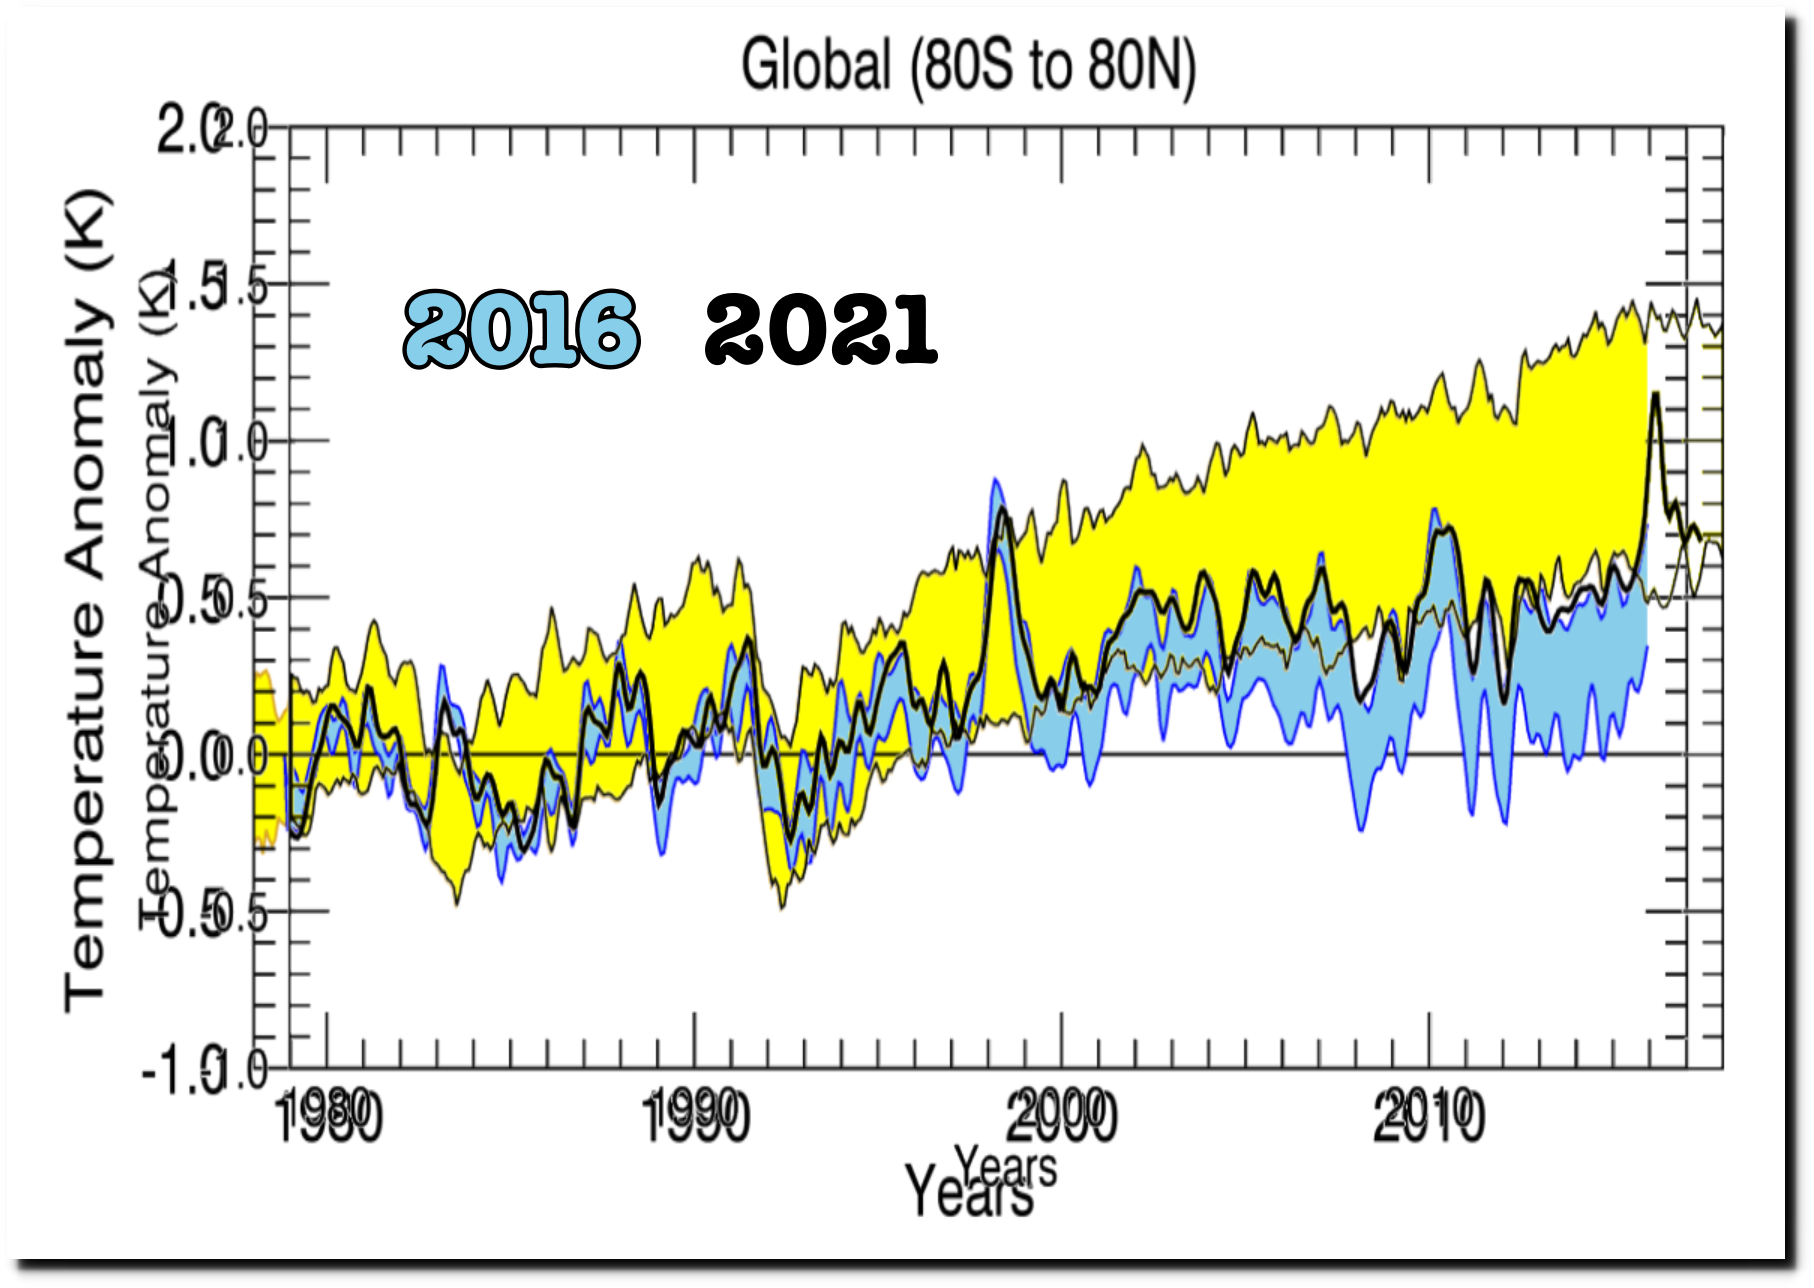
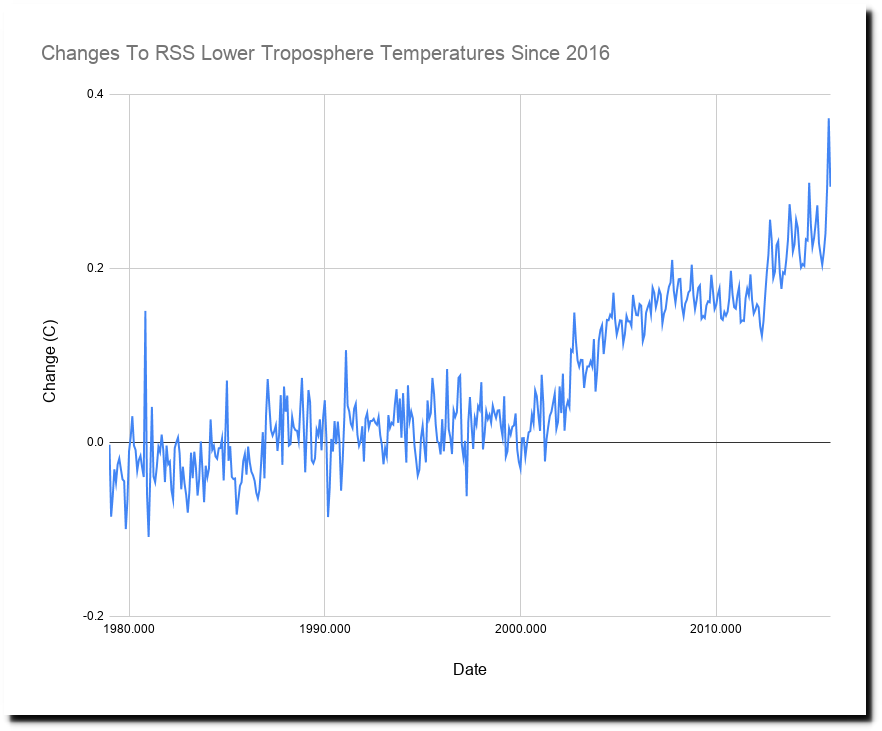
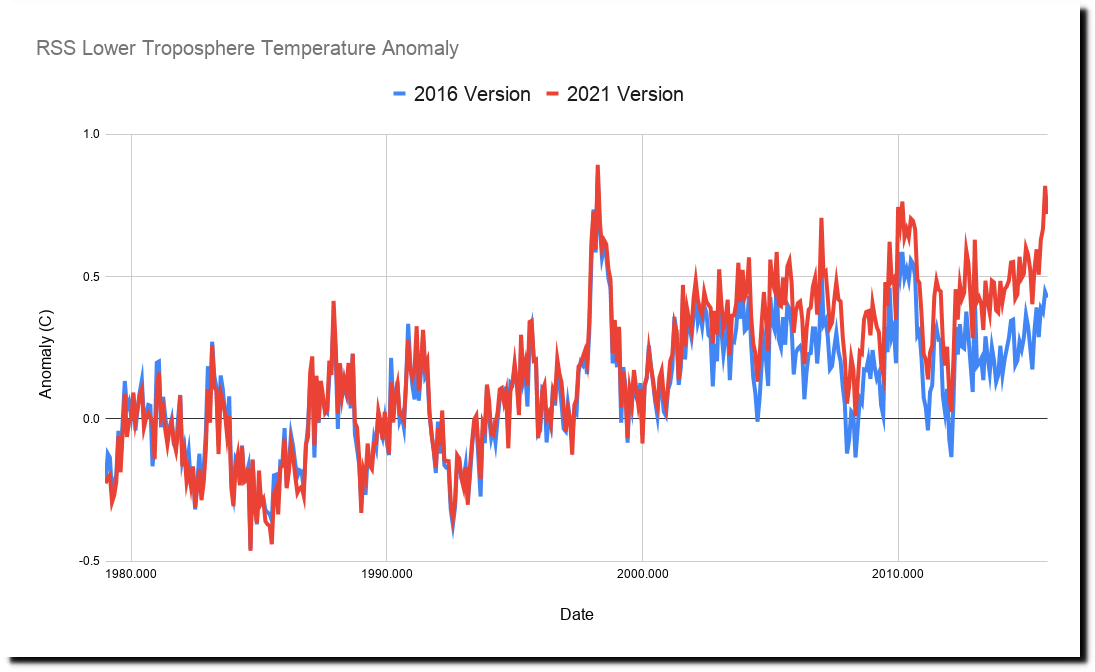
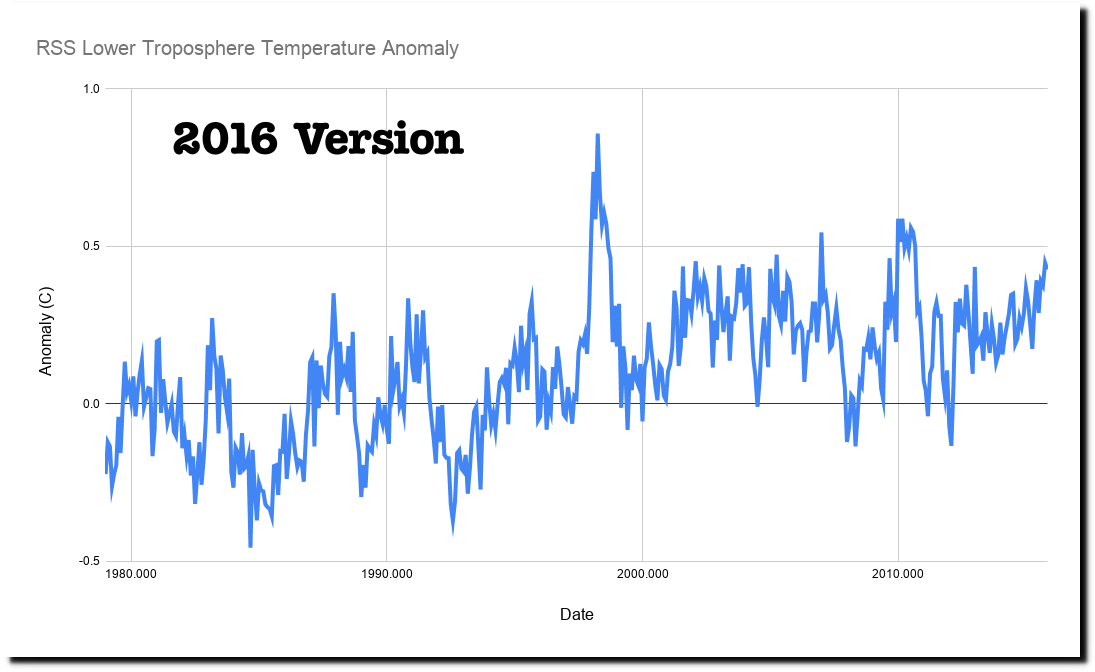
And Carl Mears at RSS complied by turning the cooling trend into a warming trend.
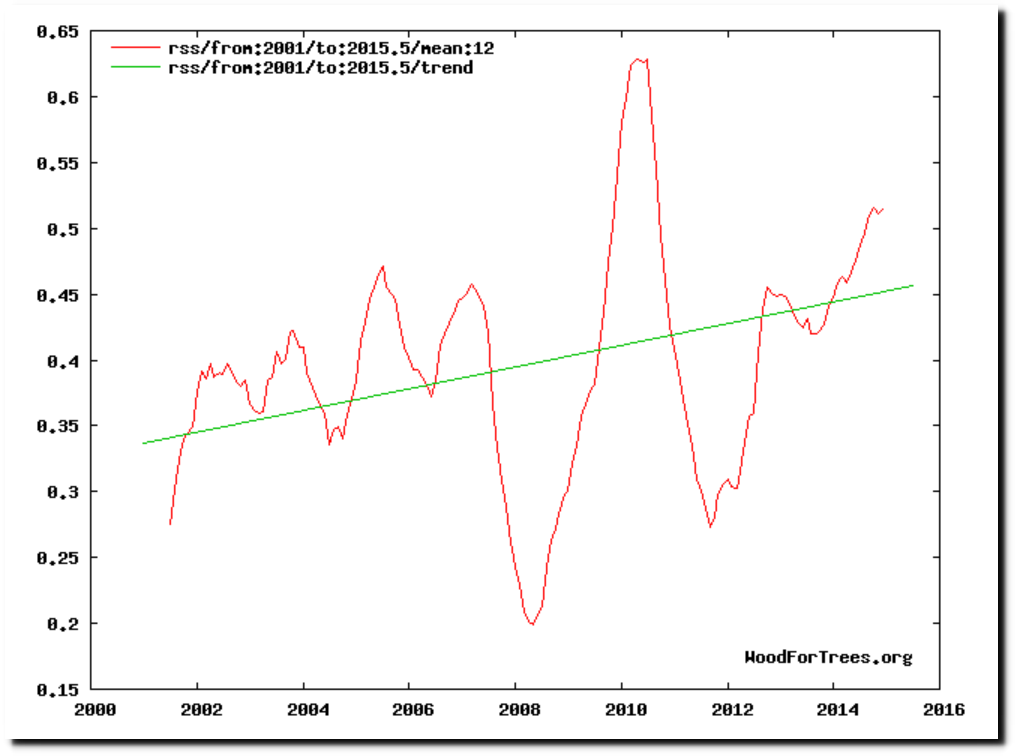
Wood for Trees: Interactive Graphs
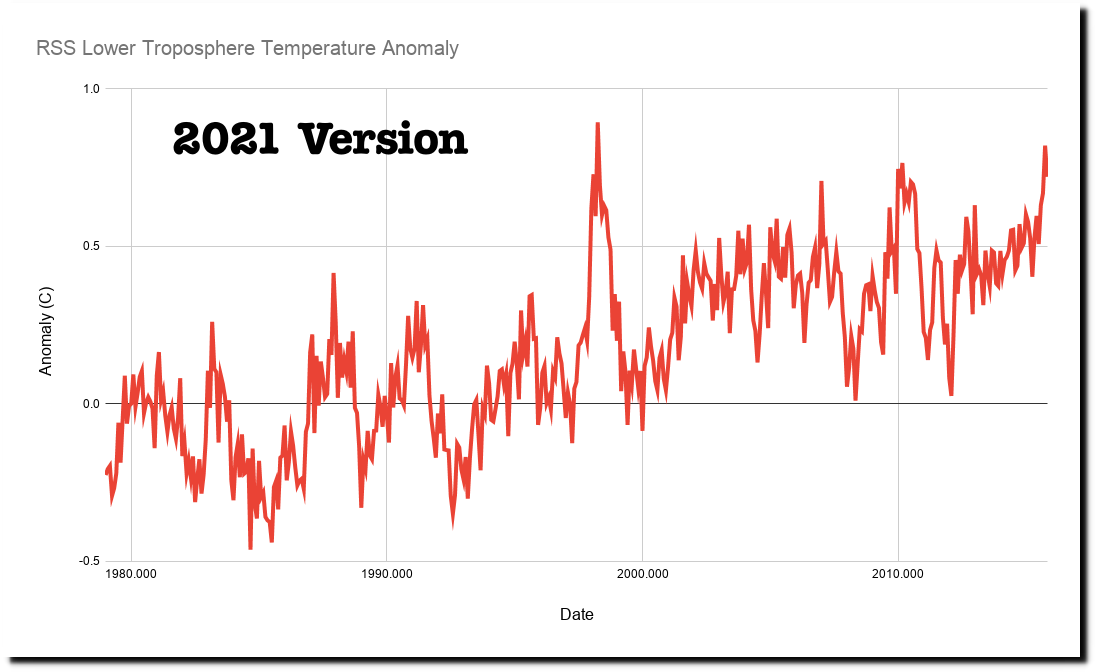
Rather than changing the data, Carl Mears changed the interpretation of the data. After 2016 he removed the blue error range and used the upper bounds of the error rather than midrange of the error.
Note that after 1998, the observations are likely to be below the simulated values, indicating that the simulation as a whole are predicting too much warming.
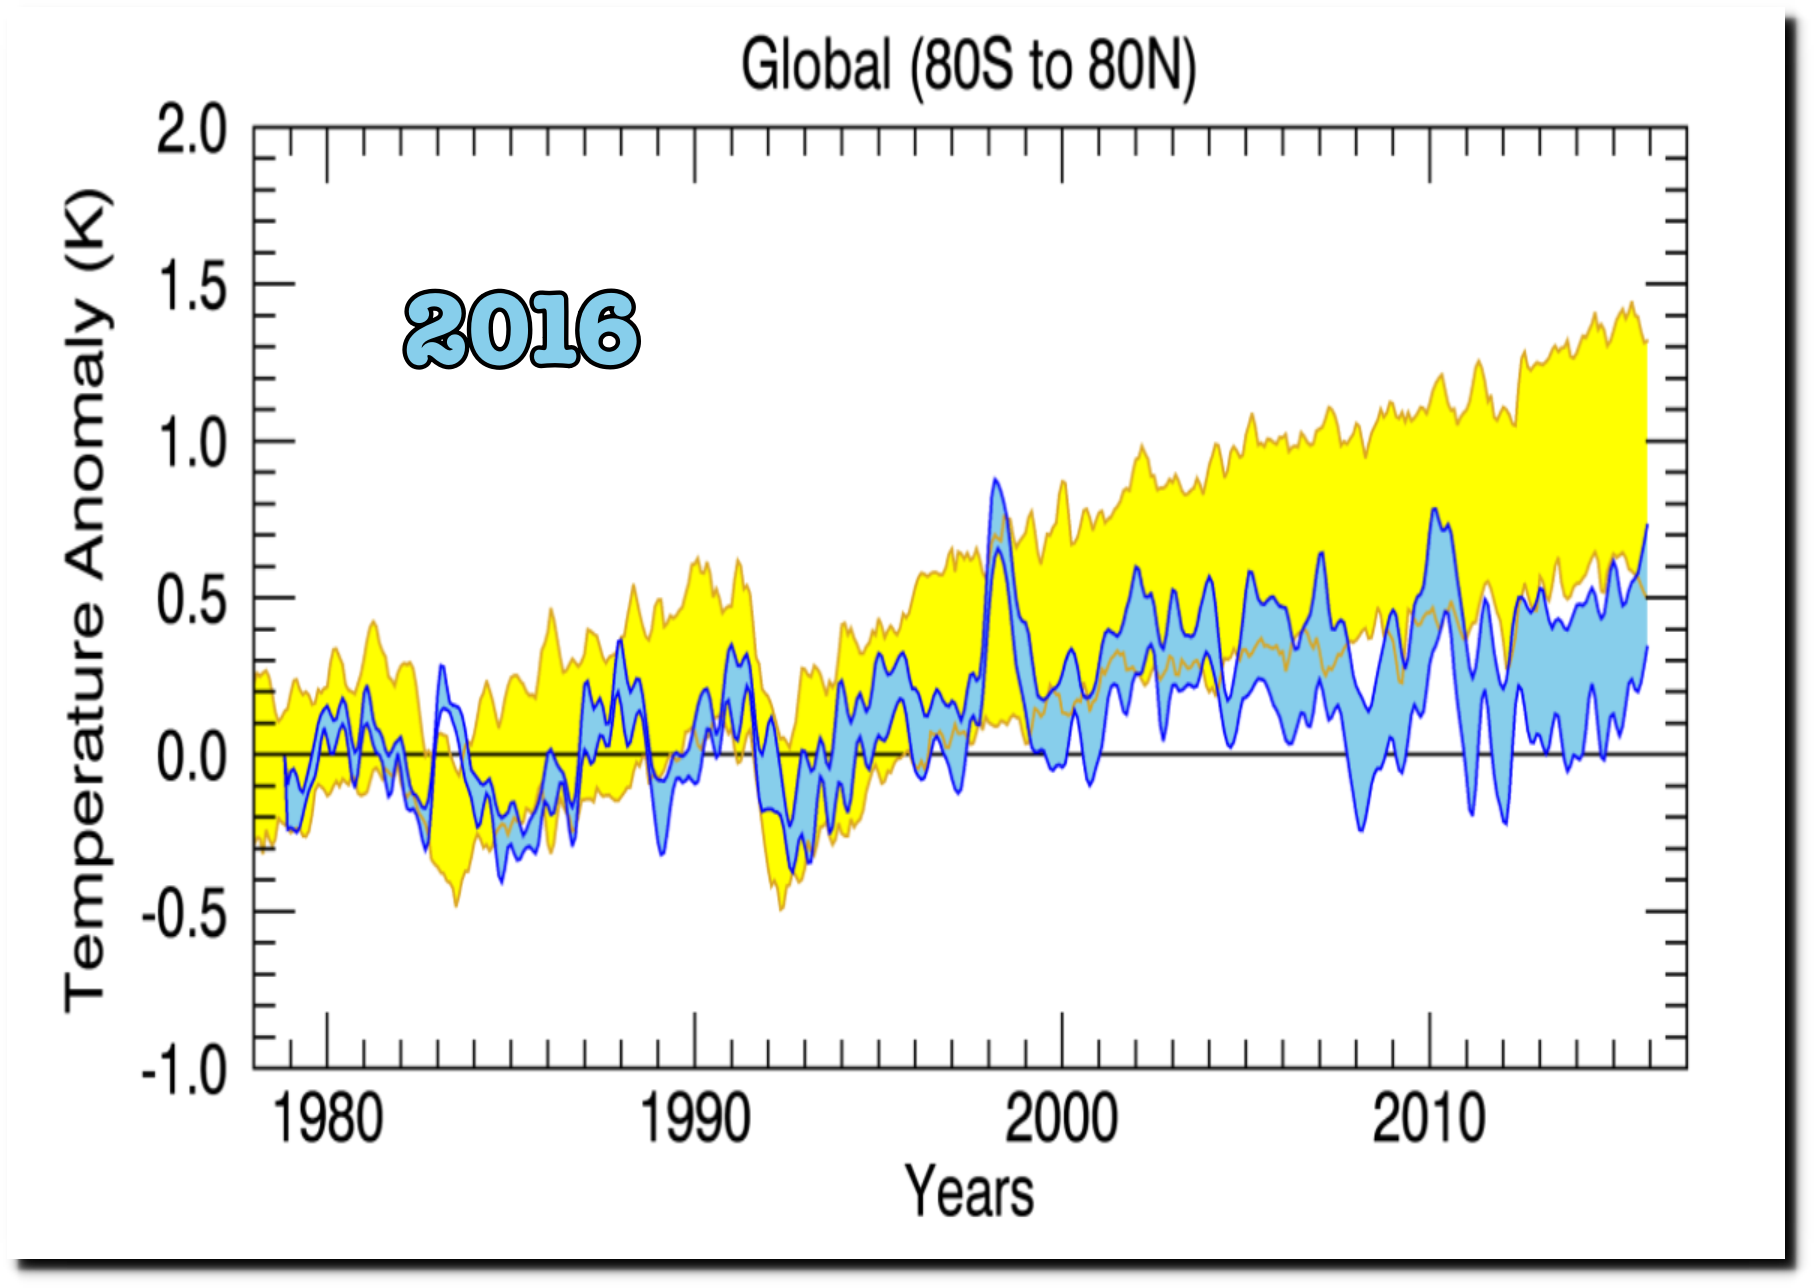
Climate Analysis | Remote Sensing Systems
He also changed the wording and misspelled satellite.
“Note that after 1998, the observations are likely to be in the lower part of the model distribution, indicating that there is a small discrepancy between the model predictions and the satelllite observations”
I predicted this would happen on March 27, 2015.
Look for the satellite data to be adjusted to bring it into compliance with the fully fraudulent surface temperatures. The Guardian is now working to discredit UAH, so it seems likely that RSS will soon be making big changes – to match the needs of the climate mafia. Bookmark this post.
I made this prediction because Ted Cruz used an RSS graph in a Senate hearing in March of 2015. Carl Mears at RSS then came under intense pressure to make his data match the surface temperature data.
My particular dataset (RSS tropospheric temperatures from MSU/AMSU satellites) show less warming than would be expected when compared to the surface temperatures. All datasets contain errors. In this case, I would trust the surface data a little more because the difference between the long term trends in the various surface datasets (NOAA, NASA GISS, HADCRUT, Berkeley etc) are closer to each other than the long term trends from the different satellite datasets. This suggests that the satellite datasets contain more “structural uncertainty” than the surface dataset.
Ted Cruz says satellite data show the globe isn’t warming
Roy Spencer at UAH made the same prediction on January 9, 2017
“I expect there will soon be a revised TLT product from RSS which shows enhanced warming, too.
Here’s what I’m predicting:
1) neither John Christy nor I will be asked to review the paper
2) it will quickly sail through peer review (our UAH V6 paper is still not in print nearly 1 year after submission)
3) it will have many authors, including climate model people and the usual model pundits (e.g. Santer), which will supposedly lend legitimacy to the new data adjustments.
Let’s see how many of my 3 predictions come true.
-Roy”

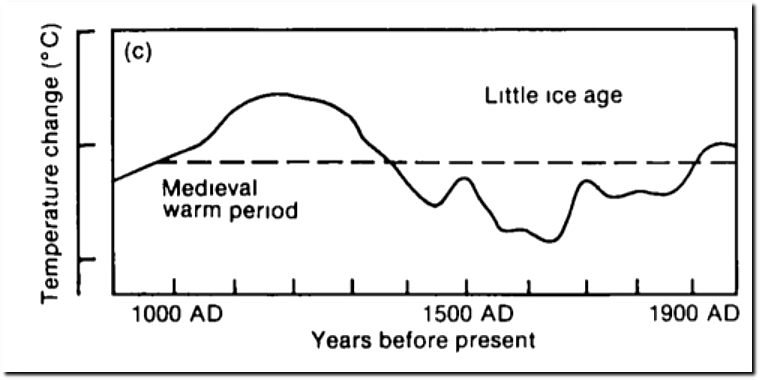
In 1992, the New York Times said there was no indication of global warming and that the MWP and LIA were global.
Warming? Tree Rings Say Not Yet
Lisa J. Graumlich, who examines the ring patterns of foxtail pine trees and western junipers in the Sierra Nevada, has compiled a detailed record of the year-to-year variation in temperature and precipitation over the last thousand years.
She has seen in the North American trees the feathery but unmistakable signatures of the Medieval Warm Period, a era from 1100 to 1375 A.D. when, according to European writers of the time and other sources, the climate was so balmy that wine grapes flourished in Britain and the Vikings farmed the now-frozen expanse of Greenland; and the Little Ice Age, a stretch of abnormally frigid weather lasting roughly from 1450 to 1850. A Crucial Question
“We can now see that these were global climate phenomena, not regional temperature variations,” she said. “The question is, how did we get those warmer temperatures during pre-industrial times, and what can we learn from those conditions about what is going on today?”
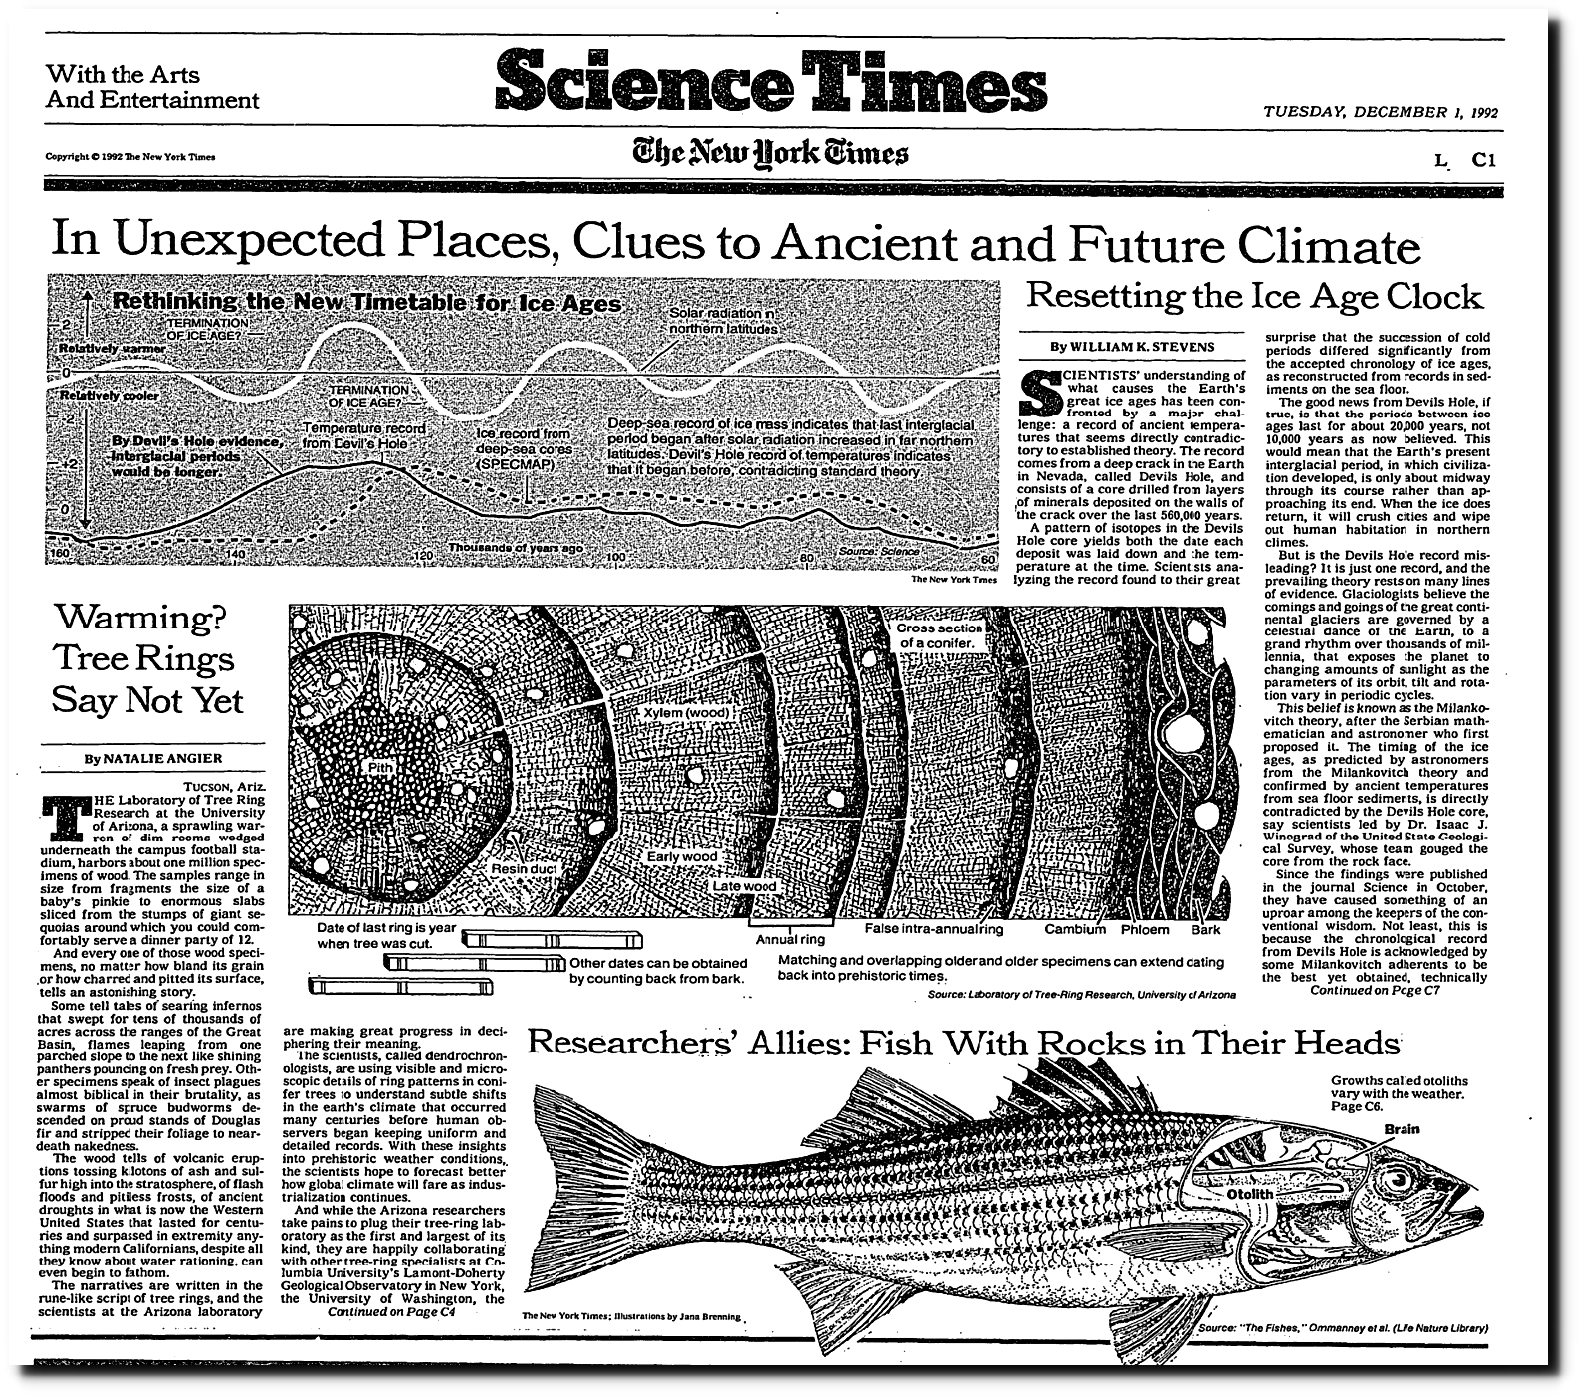

This was consistent with the 1990 IPCC Report.
Another breathless headline : “Climate Change Has Cut Global Agricultural Productivity by 21% Since 1961”
Climate Change Has Cut Global Agricultural Productivity by 21% Since 1961
The exact opposite is true. Crop yields across the world, South America and Africa increased dramatically since 1961.
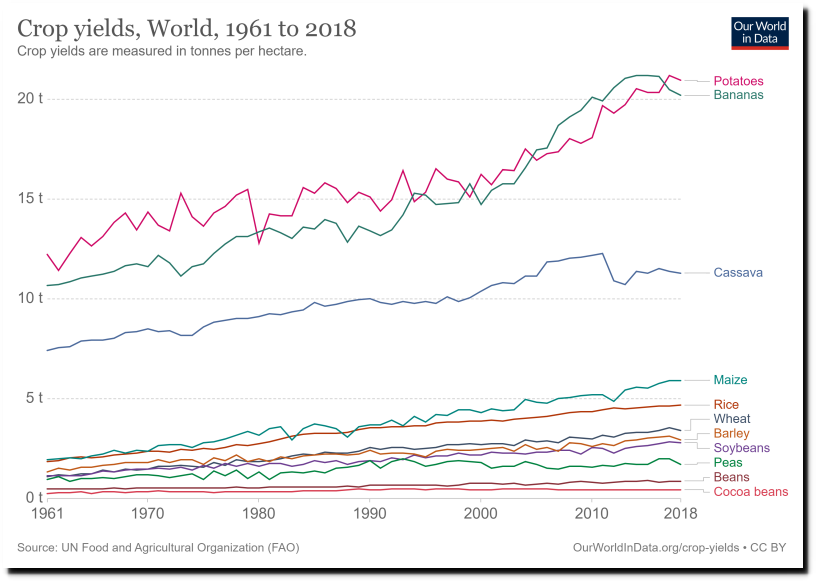
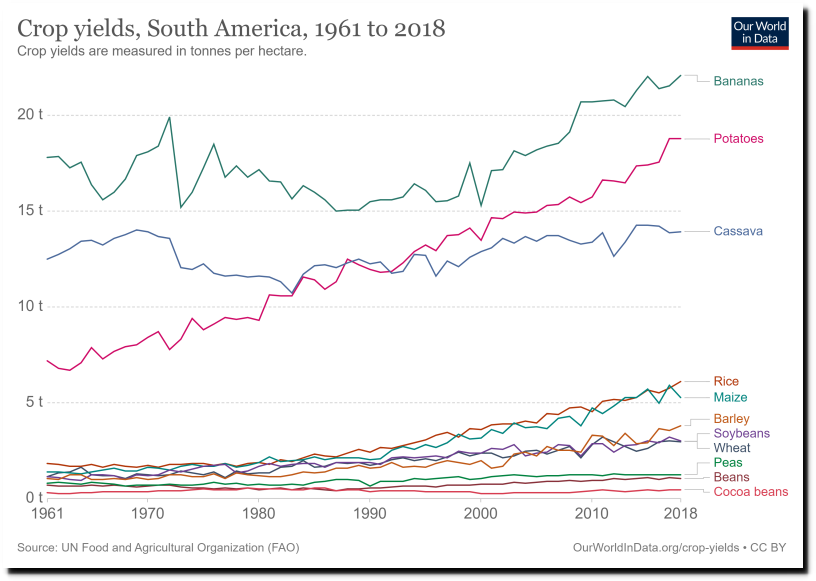
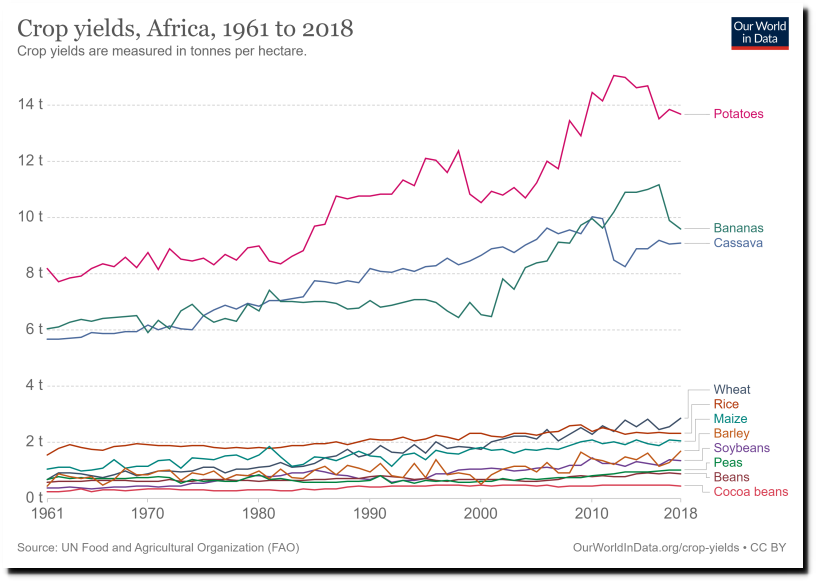
Crop Yields – Our World in Data
Hunger has declined sharply.
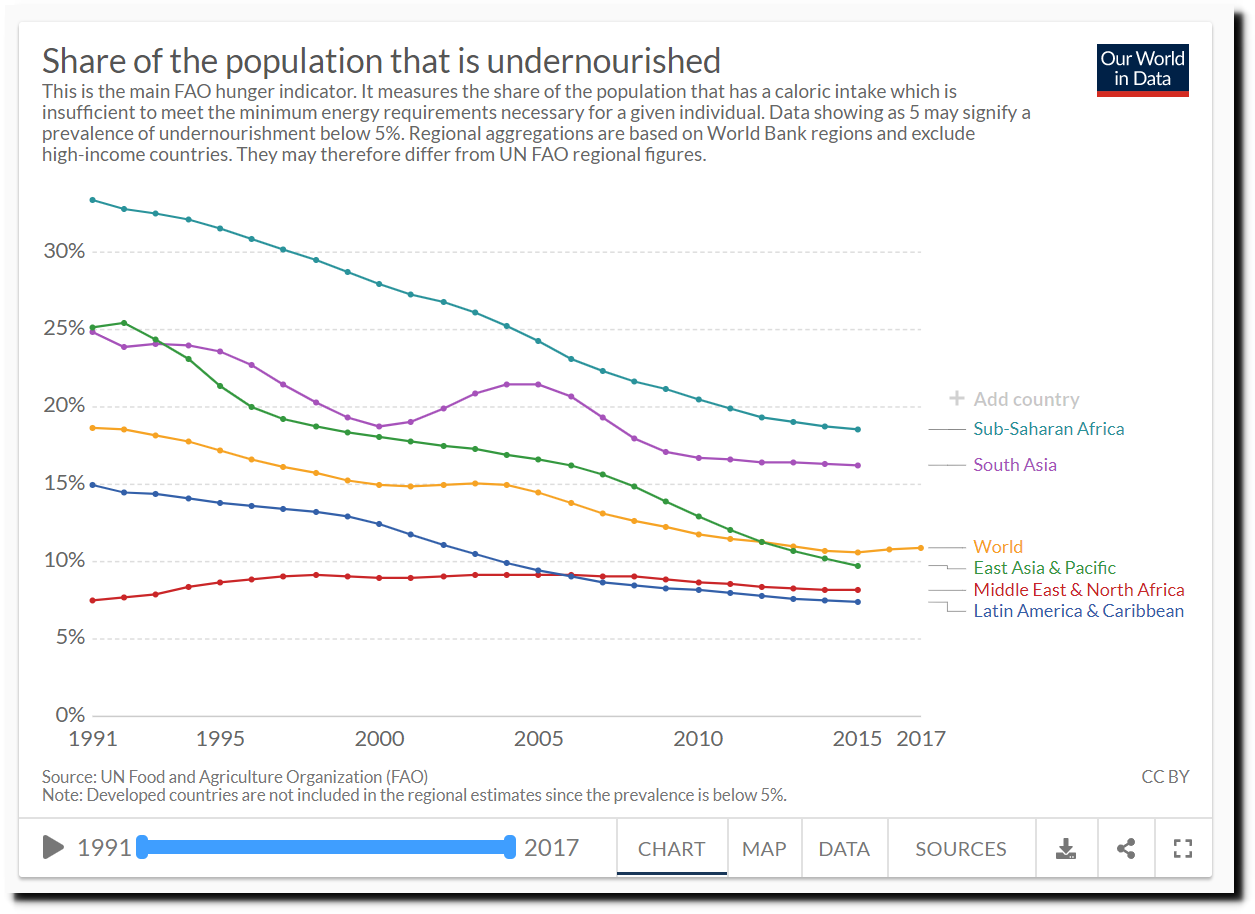
Hunger and Undernourishment – Our World in Data
Poverty has declined sharply.
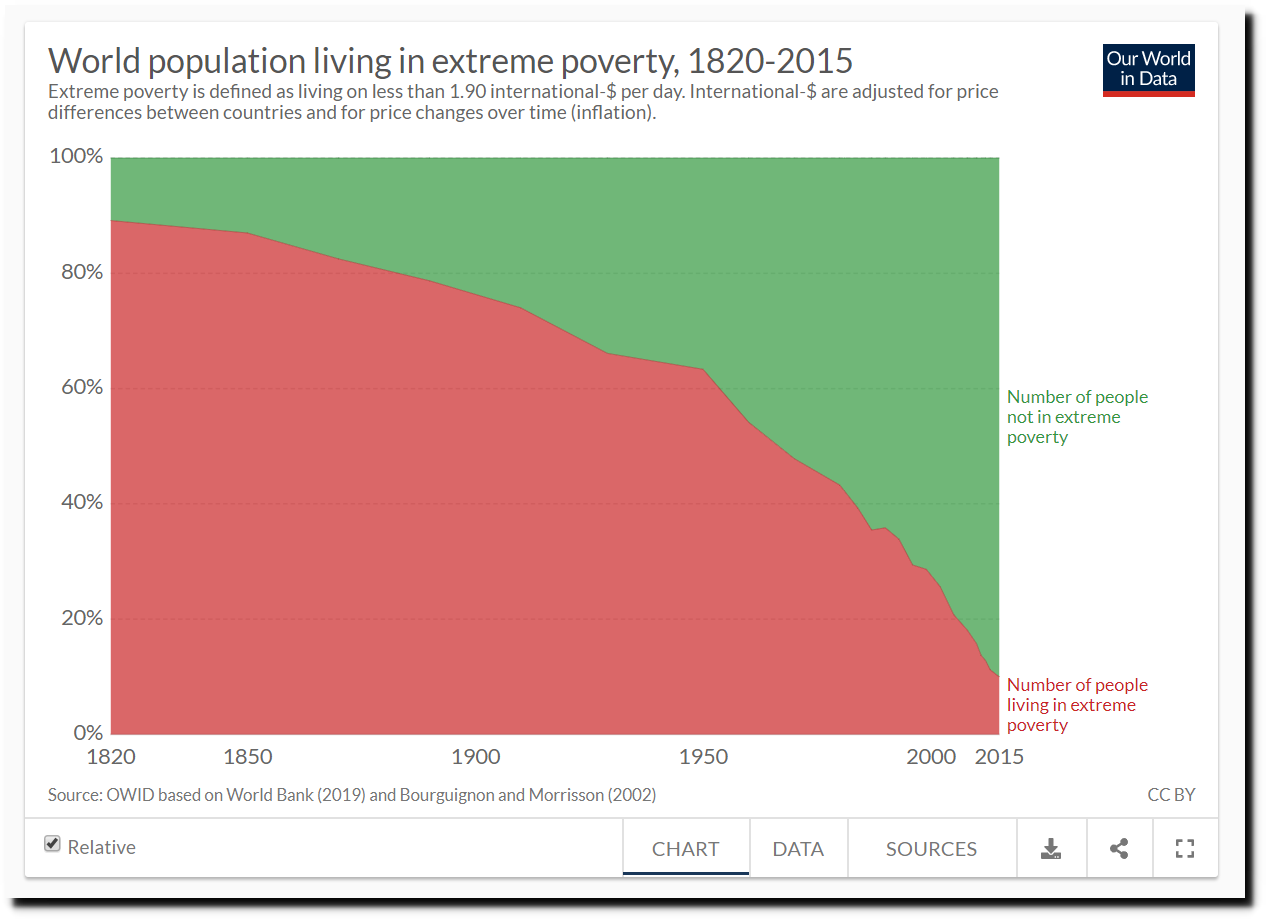
The short history of global living conditions and why it matters that we know it – Our World in Data
Illiteracy has declined sharply.

Global Rise of Education – Our World in Data
Life expectancy has increased sharply.
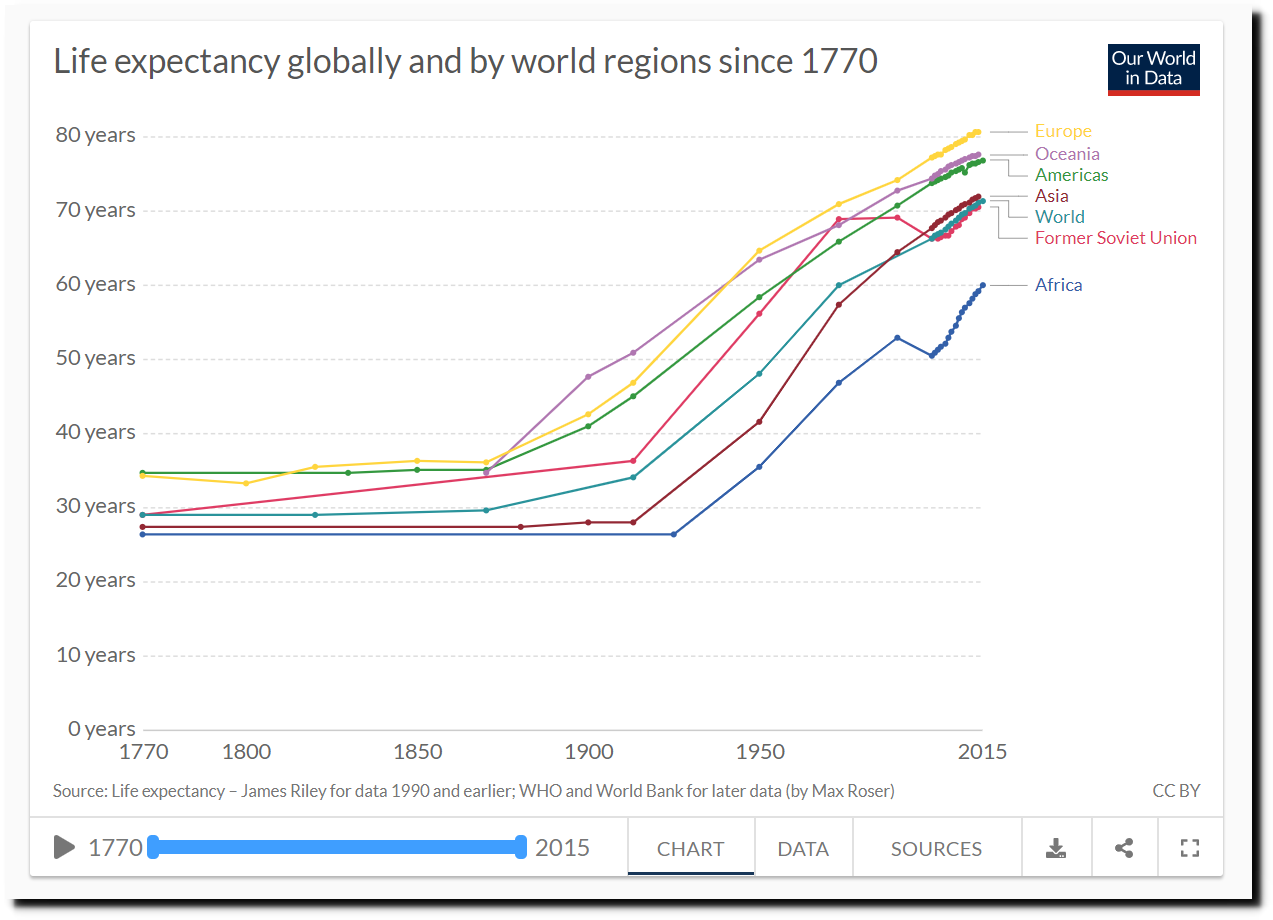
Life Expectancy – Our World in Data
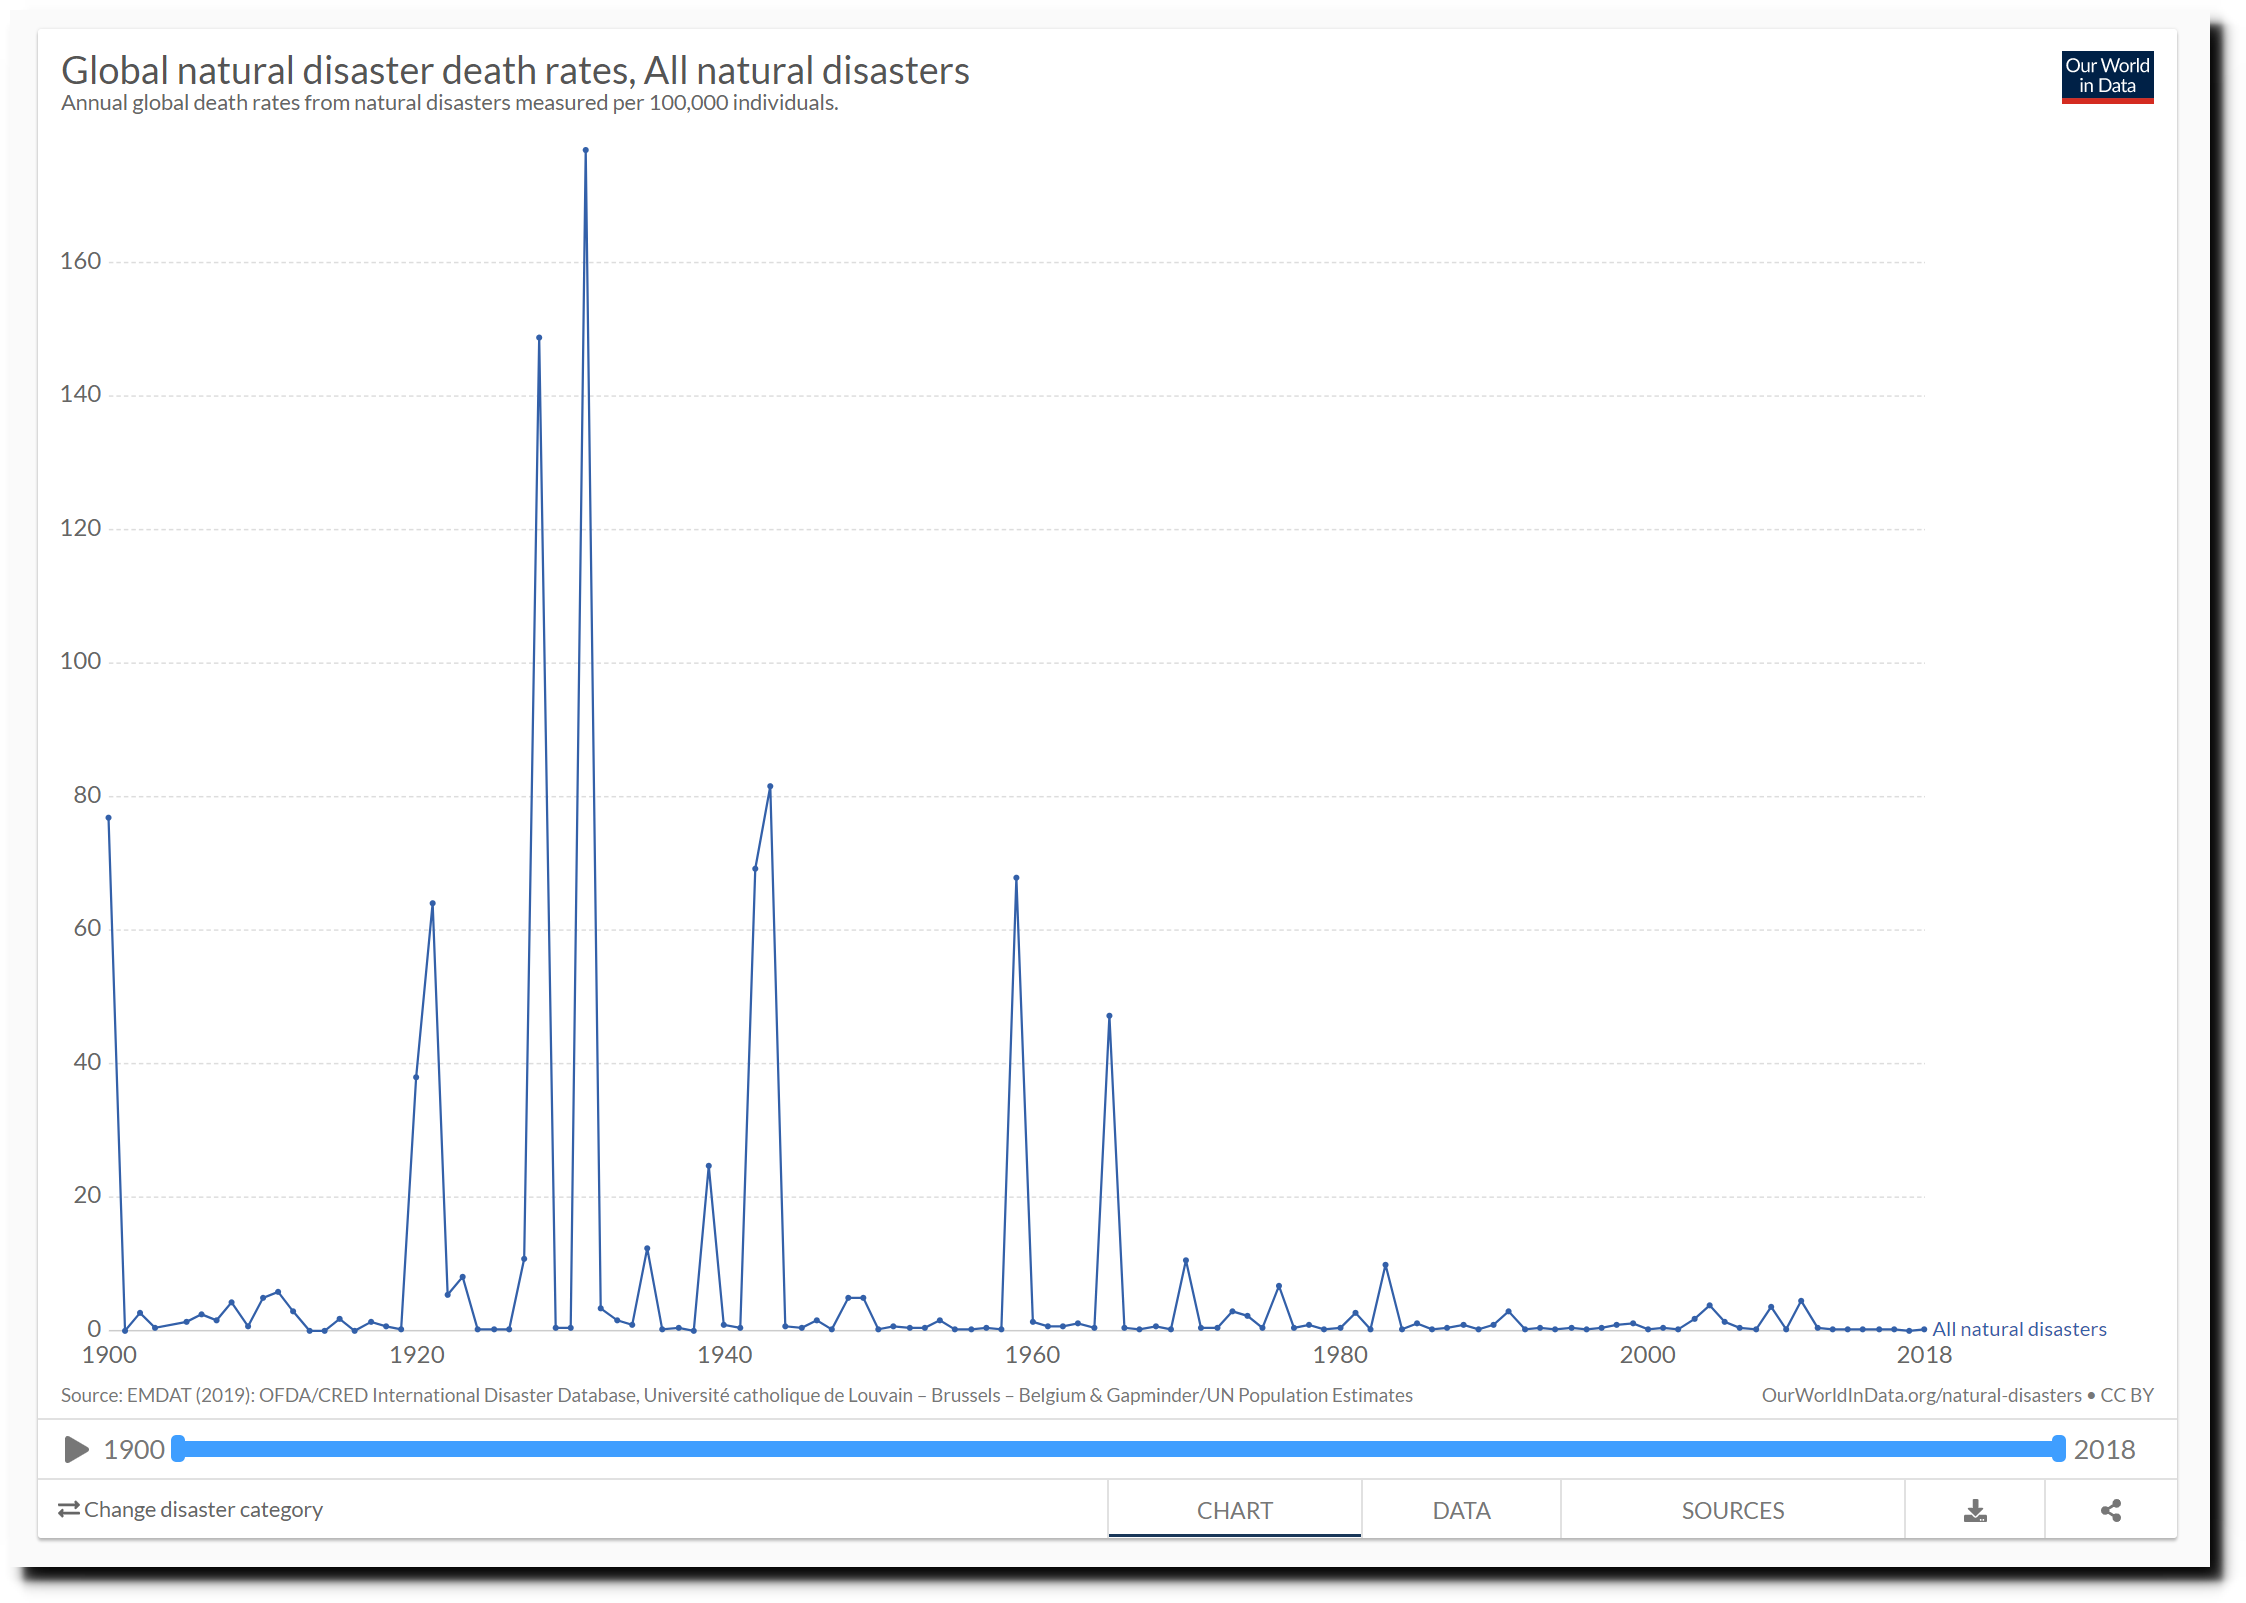
And as CO2 has risen, deaths from natural disasters have plummeted.

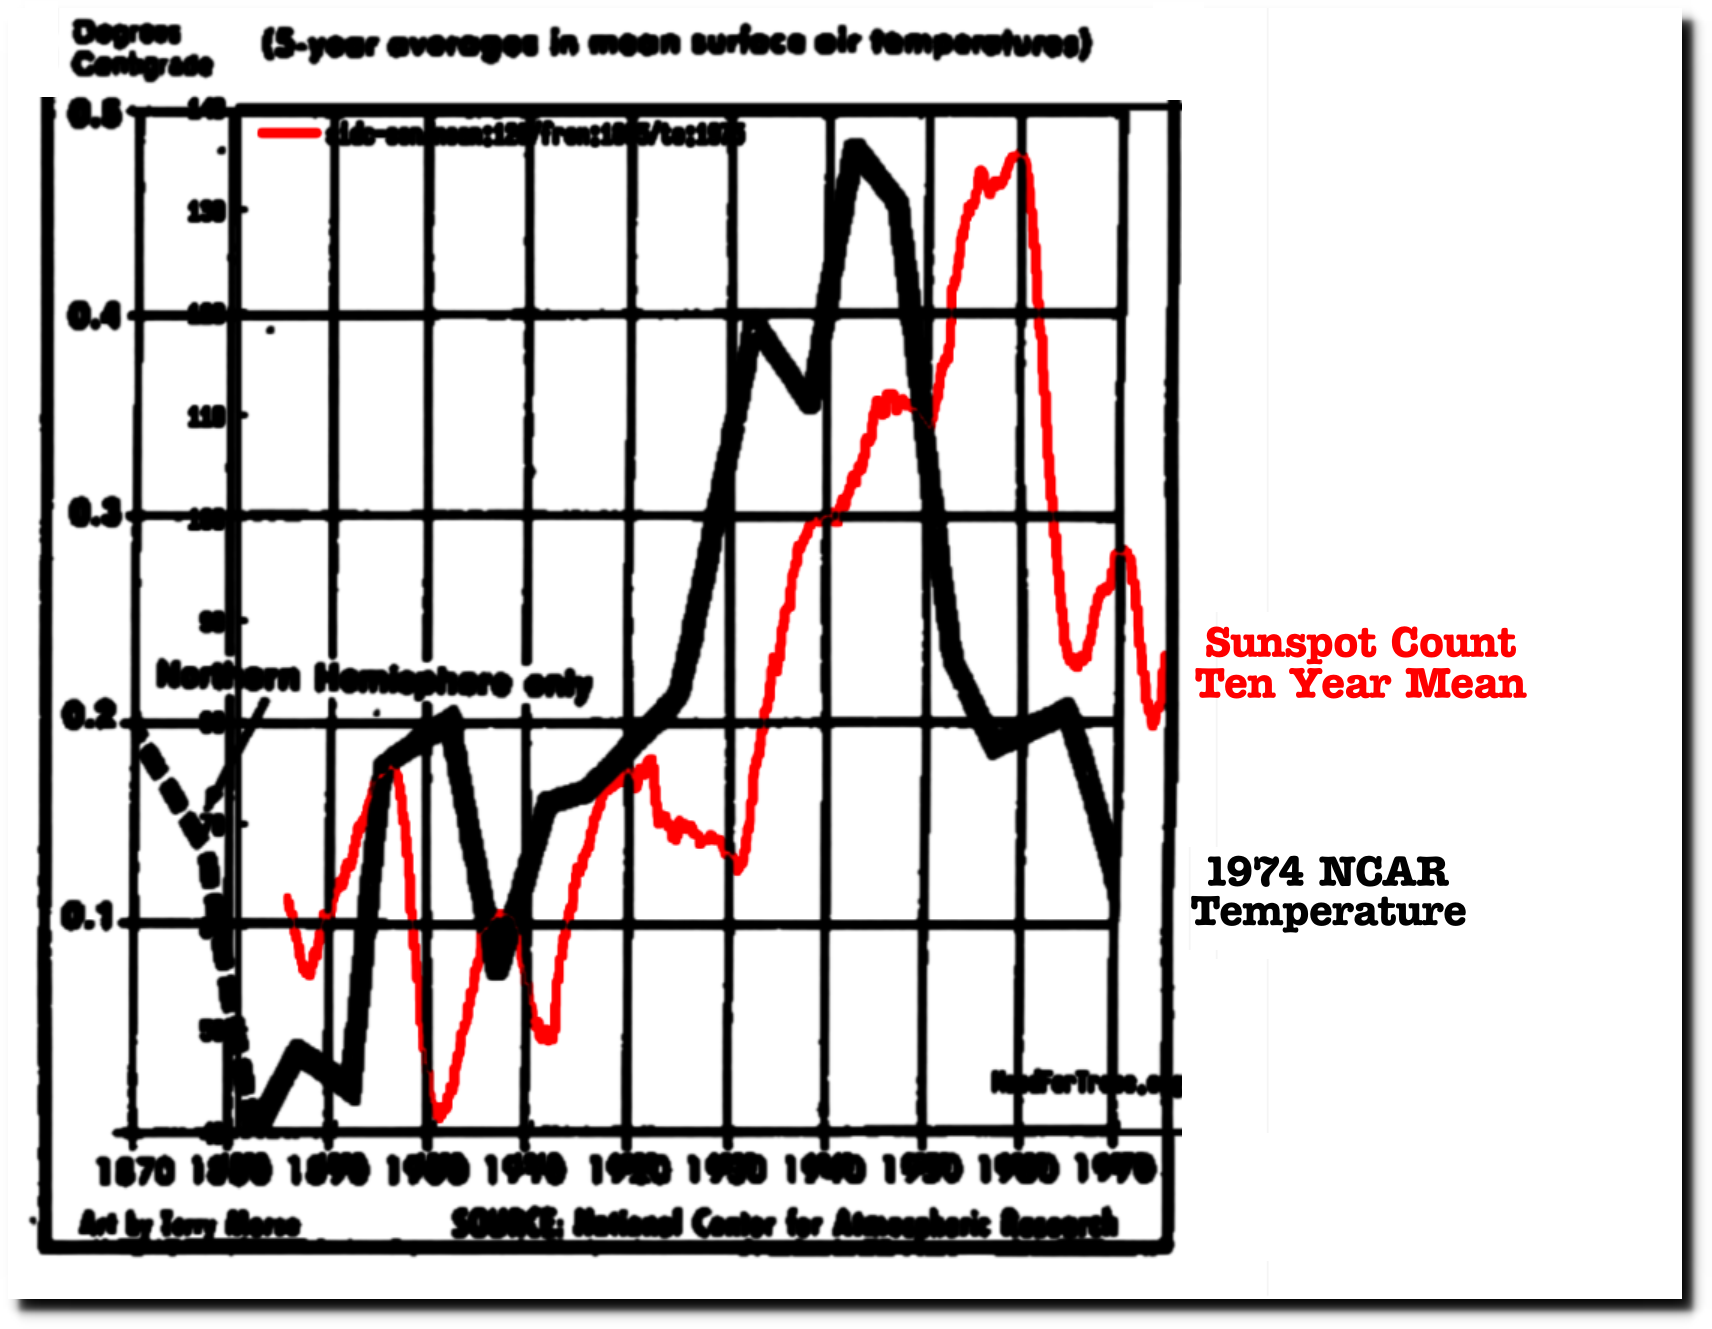
Ninety years ago, the New York Times reported unanimous consensus that Earth’s climate was controlled by the sun.
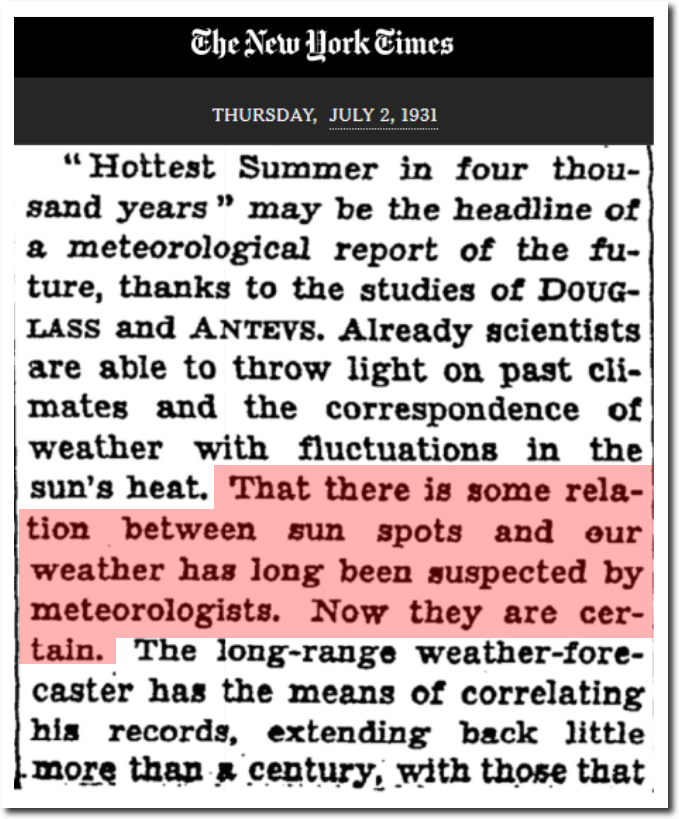
TimesMachine: July 2, 1931 – NYTimes.com
Now NASA reports 97% consensus that Earth’s climate is controlled by CO2.
“Multiple studies published in peer-reviewed scientific journals show that 97 percent or more of actively publishing climate scientists agree*: Climate-warming trends over the past century are extremely likely due to human activities.”

Scientific Consensus | Facts – Climate Change: Vital Signs of the Planet
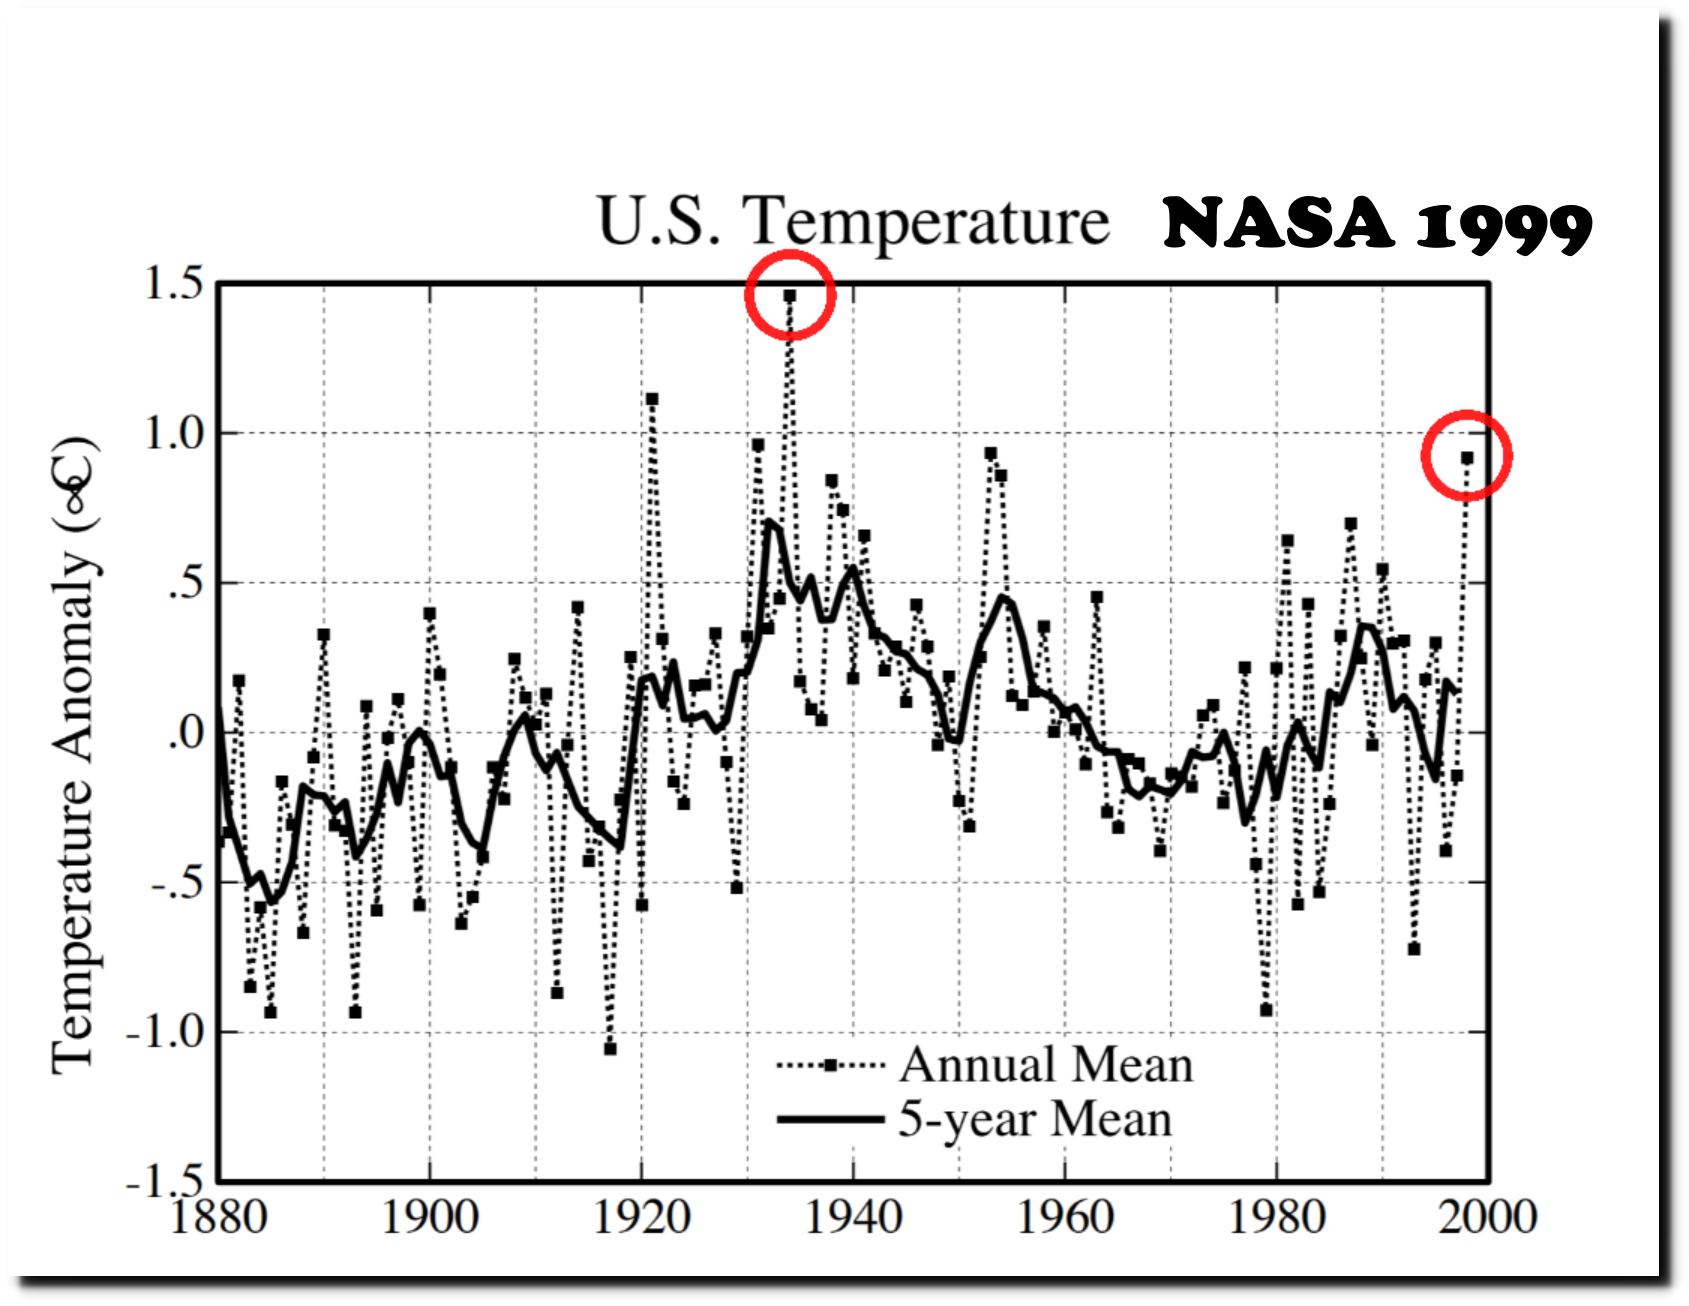
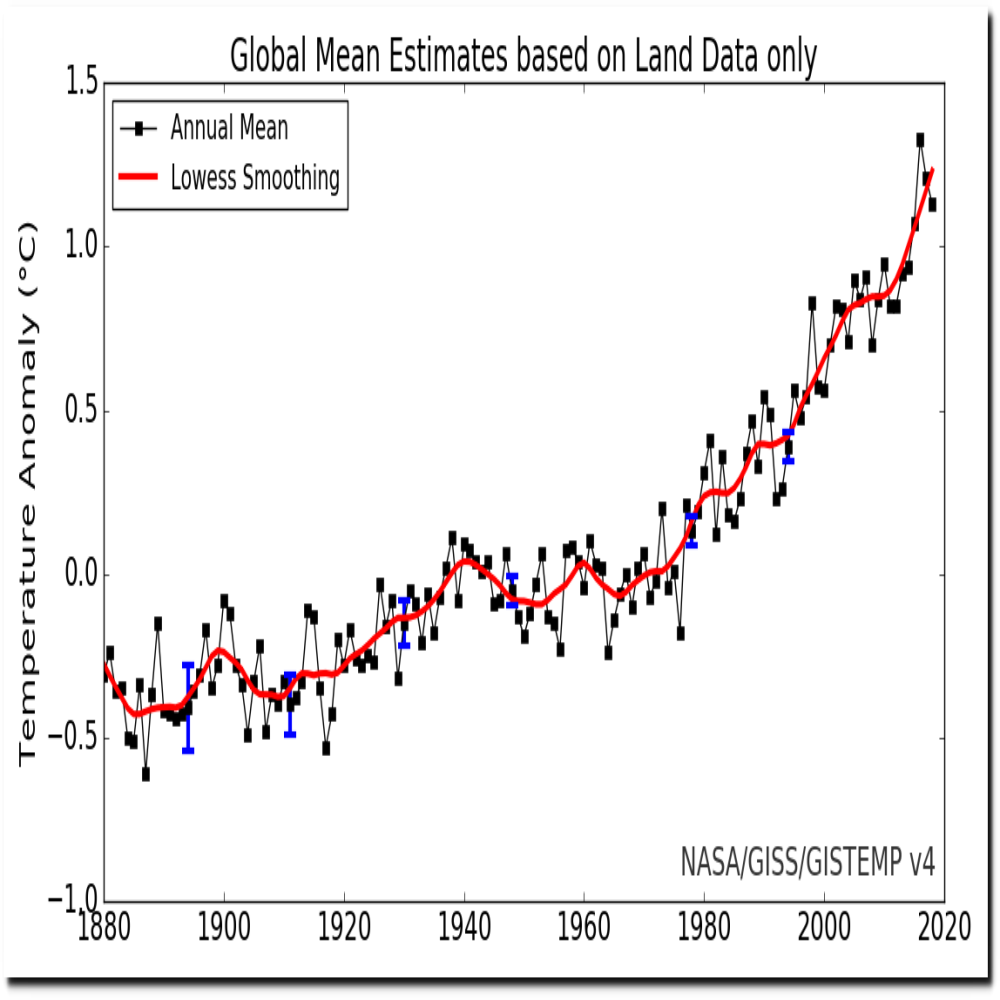
I agree with them – the warming trends over the last century are primarily due to human activities – data tampering by organizations like NASA and NOAA. For example, over the past 20 years NASA has turned a 70 year cooling trend in the US from 1930 to 2000 into a warming trend. This is the 1999 version.
And this is NASA’s current graph.
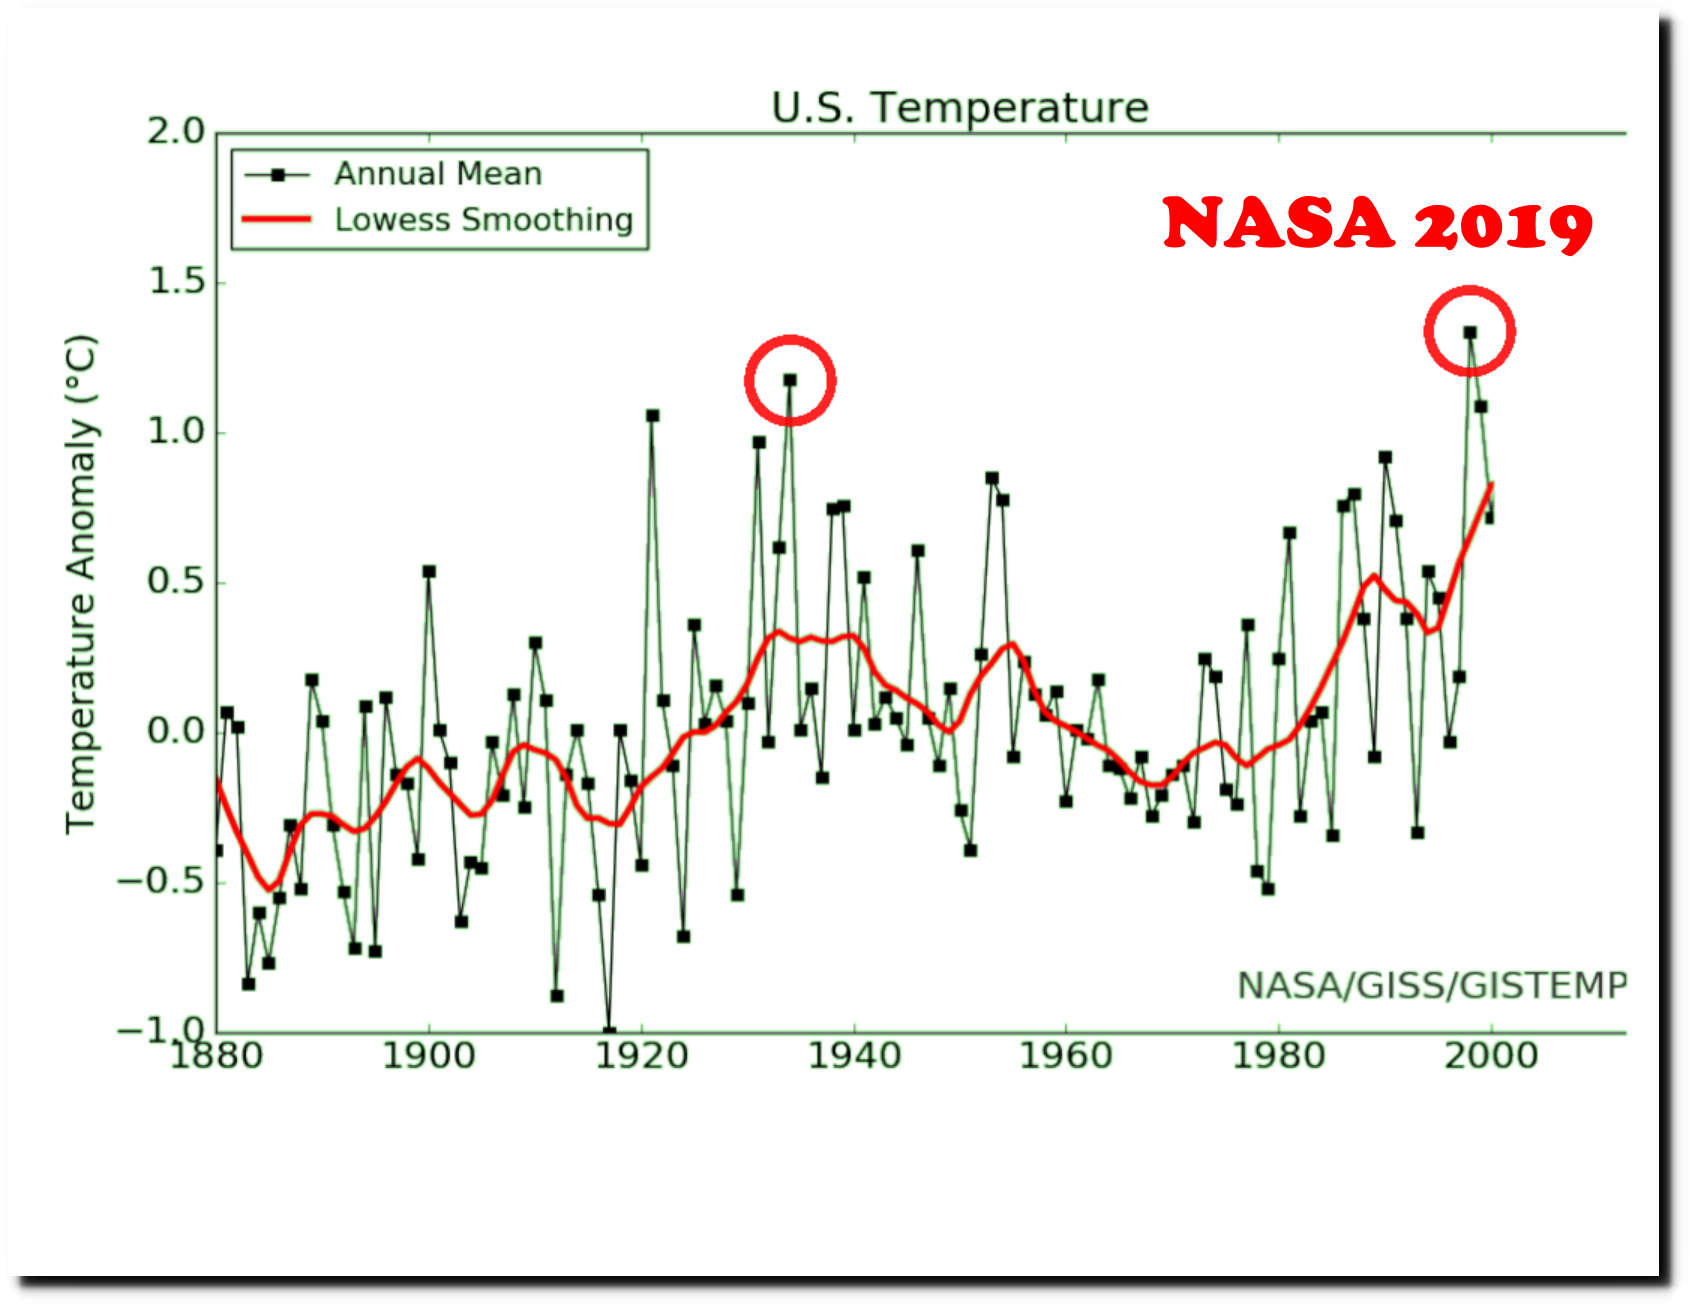
Here is an animation showing how the data has been altered over the past 20 years.
The US temperature record is very important, because the vast majority of global stations in the NOAA GHCN database with a long term daily temperature record are located in the US.
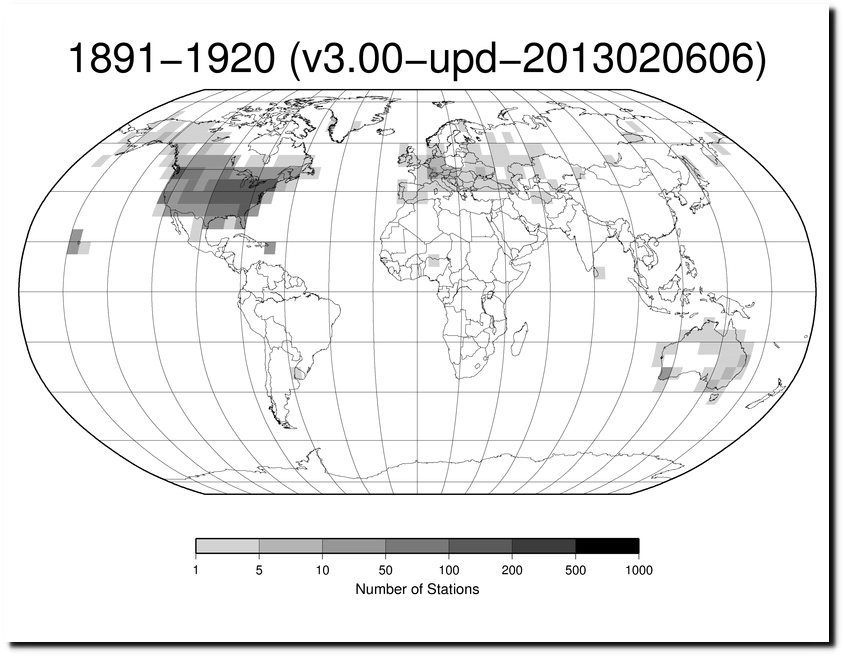
station-counts-1891-1920-temp.png
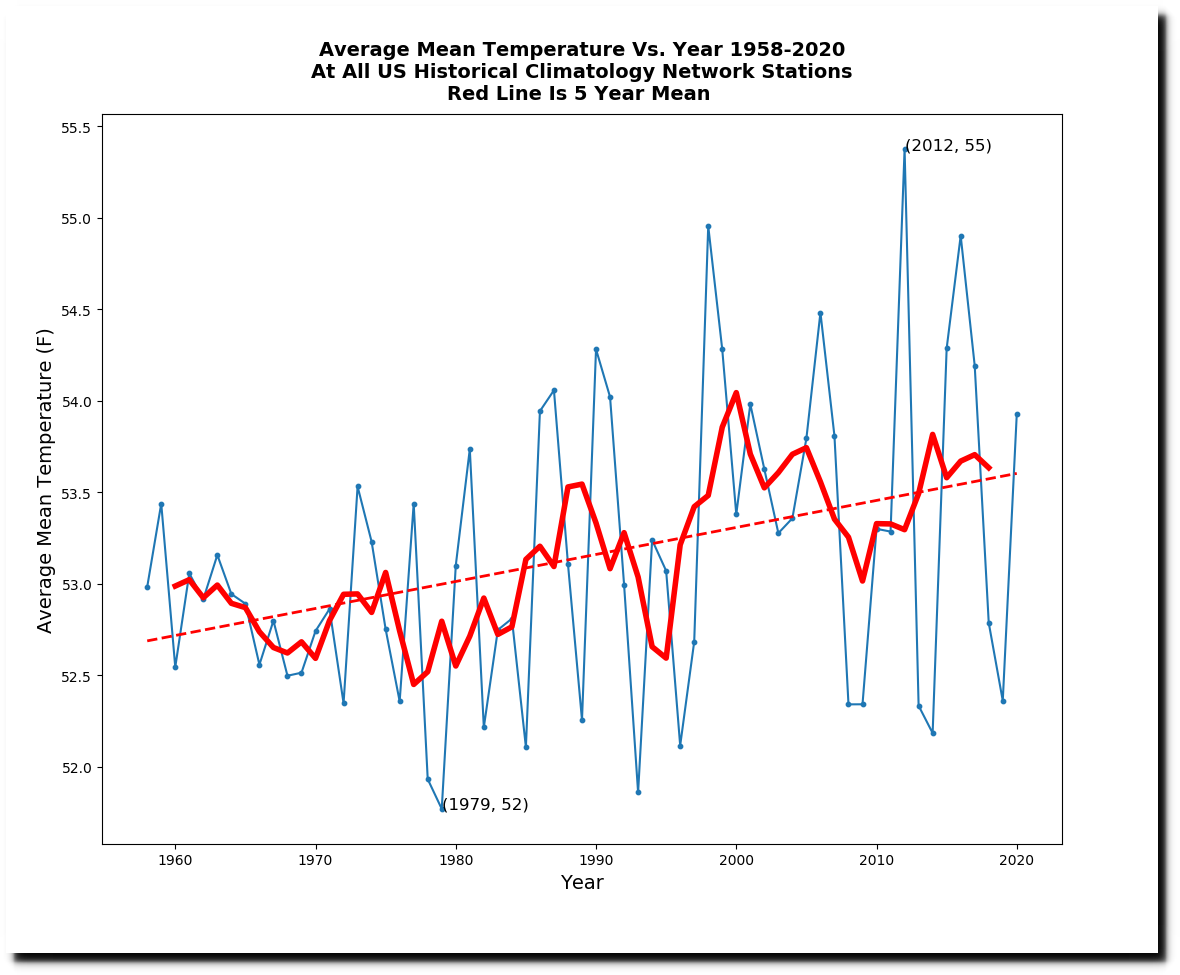
In 1986, NASA’s James Hansen predicted 4-6 degrees warming for the US by the year 2020, and a huge increase in heatwaves.
“He said that with an expected doubling of atmospheric carbon dioxide by 2040, the number of days each year with temperatures over 80 degrees would rise from 35 to 85 in Washington, D.C., and Omaha, Neb.”

12 Jun 1986, Page 12 – The Evening Times at Newspapers.com
The actual temperature increase from 1958 to 2020 was about one degree.
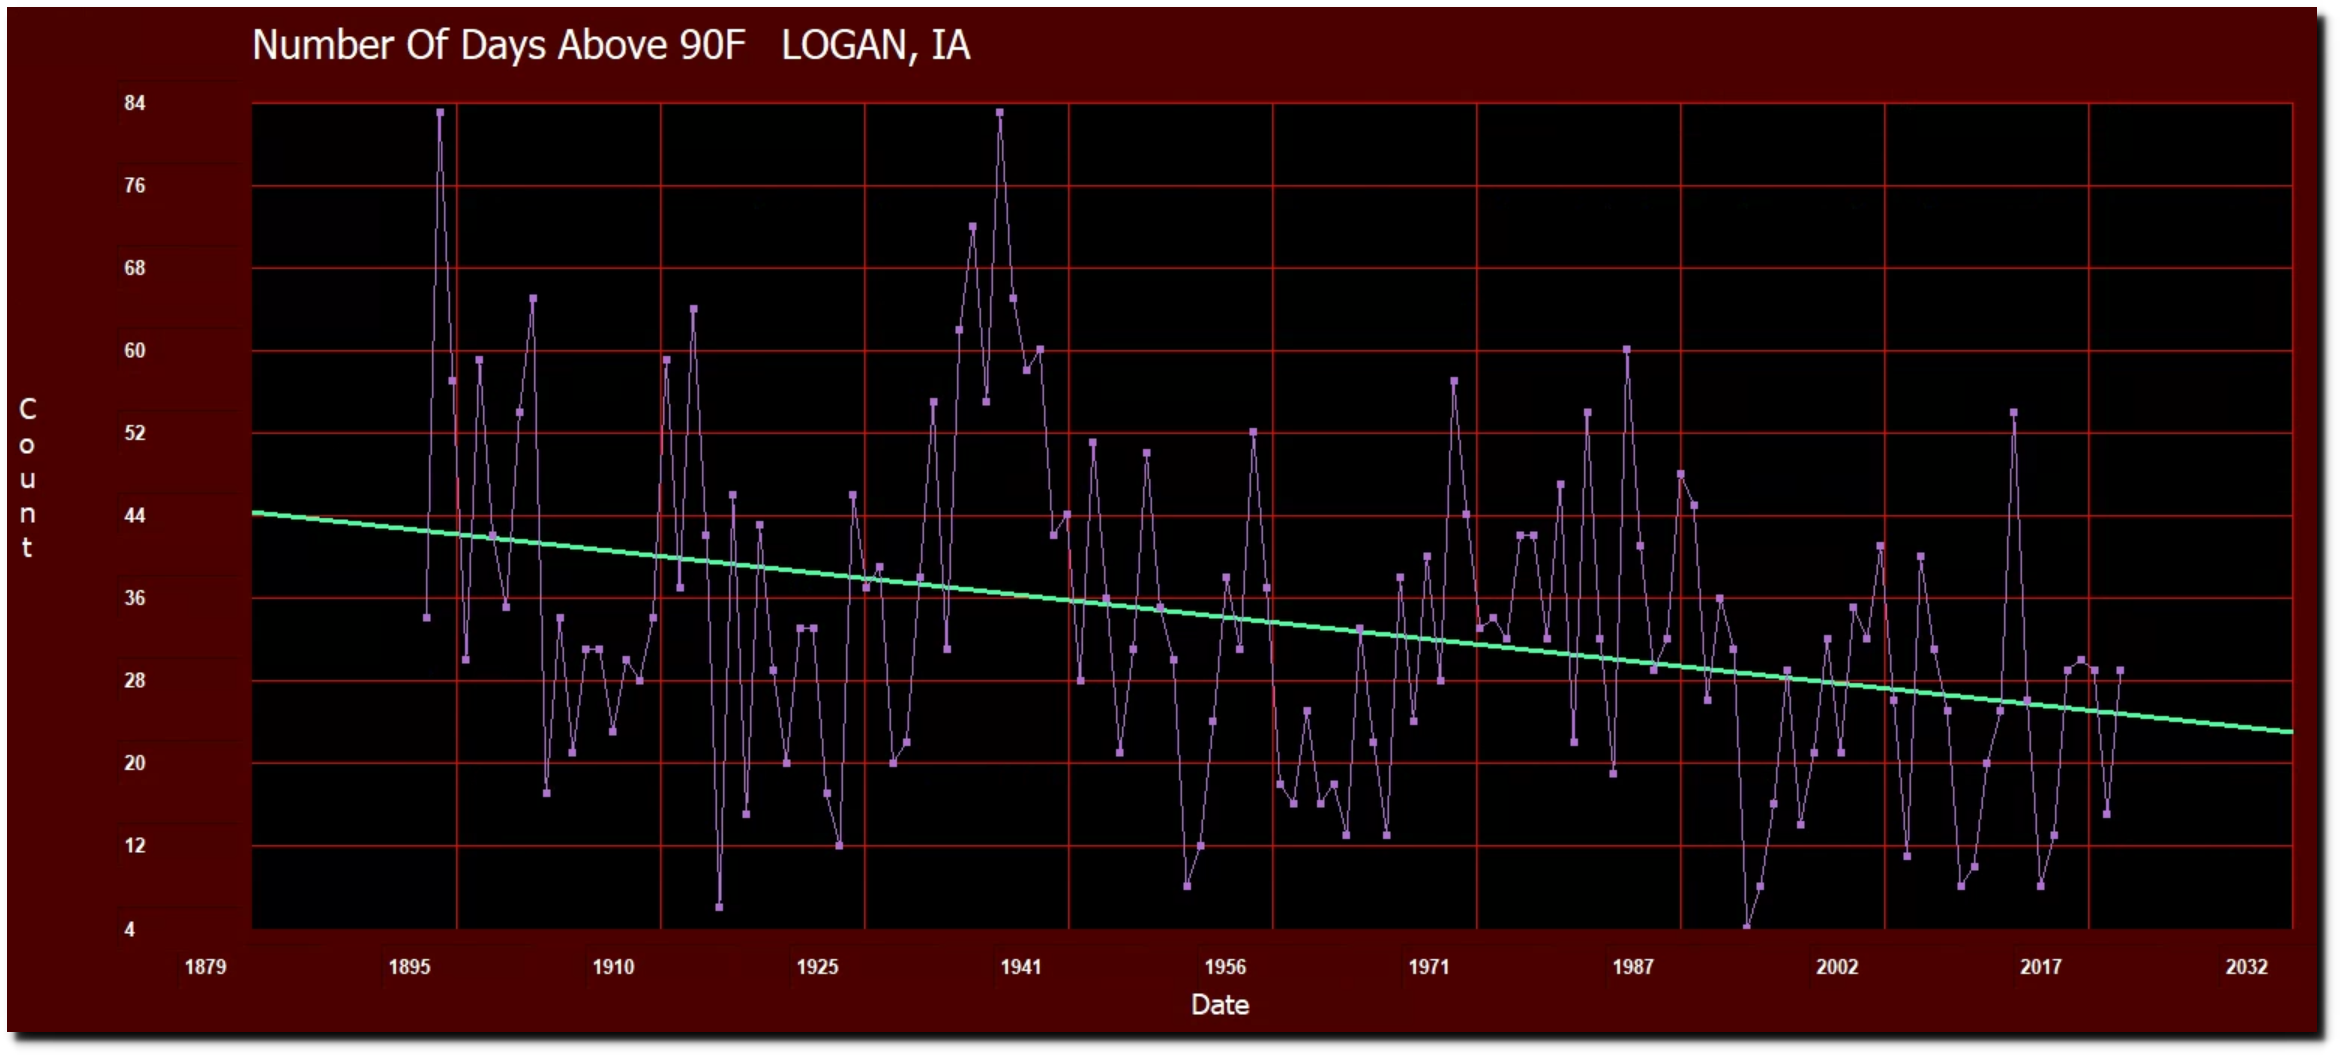
The closest currently operational USHCN station to Omaha is at Logan, Iowa. The number of 90 degree days there peaked in 1894 and 1936 (83) and have been declining sharply ever since.
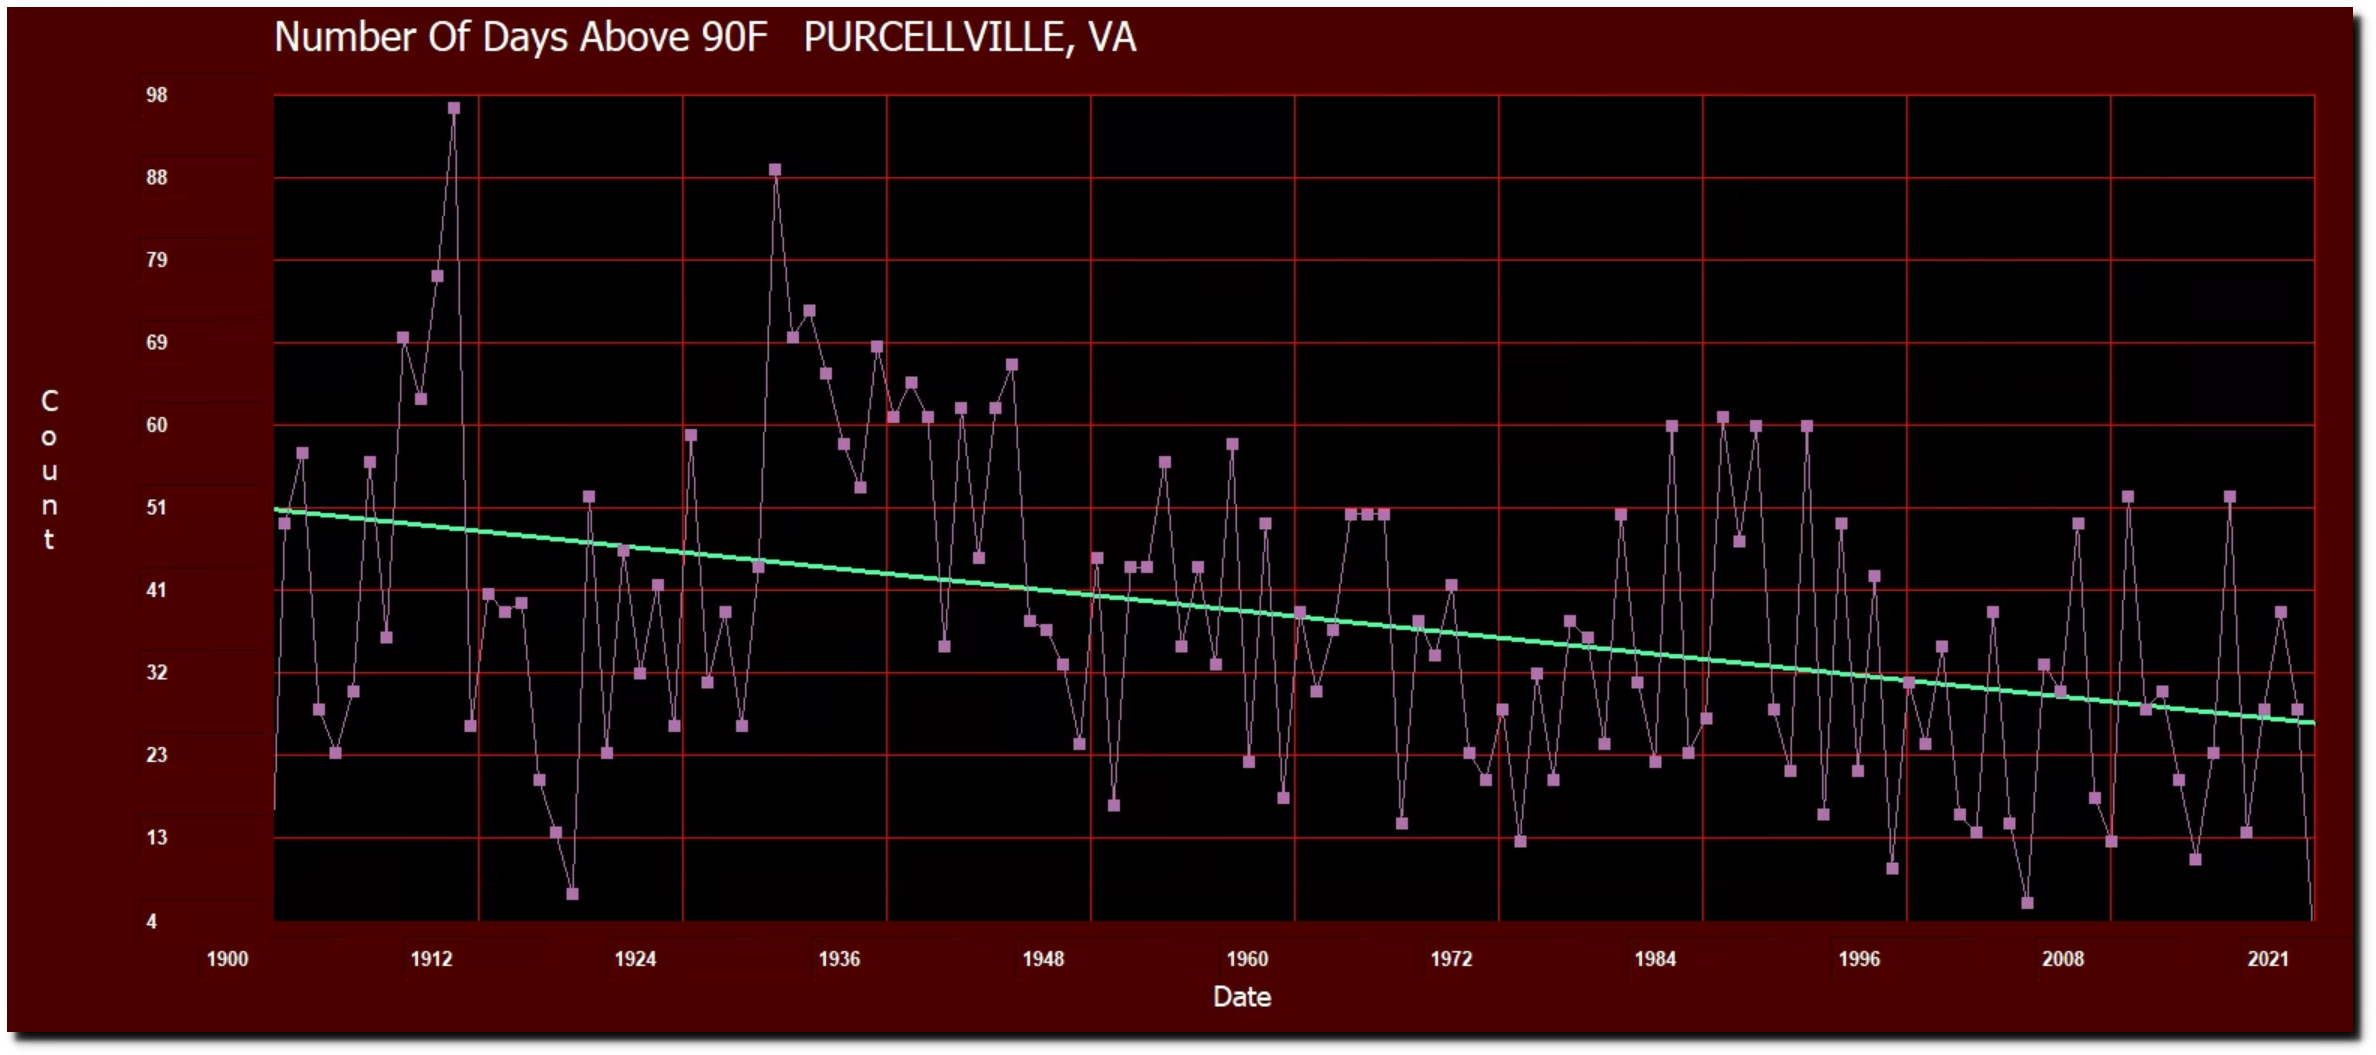
The closest currently operational USHCN station in Virginia to Washington DC is at Purcellville. The number of 90 degree days there peaked in 1911 (96) and 1930 (89) and have been declining sharply ever since.
For the entire US, the frequency of 90 degree days has dropped sharply over the past century. Hansen got that exactly backwards.

In 1988, Hansen predicted a large increase in droughts.
“Dr. James E. Hansen, director of the Goddard Institute for Space Studies, who presented recent data compiled from computer models, said that predicted regional effects of global warming show that the chances of summer drought in the low and middle latitudes would be 1 in 3 by the year 2030, as against 1 in 20 in the 1950’s.”
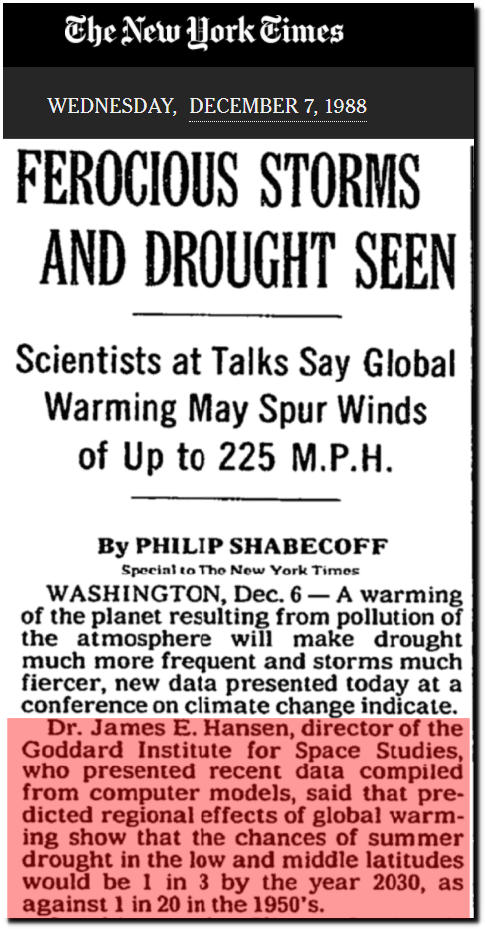 FEROCIOUS STORMS AND DROUGHT SEEN – The New York Times
During the 1950’s the US was in drought most of the time, but droughts have been much less common over the past 60 years. Hansen also got that exactly backwards.
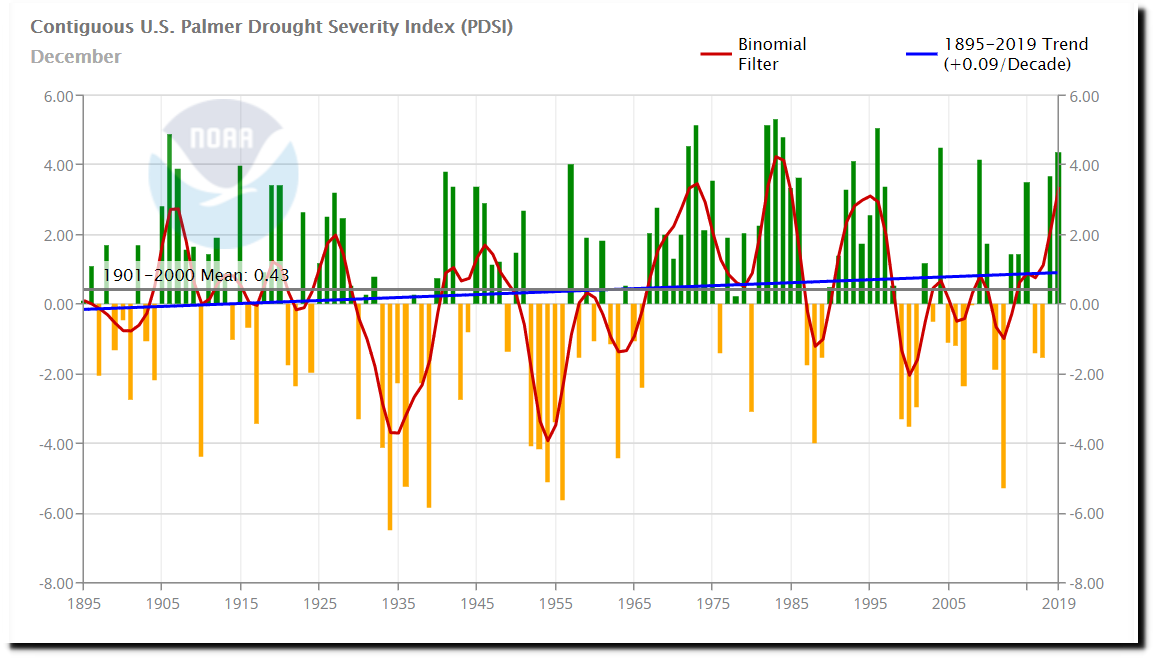
Climate at a Glance | National Centers for Environmental Information (NCEI)
One year after Hansen made his forecasts, scientists at NOAA set the record straight.
U.S. Data Since 1895 Fail To Show Warming Trend
“After examining climate data extending back nearly 100 years, a team of Government scientists has concluded that there has been no significant change in average temperatures or rainfall in the United States over that entire period.
While the nation’s weather in individual years or even for periods of years has been hotter or cooler and drier or wetter than in other periods, the new study shows that over the last century there has been no trend in one direction or another.
The study, made by scientists for the National Oceanic and Atmospheric Administration was published in the current issue of Geophysical Research Letters. It is based on temperature and precipitation readings taken at weather stations around the country from 1895 to 1987.”
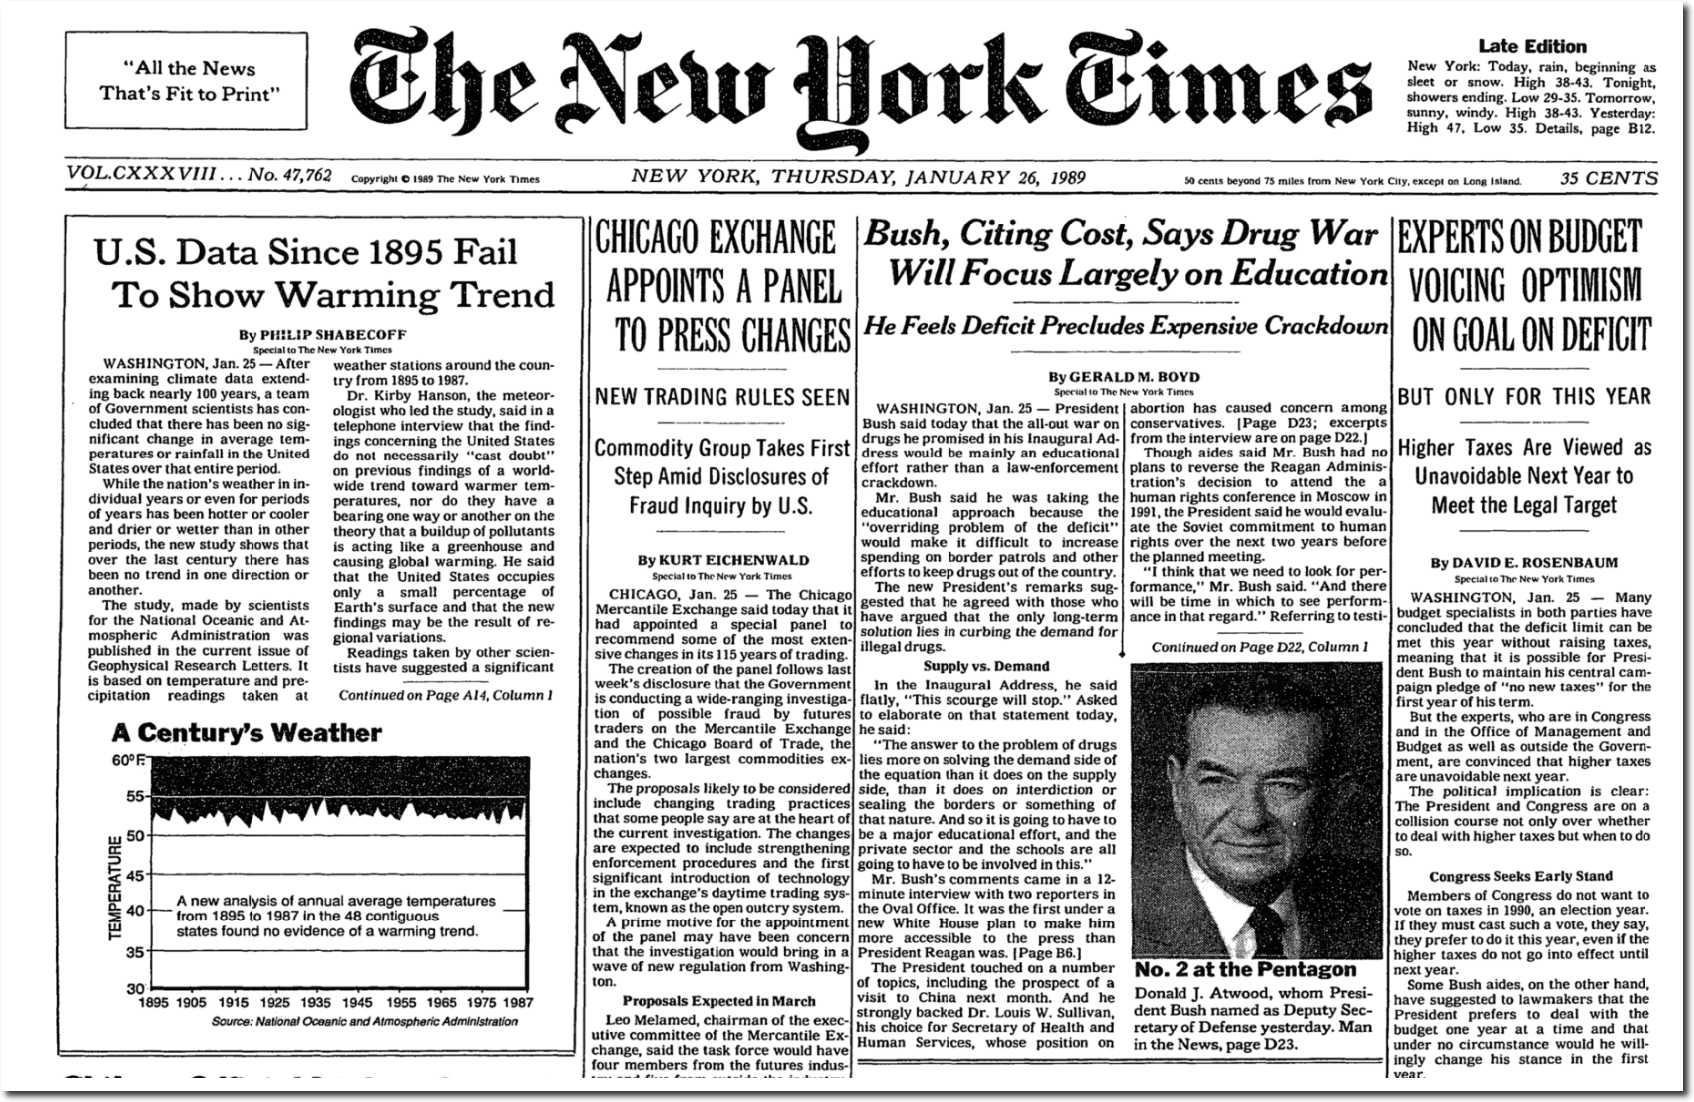
U.S. Data Since 1895 Fail To Show Warming Trend – NYTimes.com
Ten years later, Hansen was upset that the US wasn’t warming as he predicted and the droughts weren’t occurring.
Empirical evidence does not lend much support to the notion that climate is headed precipitately toward more extreme heat and drought. The drought of 1999 covered a smaller area than the 1988 drought, when the Mississippi almost dried up. And 1988 was a temporary inconvenience as compared with repeated droughts during the 1930s “Dust Bowl” that caused an exodus from the prairies, as chronicled in Steinbeck’s Grapes of Wrath.
The U.S. has warmed during the past century, but the warming hardly exceeds year-to-year variability. Indeed, in the U.S. the warmest decade was the 1930s and the warmest year was 1934.
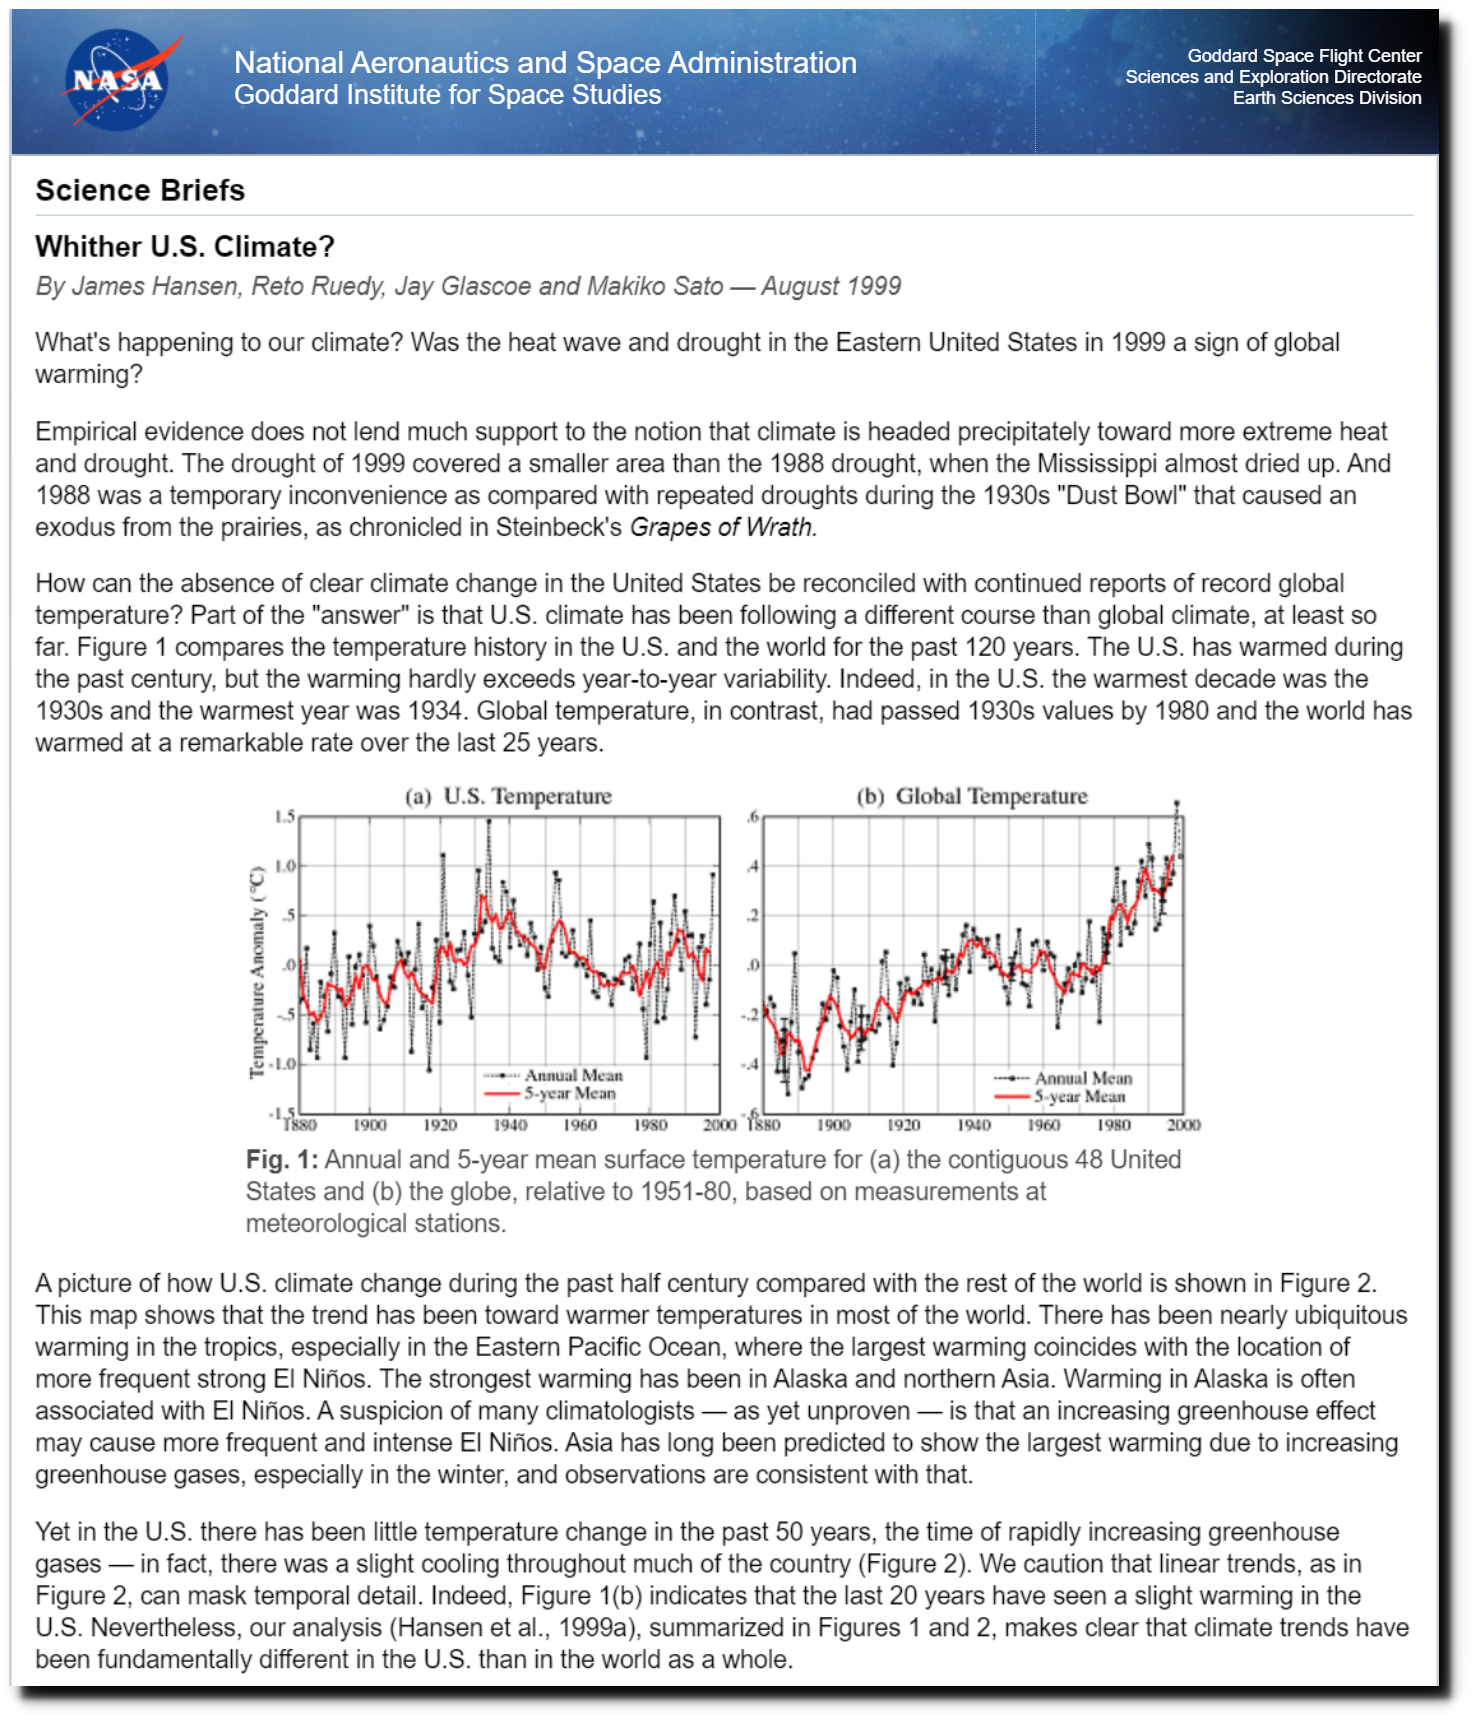
NASA GISS: Science Briefs: Whither U.S. Climate?
So Hansen and NOAA got together and altered the US temperature record. NOAA now shows a warming trend from 1895 to 1987.
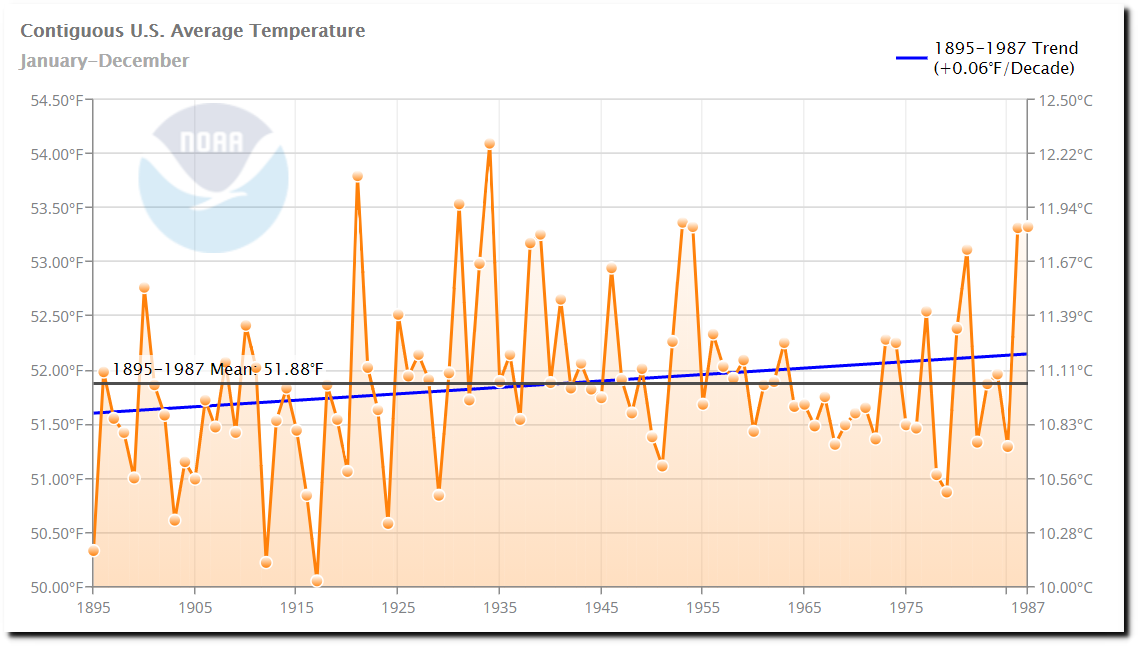
Climate at a Glance | National Centers for Environmental Information (NCEI)
In 2004, NOAA showed that they were altering US temperatures by 0.5F since the year 1900, with no further charges after 1990.
But now they are altering the data by 2.0F.
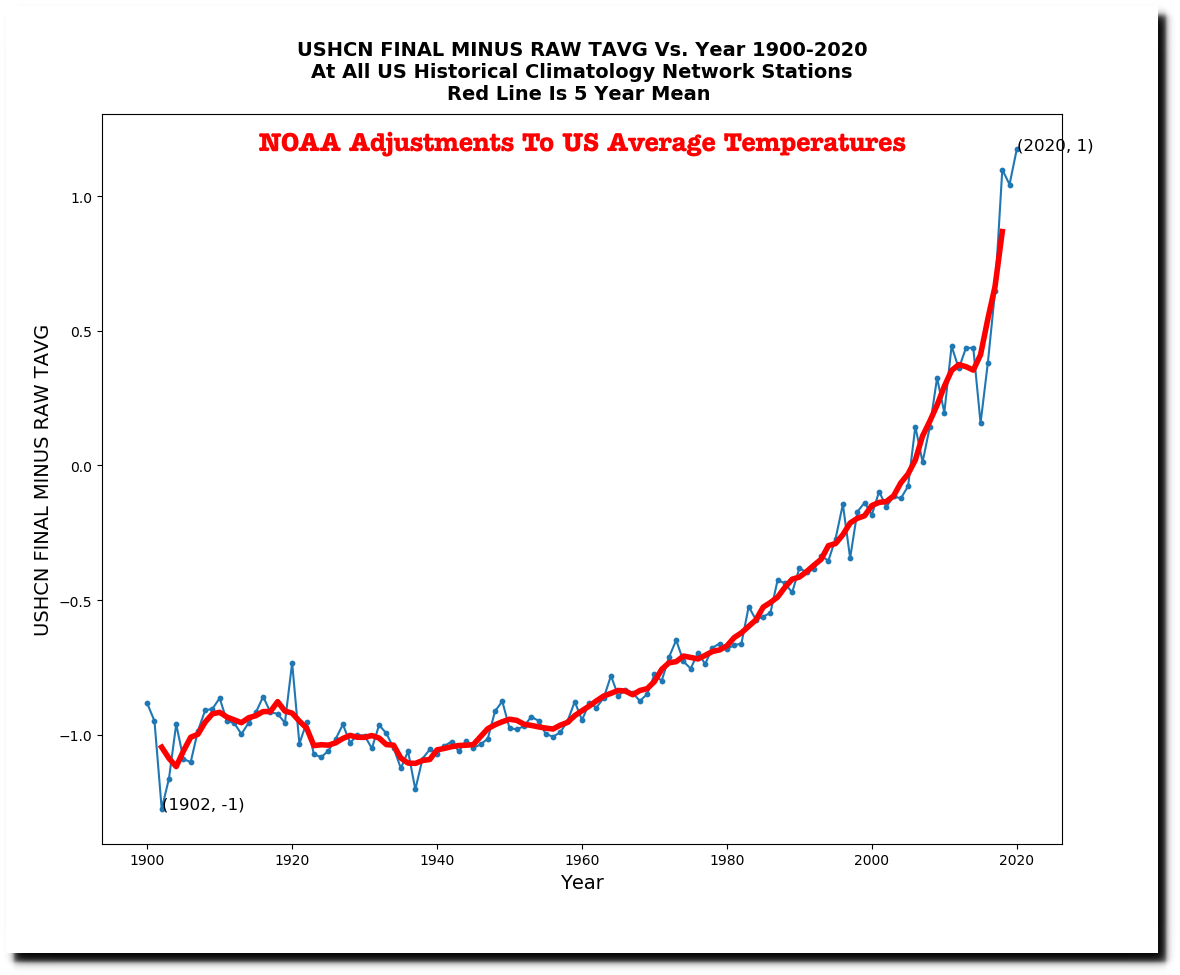
This graph compares the 2004 adjustments in blue, to the current adjustments in red.
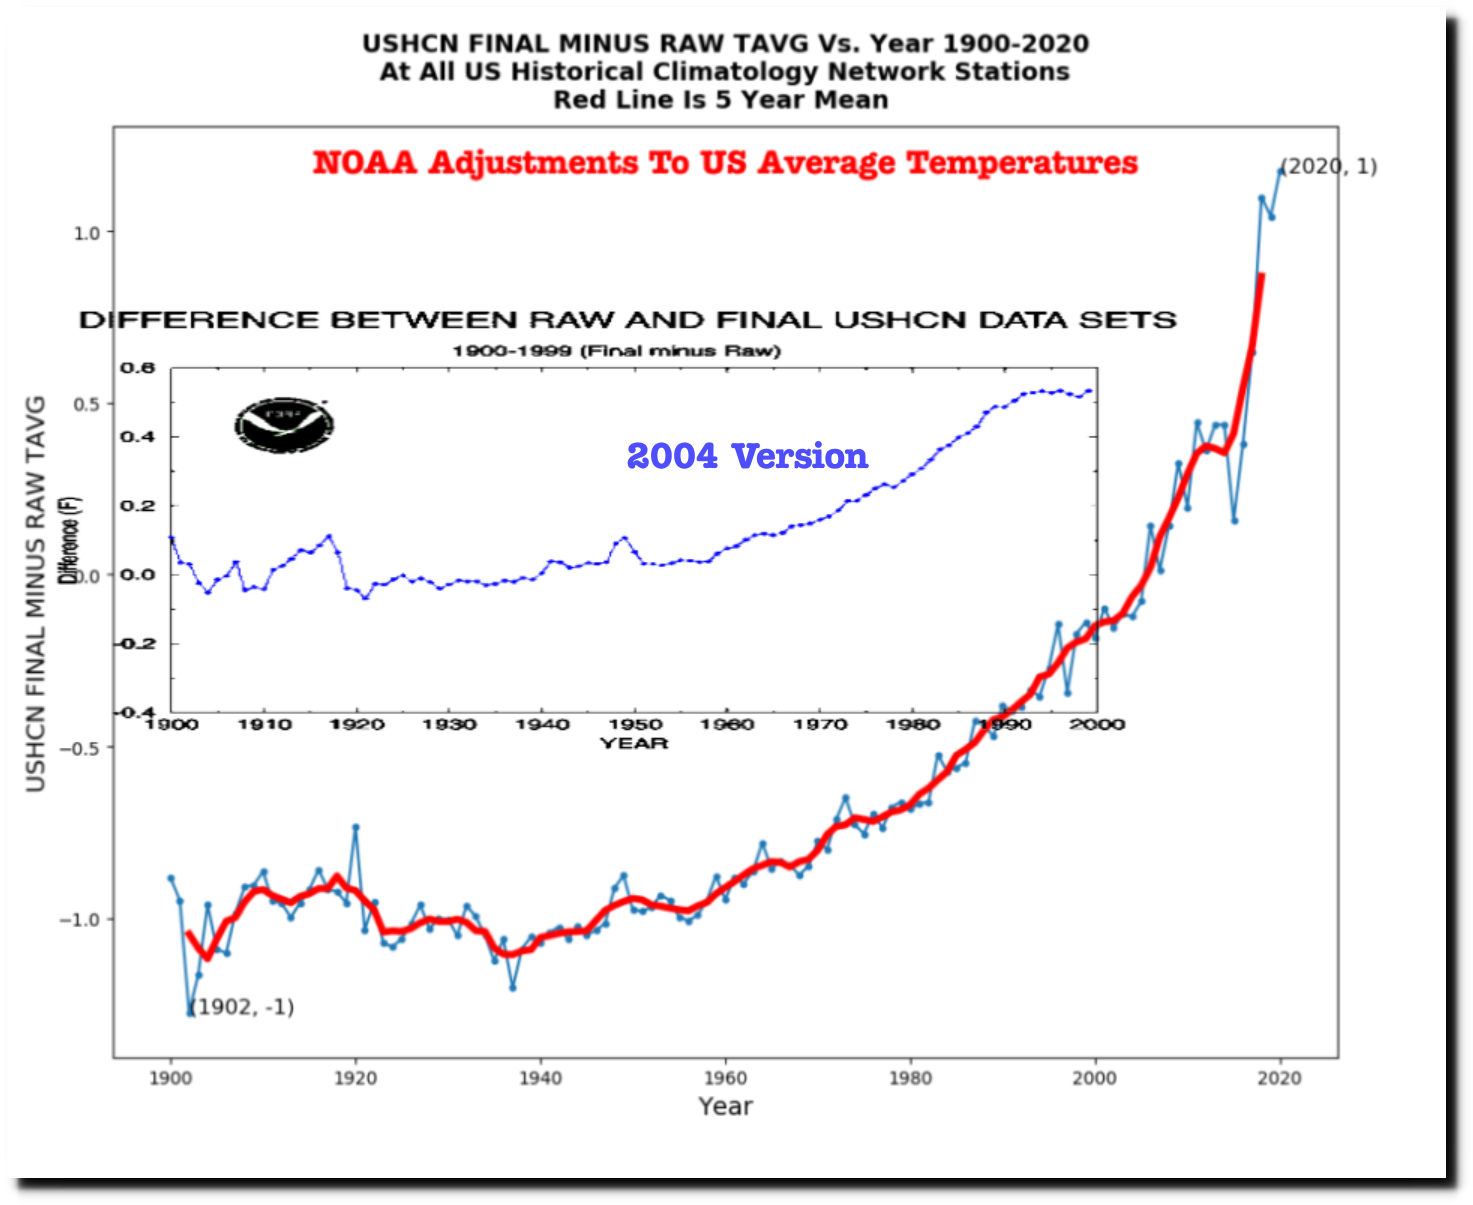
And this graph normalizes the two sets of adjustments along the Y-Axis. There has been a huge increase in the amount of data tampering for years since 1990.
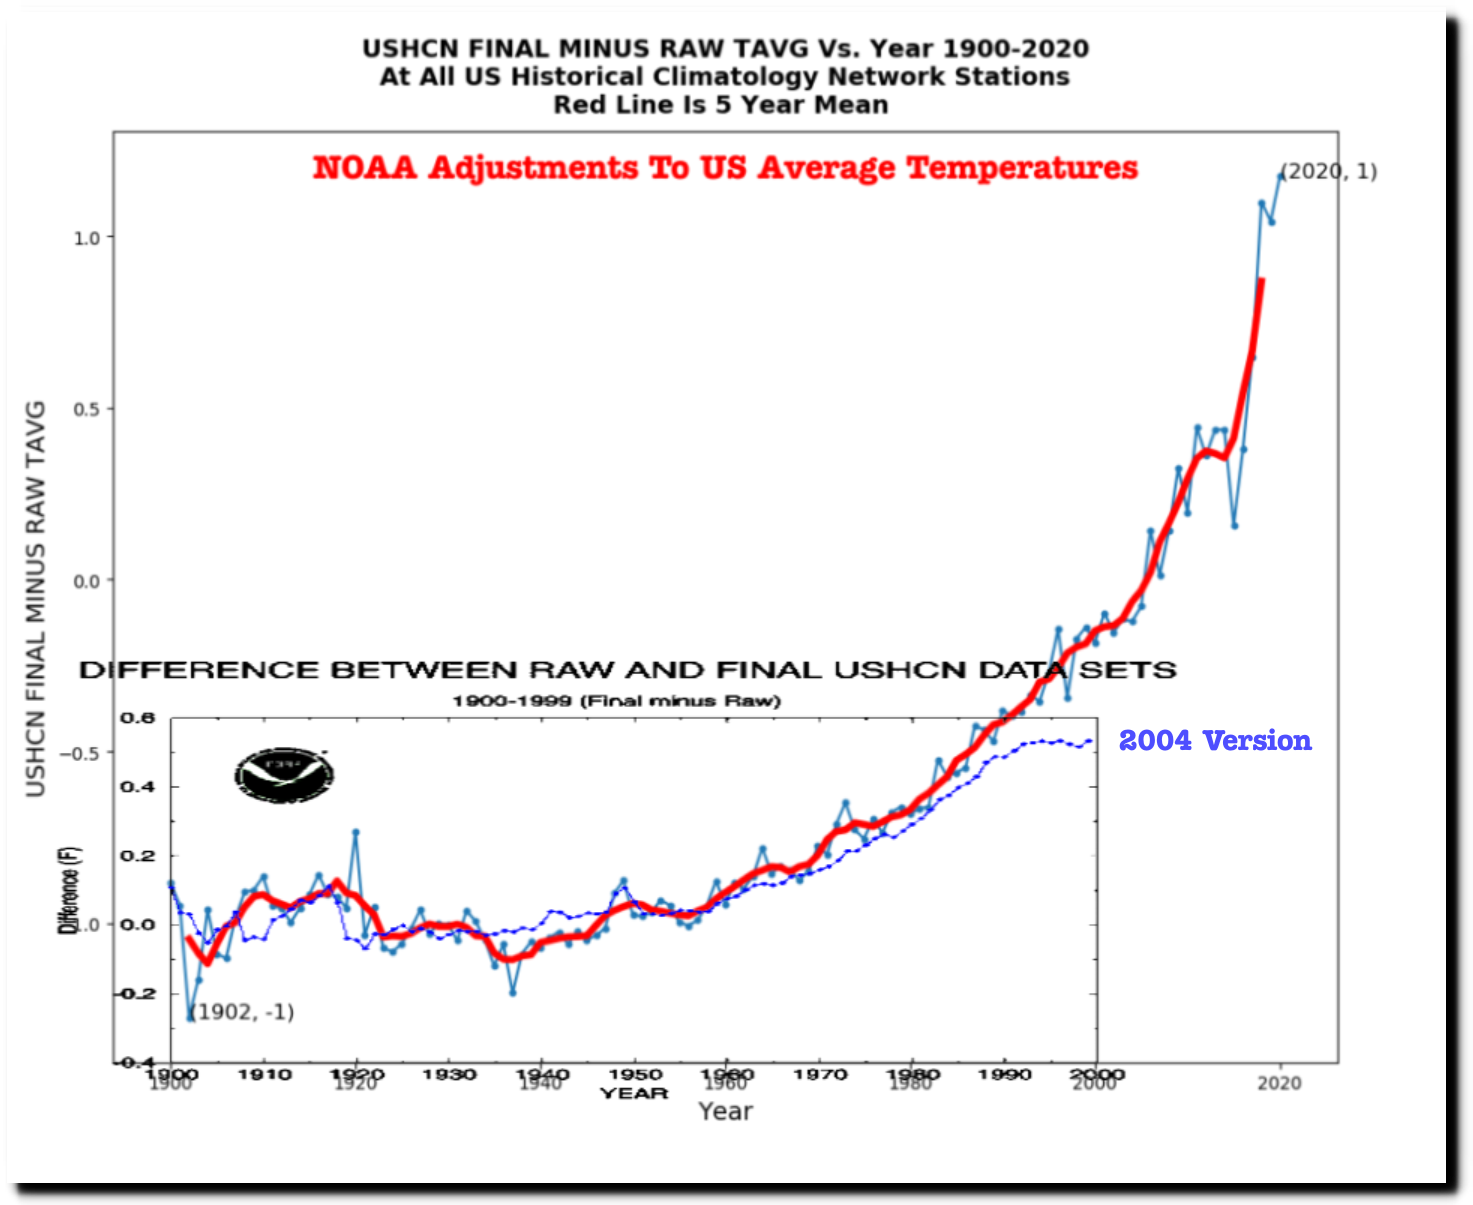
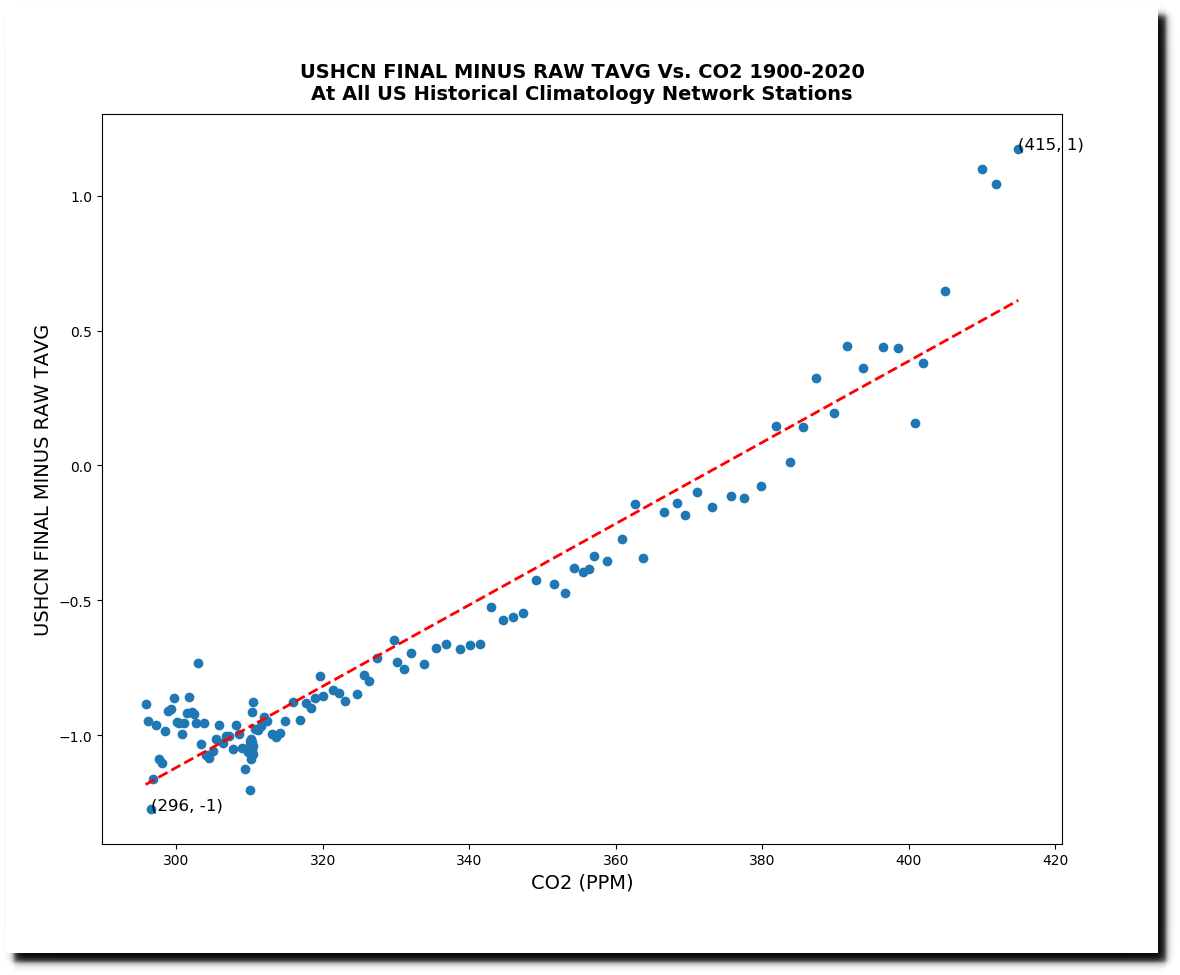
The NOAA adjustments trend very closely with the amount of carbon dioxide in the atmosphere, or at least they did until three years ago, when there was a huge increase in the amount of tampering.
NOAA fabricates missing data using a computer model, and last year almost 50% of their monthly US temperature data was fabricated.
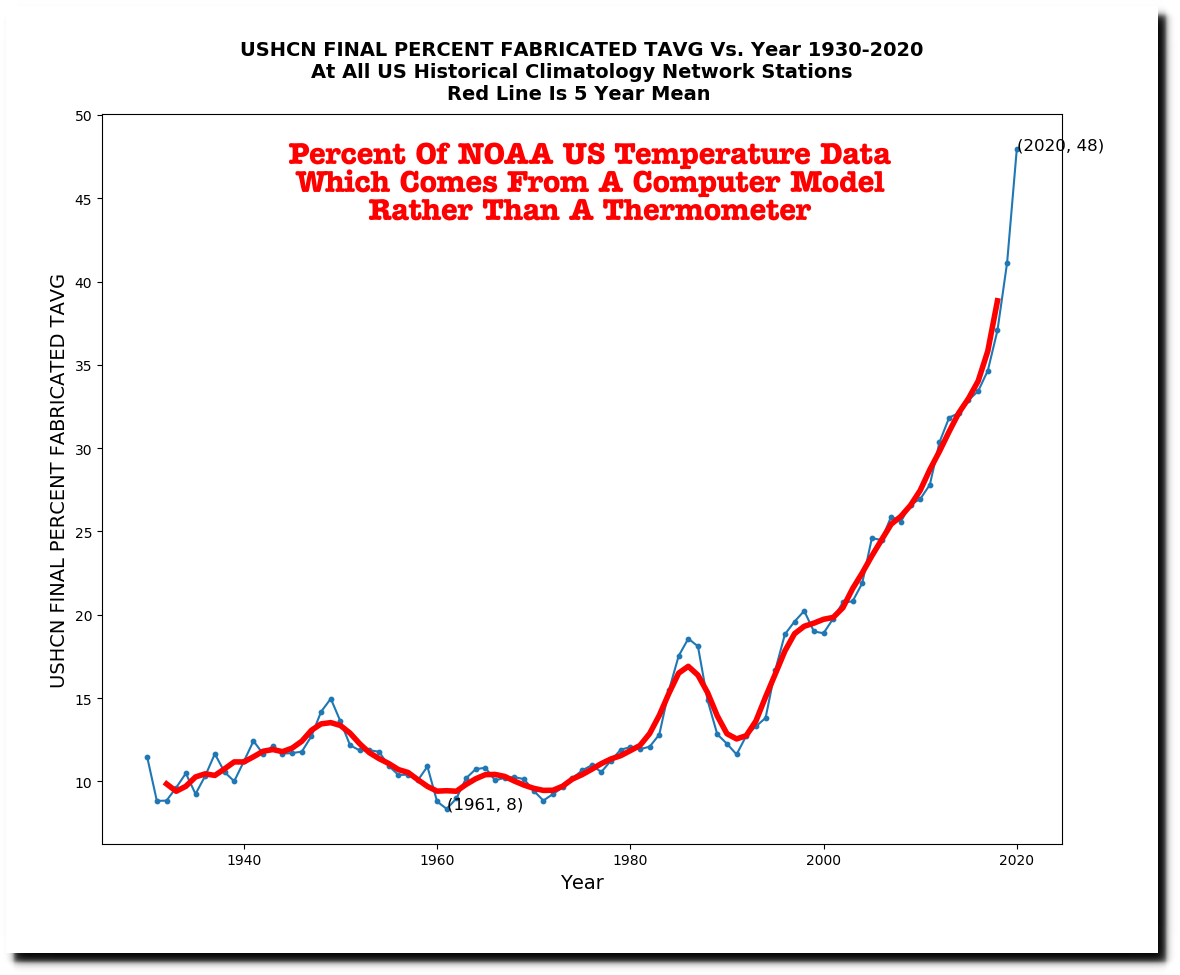
This is the data for Brewton, Alabama. If the data is estimated rather than measured, it is marked with an “E” – All twelve months of 2020 were marked with an E.

ftp://ftp.ncdc.noaa.gov/pub/data/ushcn/v2.5/ushcn.tavg.latest.FLs.52j.tar.gz
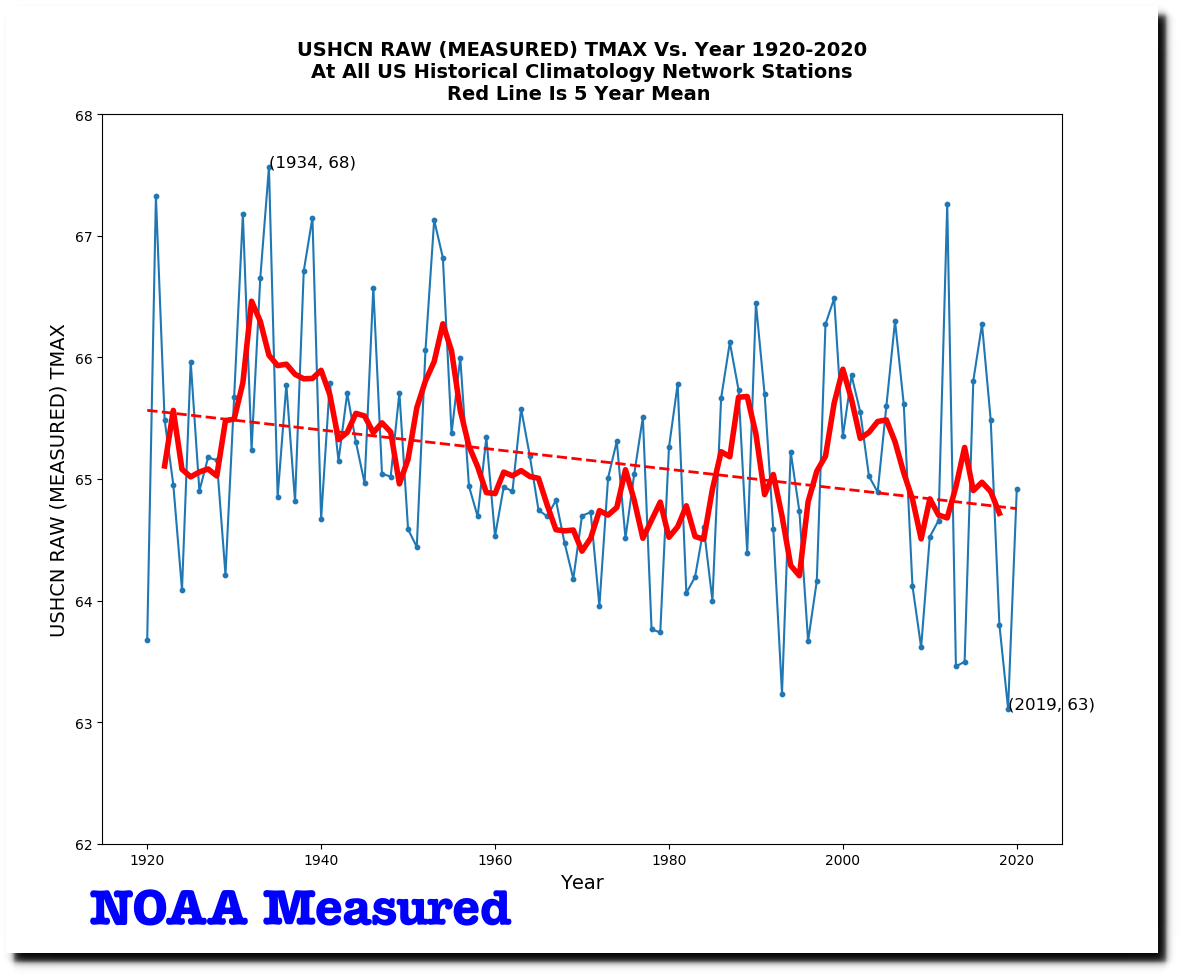
The current data tampering is huge. The measured daily maximum temperature data for the US shows a strong cooling trend.
ftp://ftp.ncdc.noaa.gov/pub/data/ushcn/v2.5/
But the adjusted data shows a strong warming trend.
The total adjustment to US average temperatures is more than two degrees Fahrenheit.
Plotted vs. CO2, it can be seen that until the last three years, the adjustments being made very closely tracked the increase in CO2. Data is being altered to match their theory.
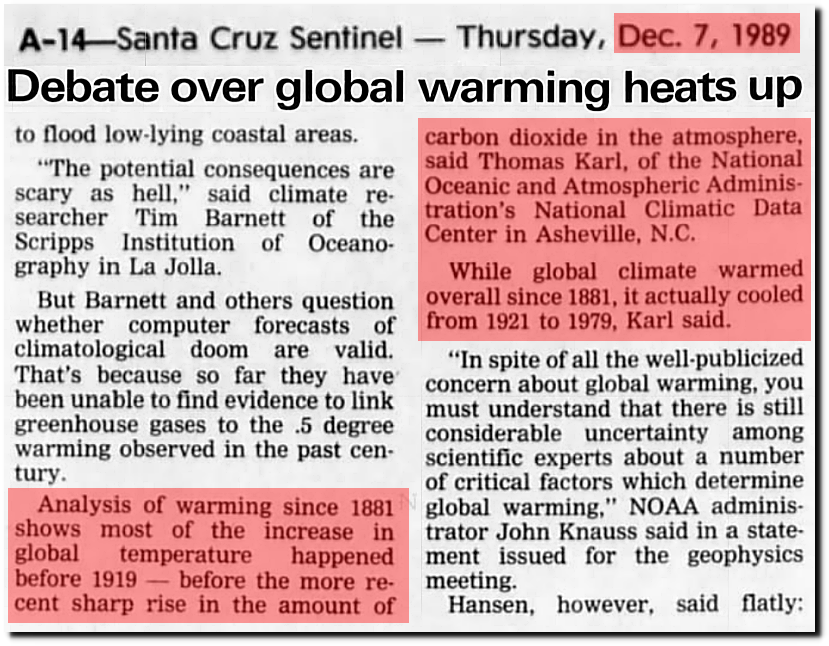
07 Dec 1989, Page 14 – Santa Cruz Sentinel at Newspapers.com
NOAA graphs now show a warming trend from 1921 to 1979.
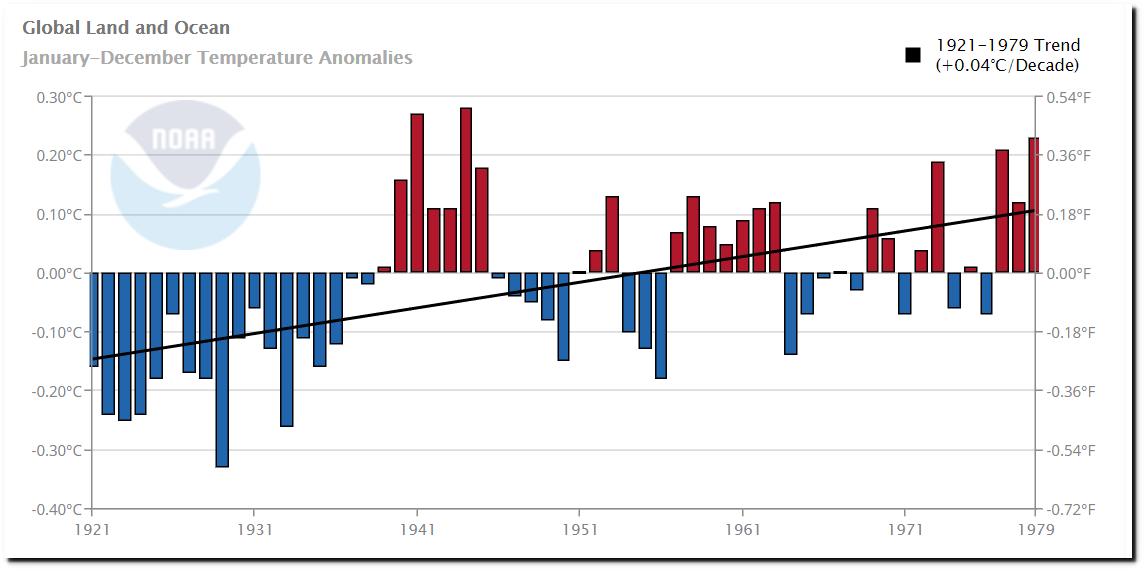
Climate at a Glance | National Centers for Environmental Information (NCEI)
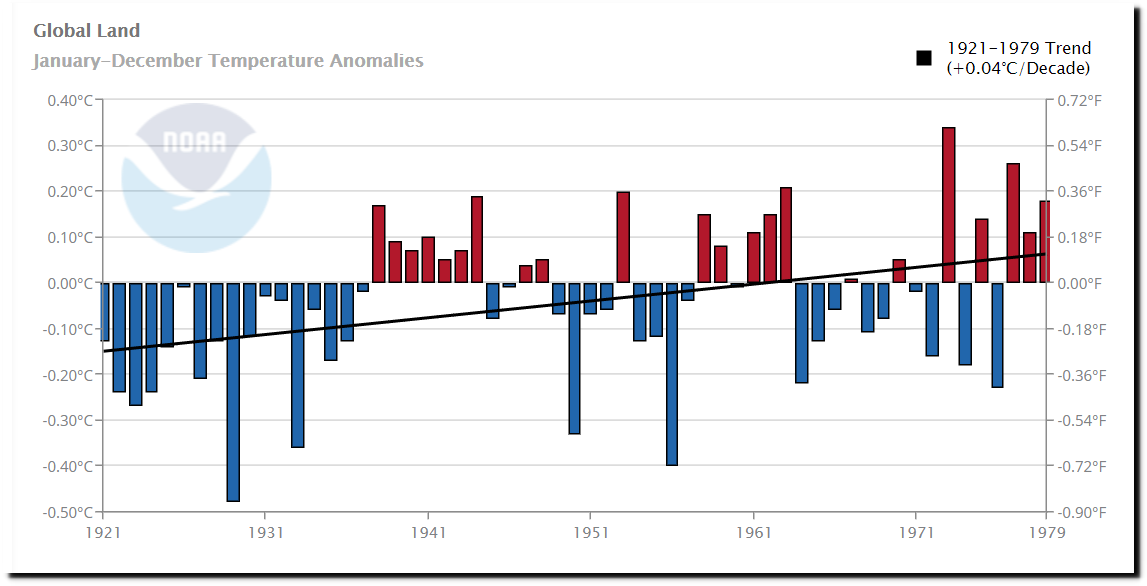
Climate at a Glance | National Centers for Environmental Information (NCEI)
One hundred years ago, the New York Times reported that earth had a fever.
“an intermittent fever, manifested in a world-wide heat wave of unusual length and intensity.”
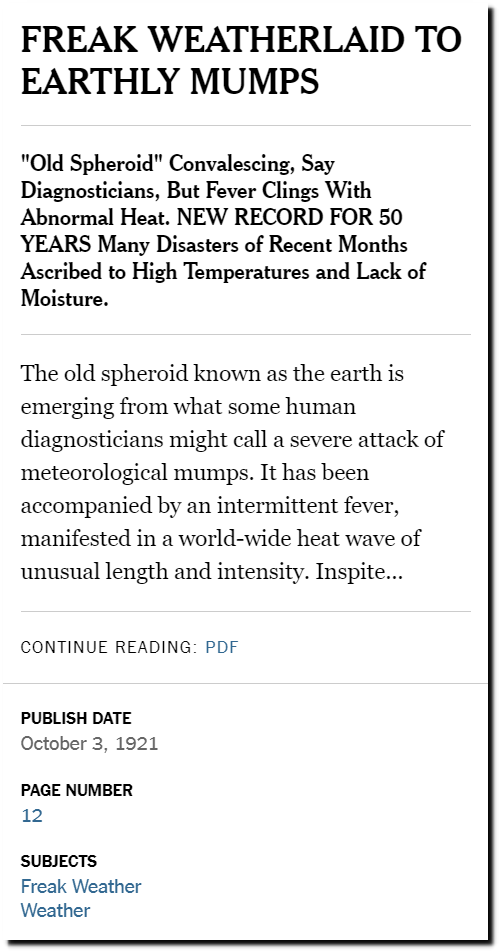
TimesMachine: October 3, 1921 – NYTimes.com
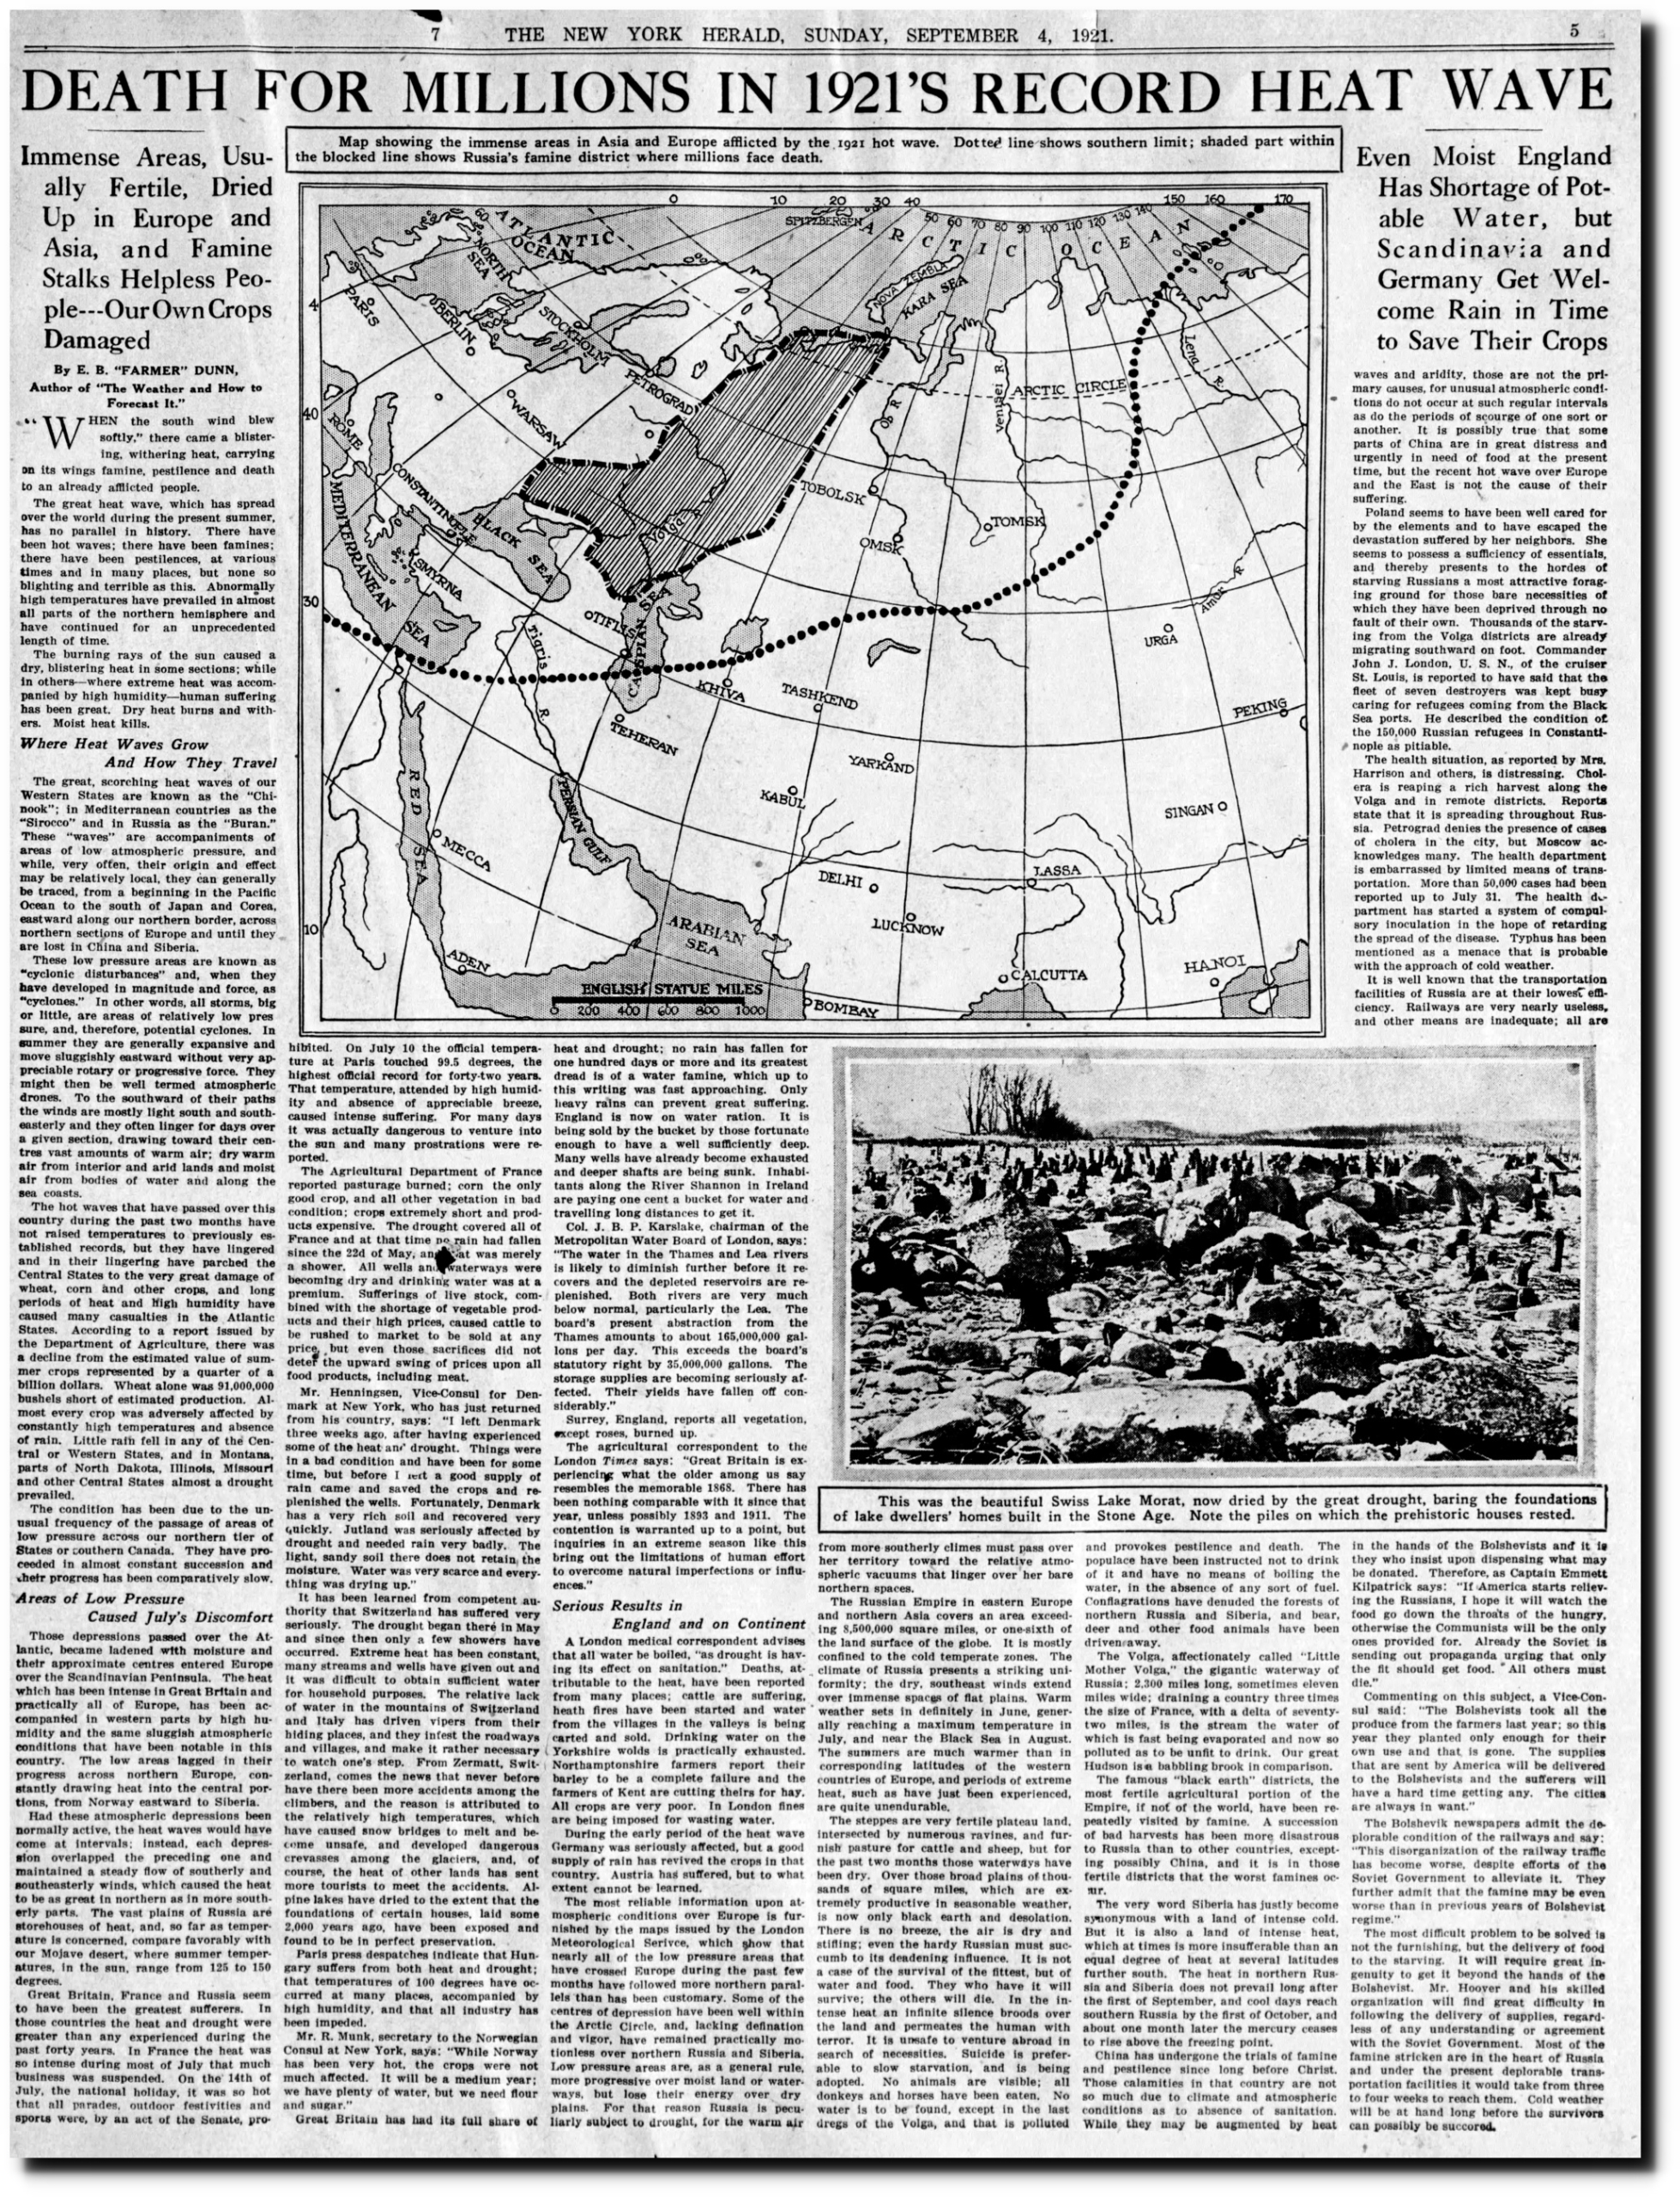
04 Sep 1921, 61 – New York Herald at Newspapers.com
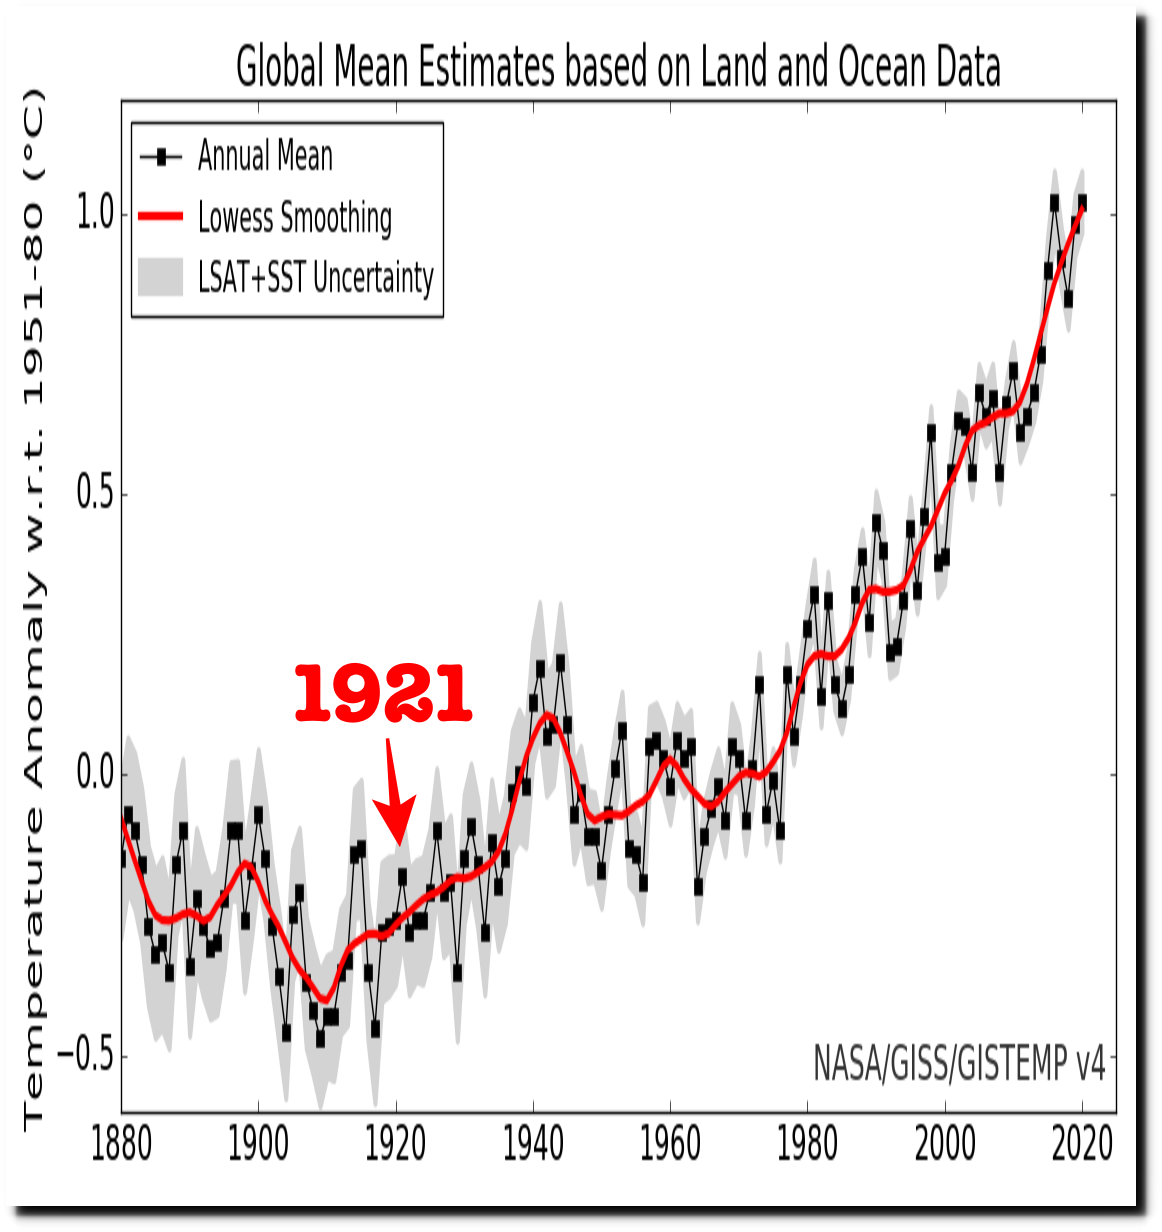
Yet NASA now shows 1921 was one of the coldest years on record.
CRUTEM4 shows that 1921 was hot. January was very warm in much of the world.
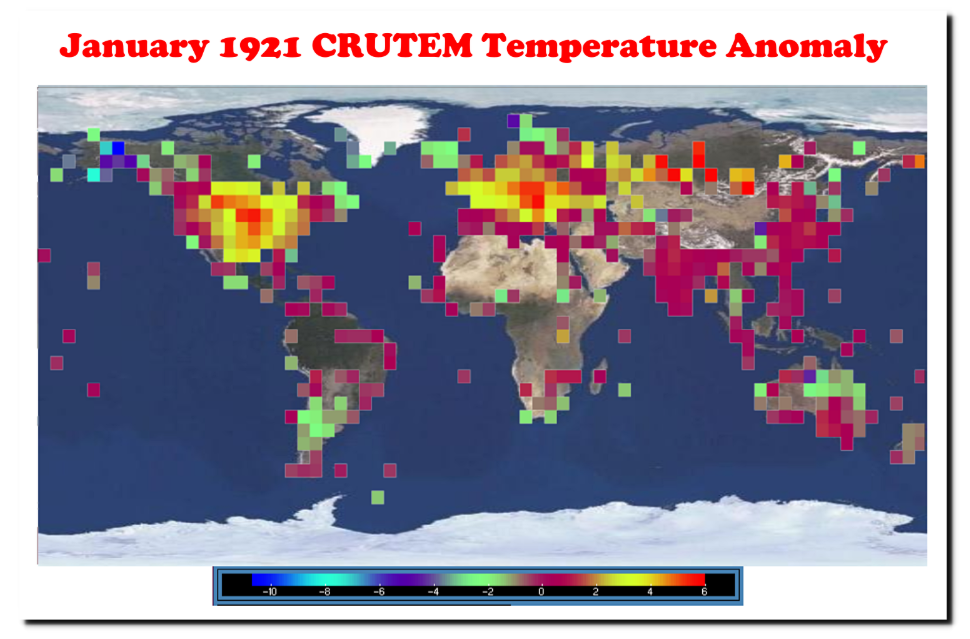
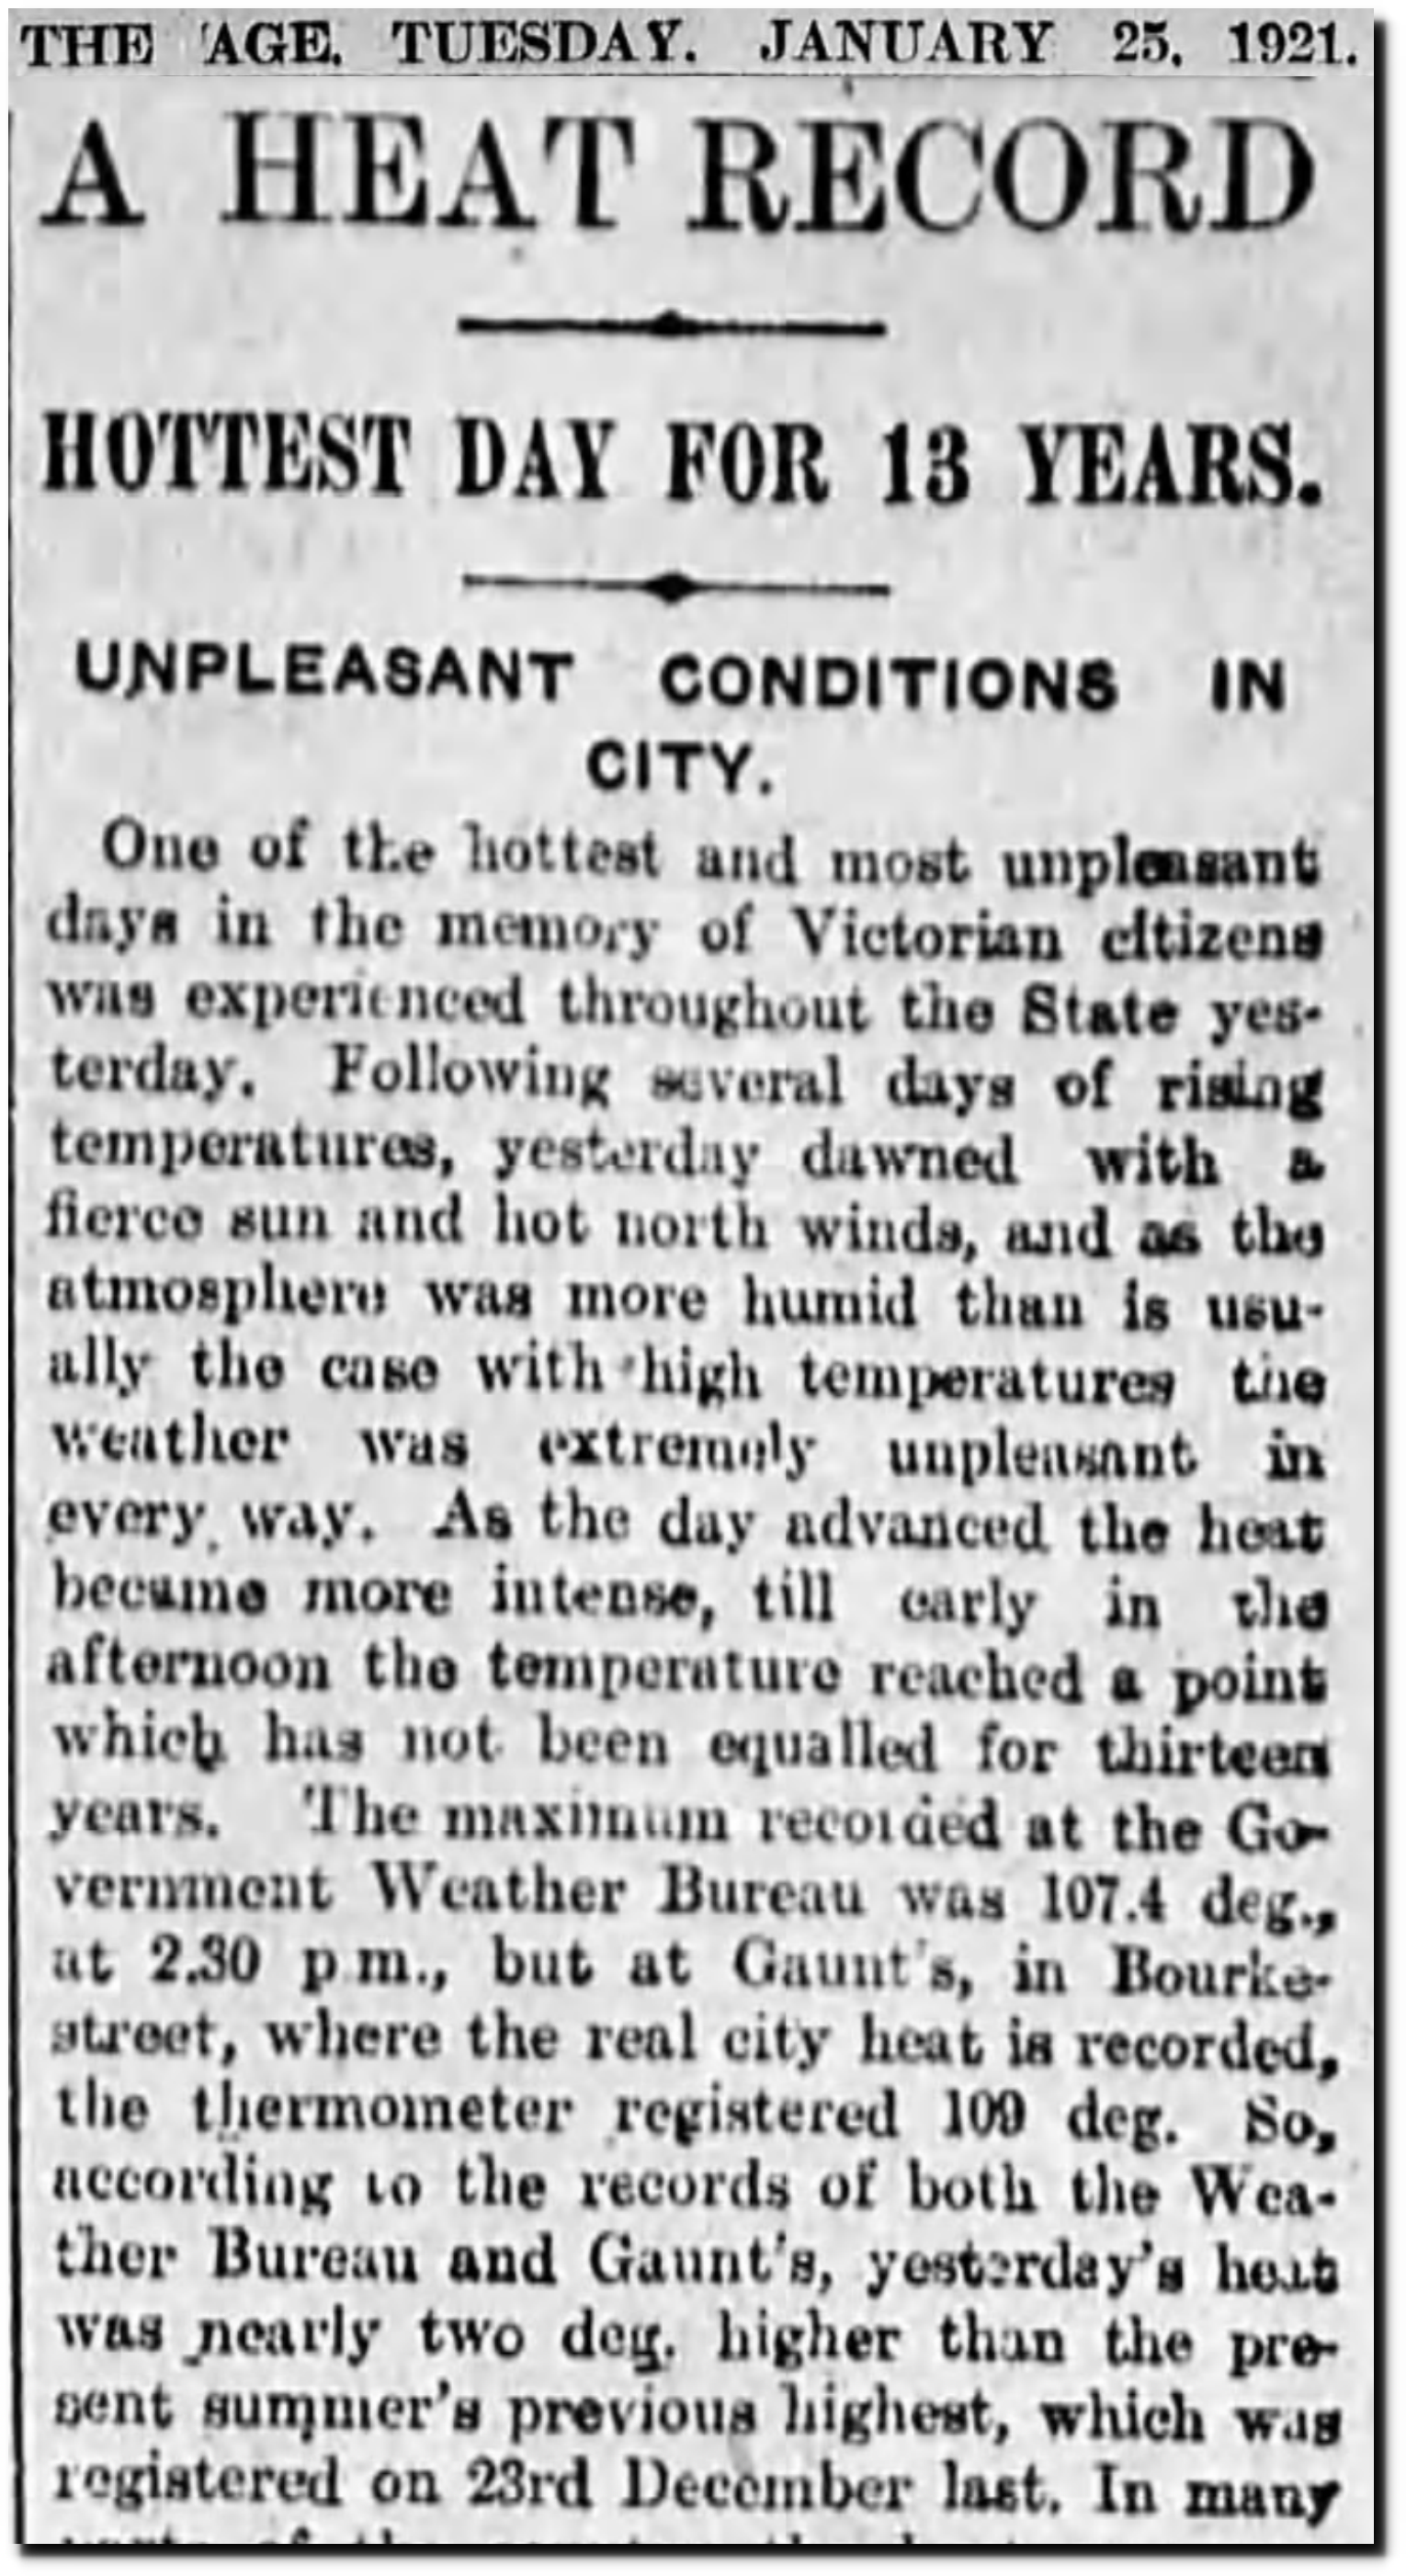
25 Jan 1921, Page 5 – The Age at Newspapers.com
This animation shows CRUTEM4 anomalies for all of 1921.
In 1921, the Arctic was very warm and glaciers were rapidly disappearing.

TimesMachine: February 25, 1923 – NYTimes.com
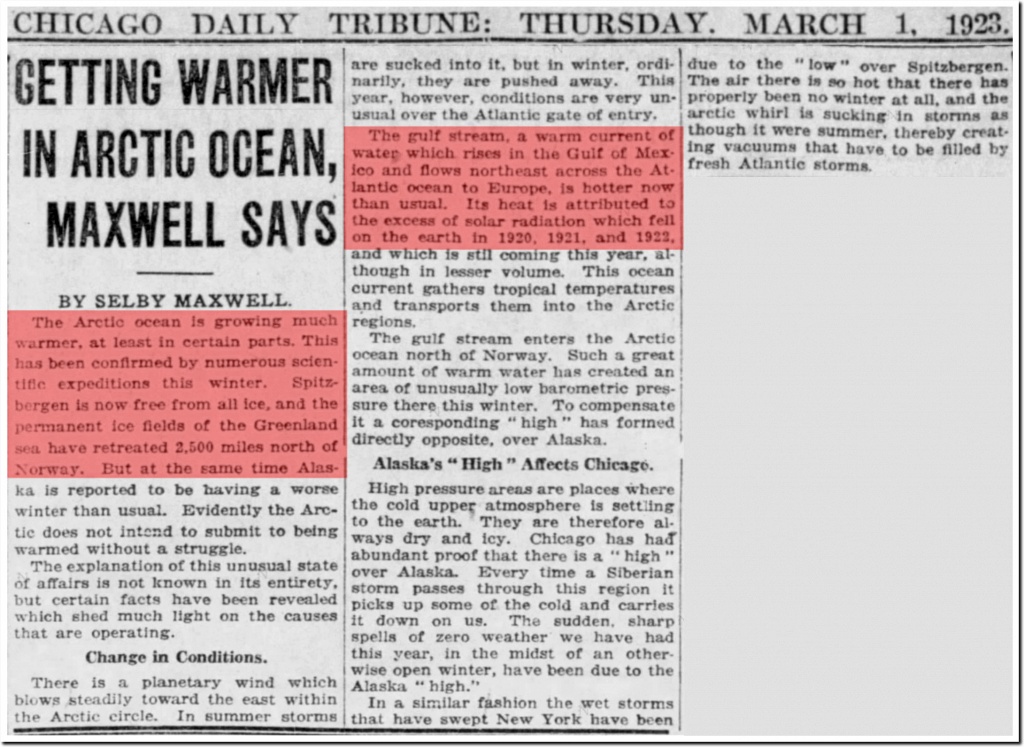
01 Mar 1923, 4 – Chicago Tribune at Newspapers.com
In 1922, the New York Times reported 100 degree temperatures in the Arctic.
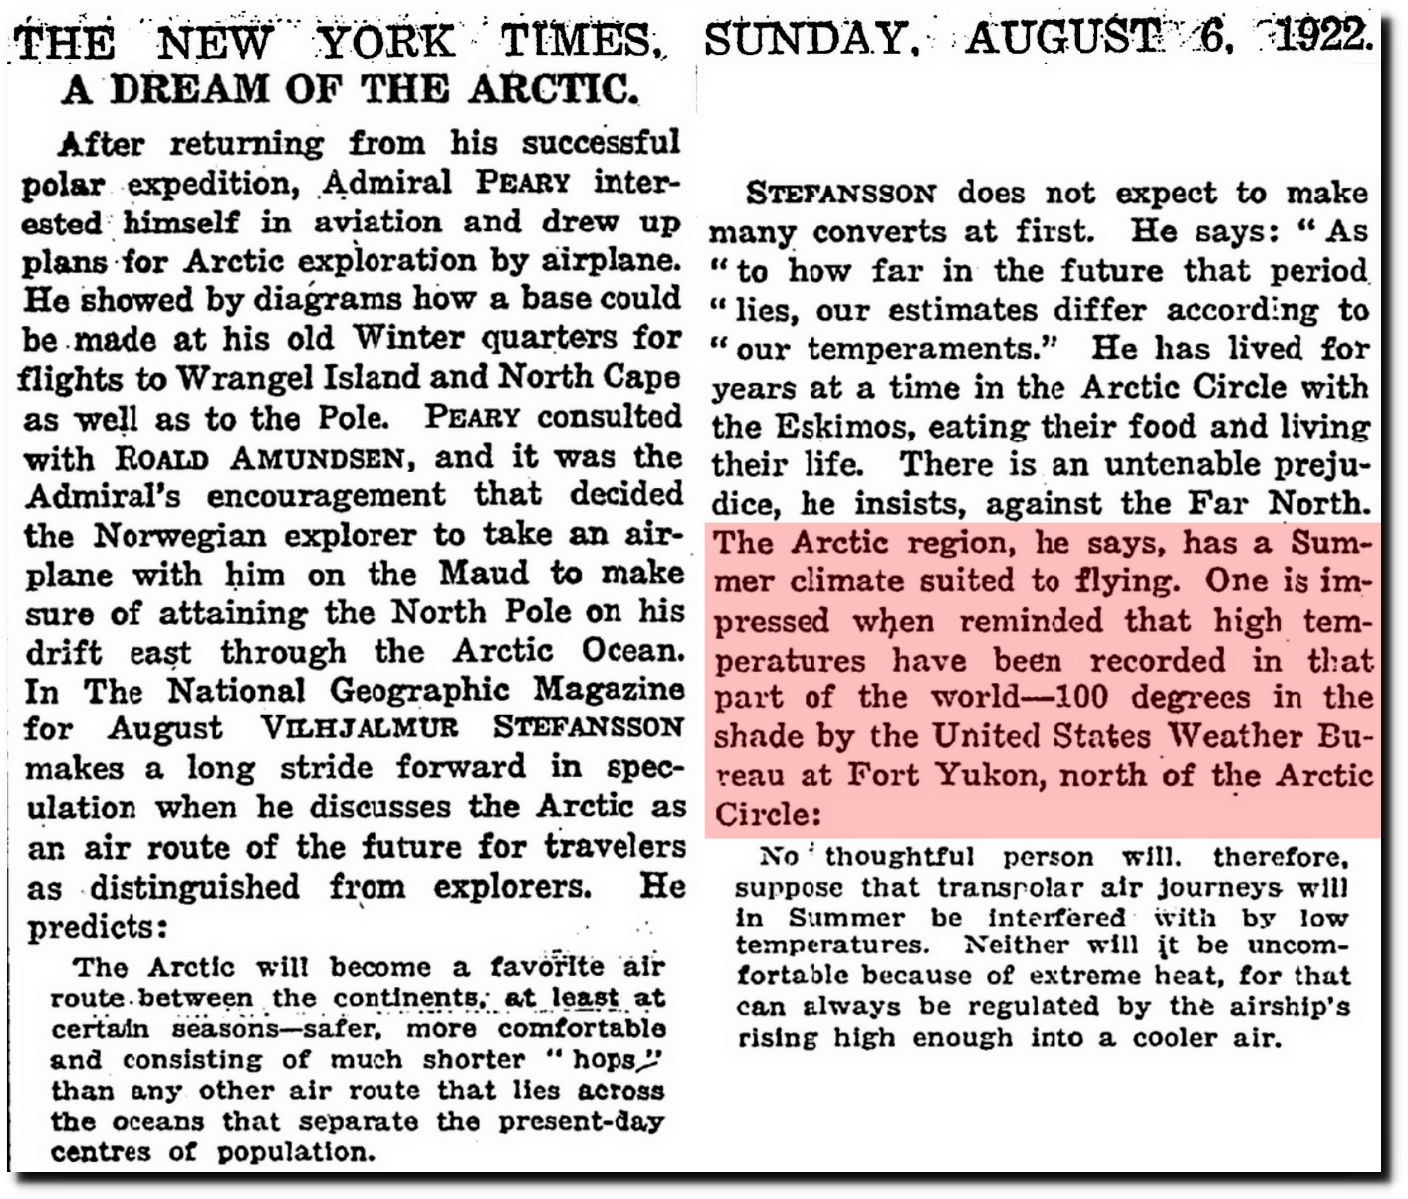
TimesMachine: August 6, 1922 – NYTimes.com

National Geographic Magazine Archive
The ice between Alaska and the North Pole was thin, rotten new ice.
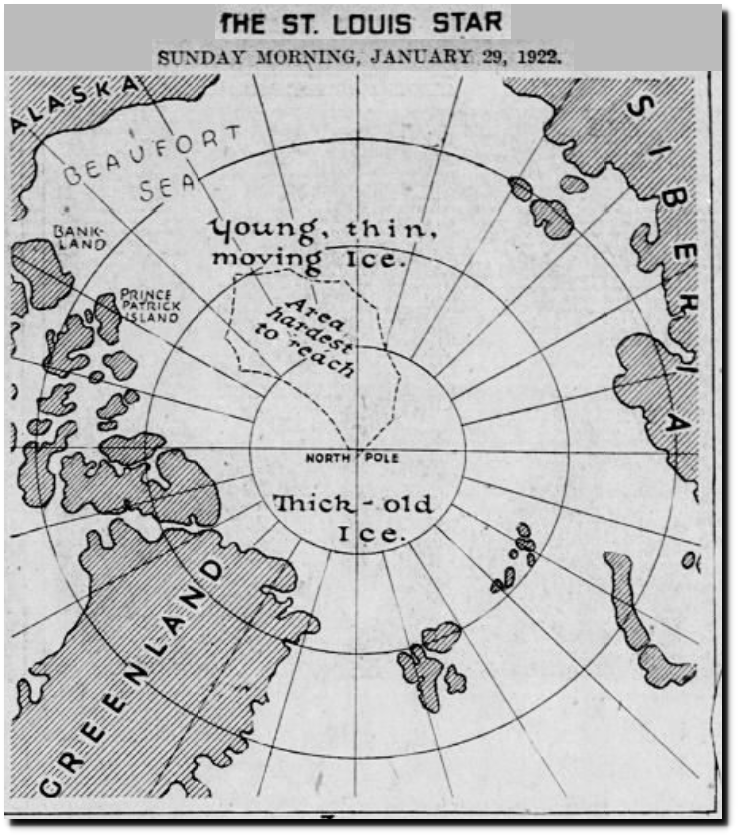
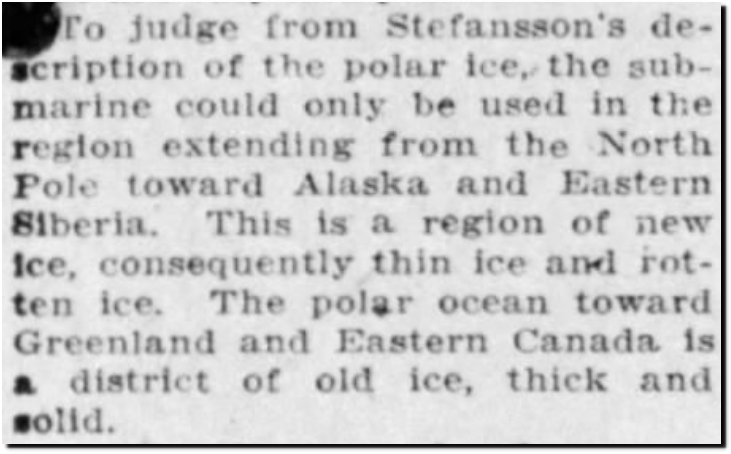
29 Jan 1922, Page 35 – The St. Louis Star and Times at Newspapers.com
Much of the world was experiencing exceptional heat, including Alaska.
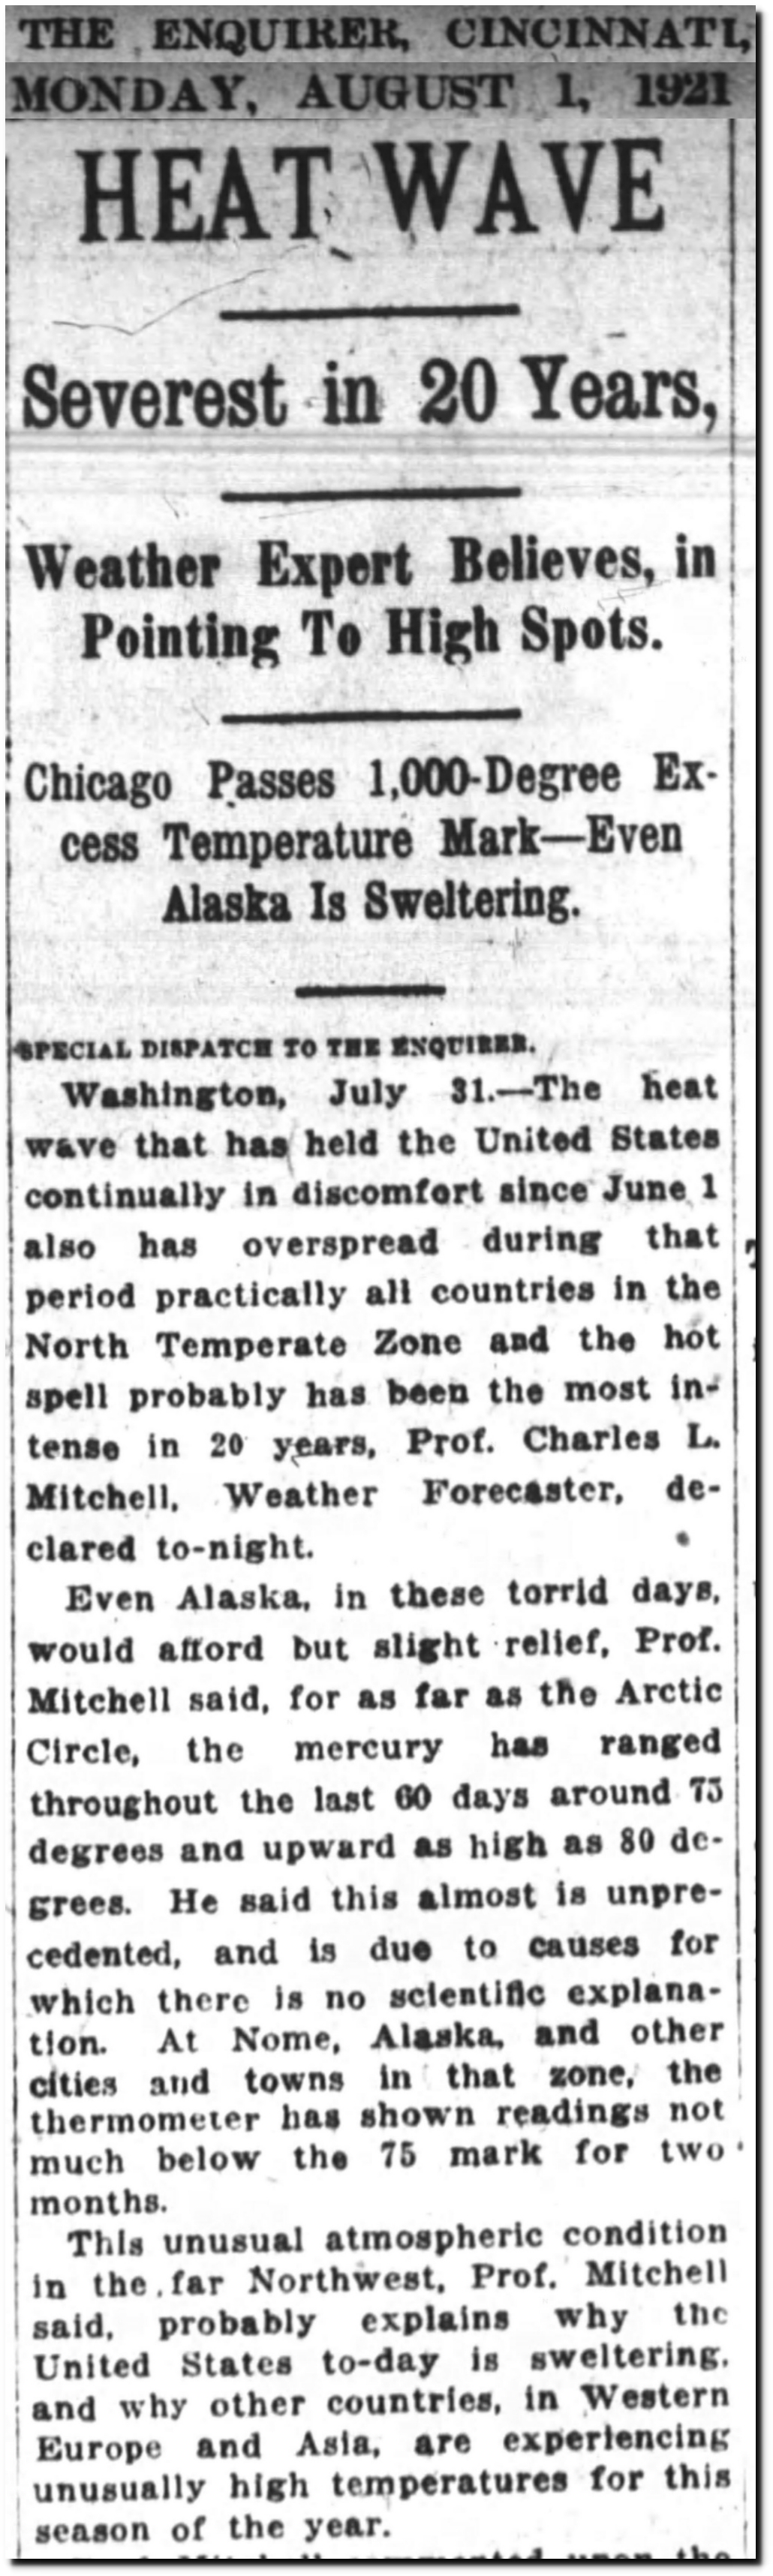
01 Aug 1921, Page 4 – The Cincinnati Enquirer at Newspapers.com
 14 Aug 1922 – Misplaced Tropical Heat. – Trove
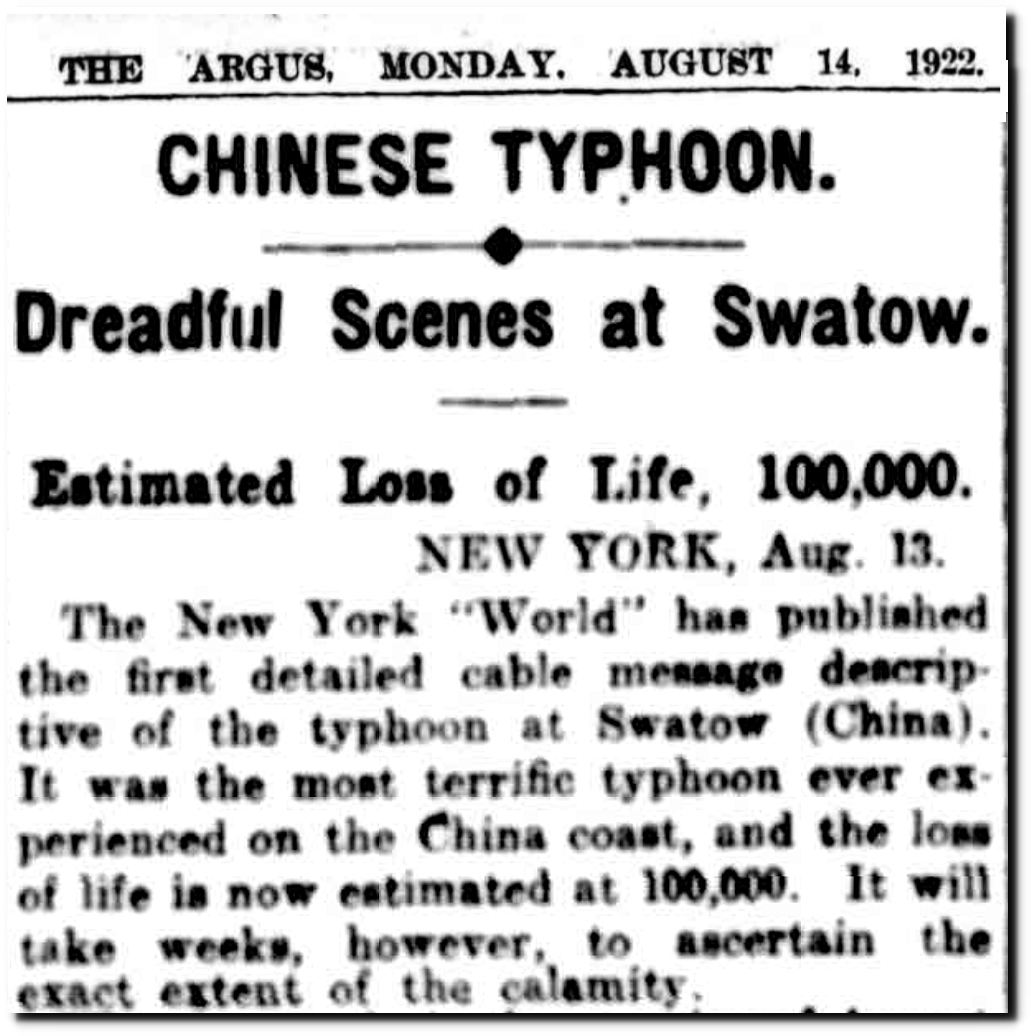
14 Aug 1922 – CHINESE TYPHOON. – Trove
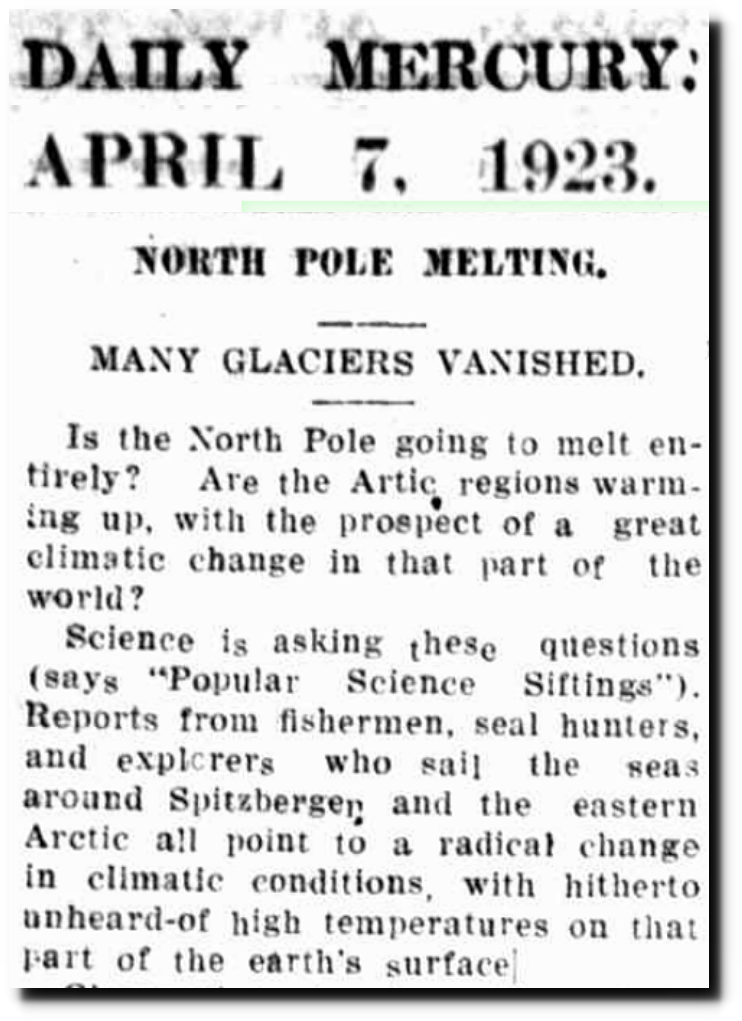
07 Apr 1923 – NORTH POLE MELTING. – Trove
Glaciers in Glacier National Park were forecast to disappear before 1950.
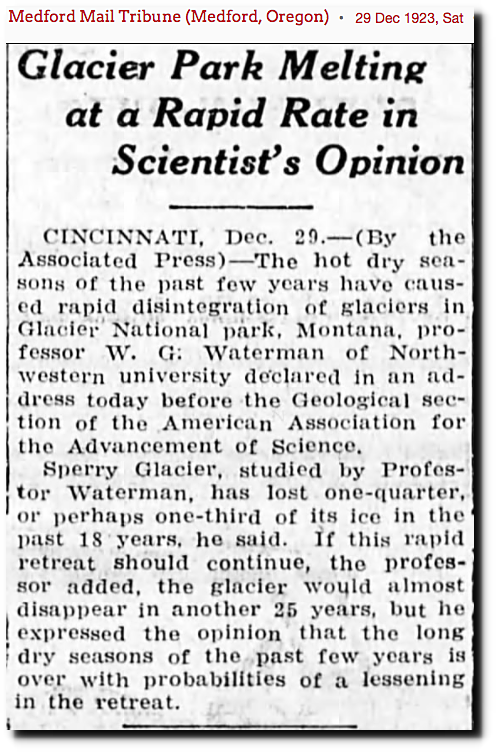
29 Dec 1923, Page 5 – at Newspapers.com
The world record heatwave occurred at Marble Bar, West Australia in 1923-1924. BOM has since deleted this article.
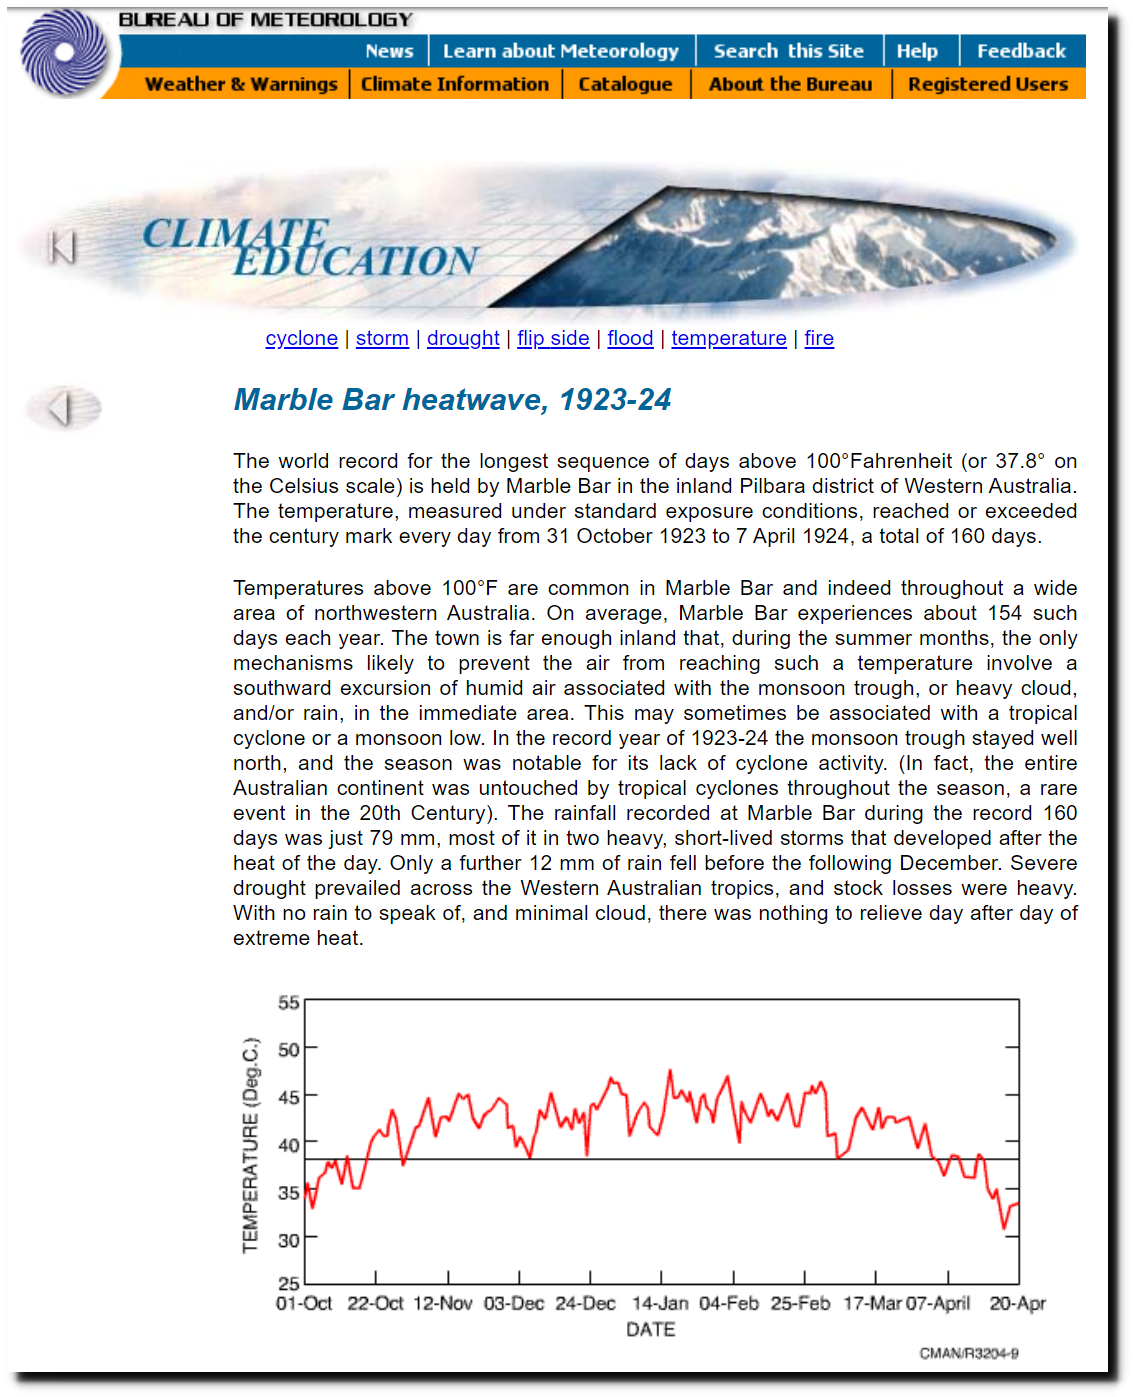
BOM – Australian Climate Extremes
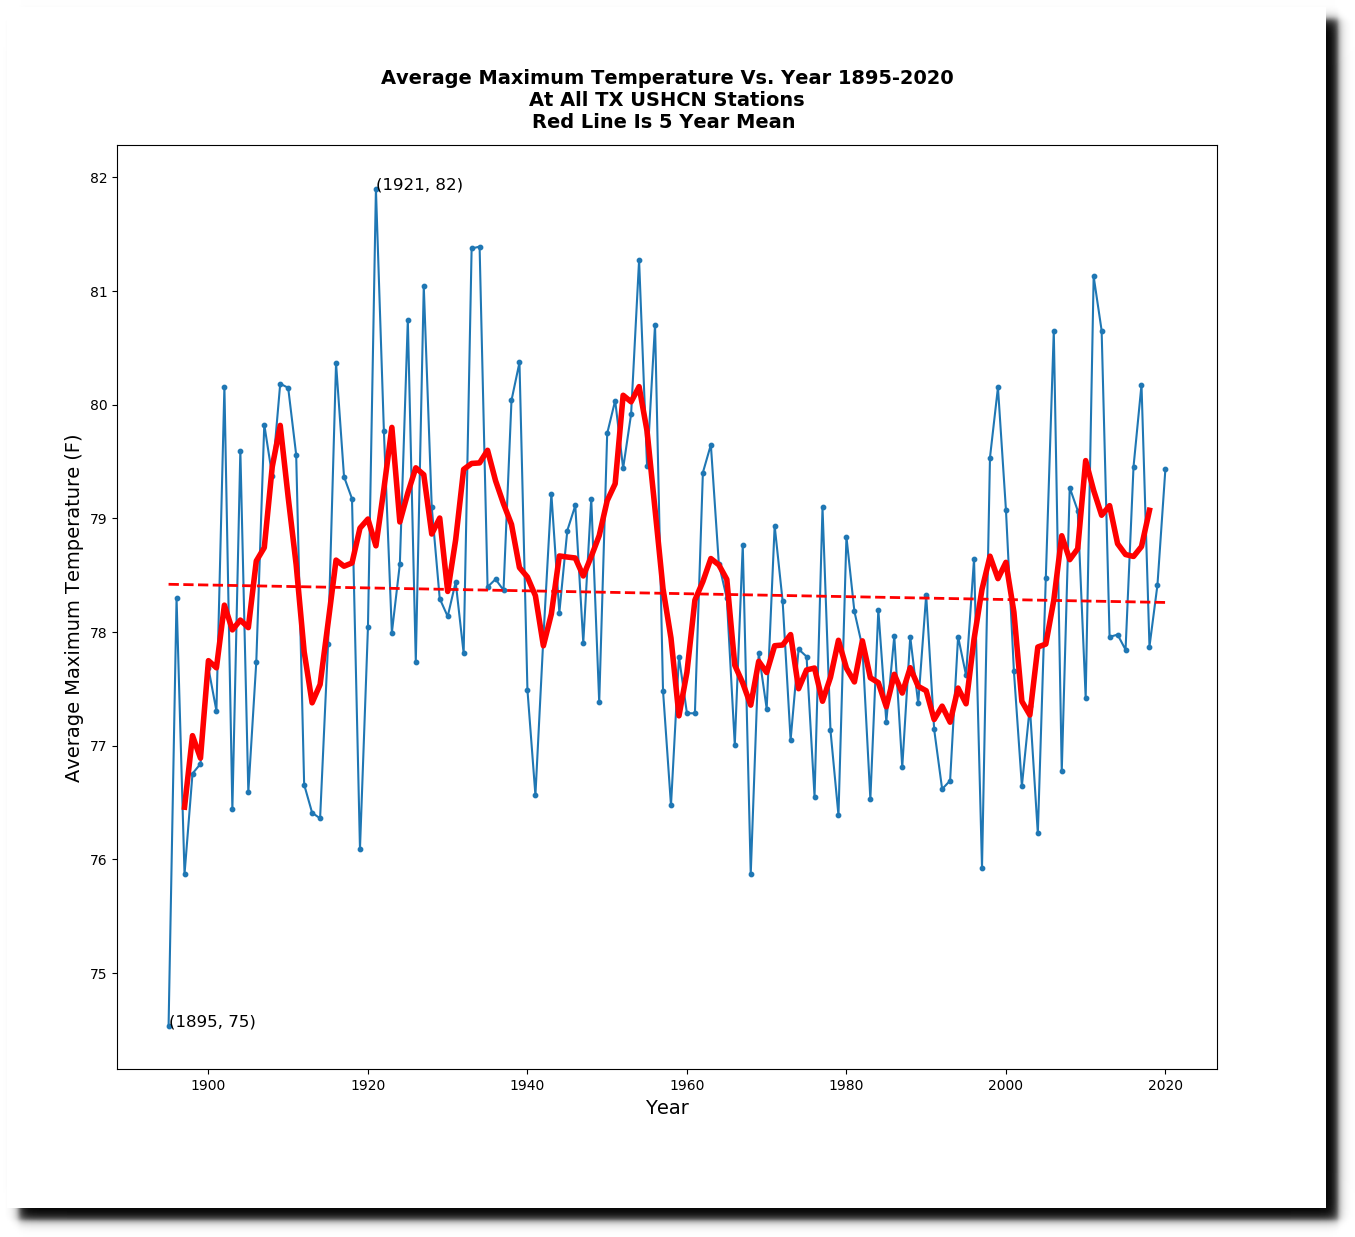
The average daily maximum temperature in Texas was highest on record in 1921.
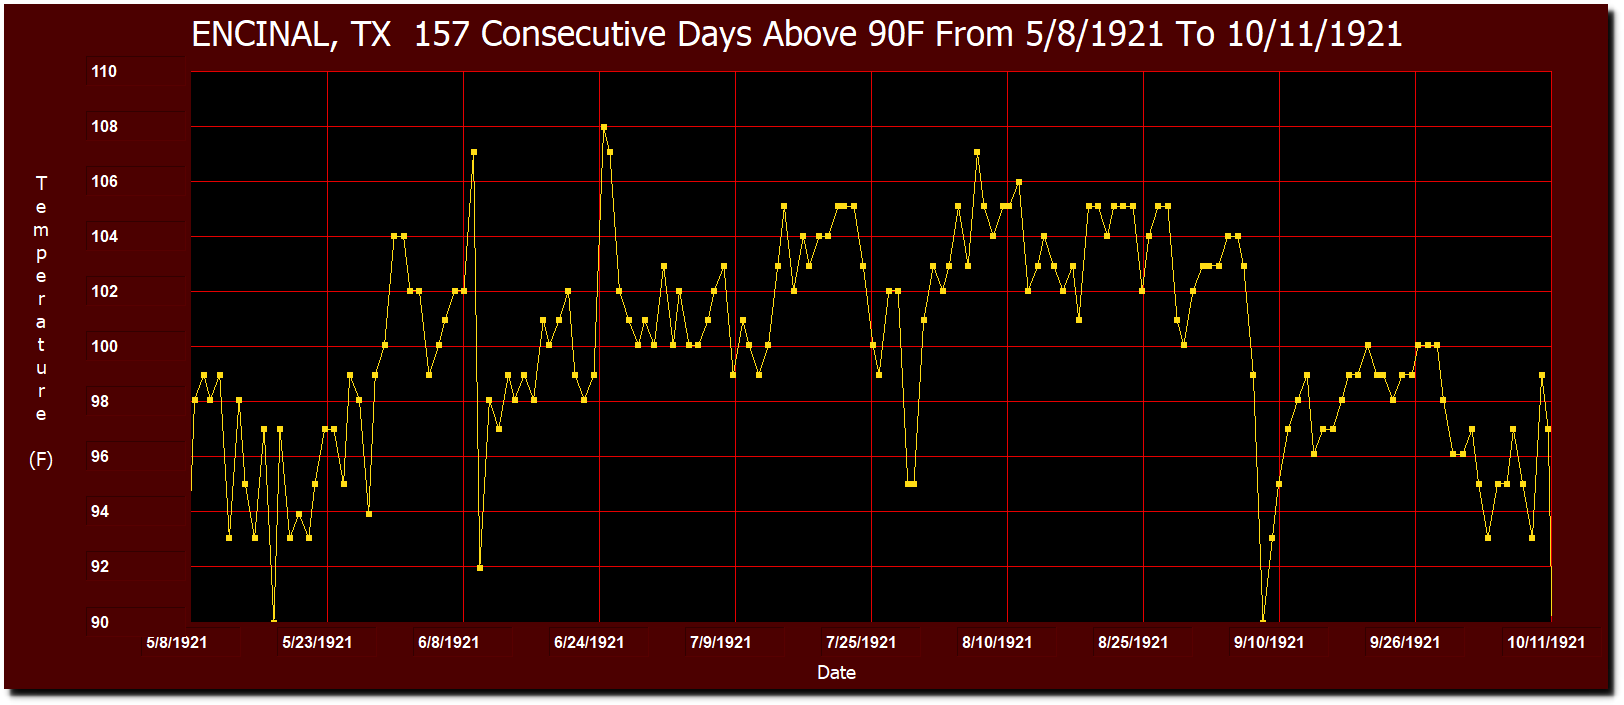
Encinal, Texas had 157 consecutive days above 90F in 1921, the Texas record.
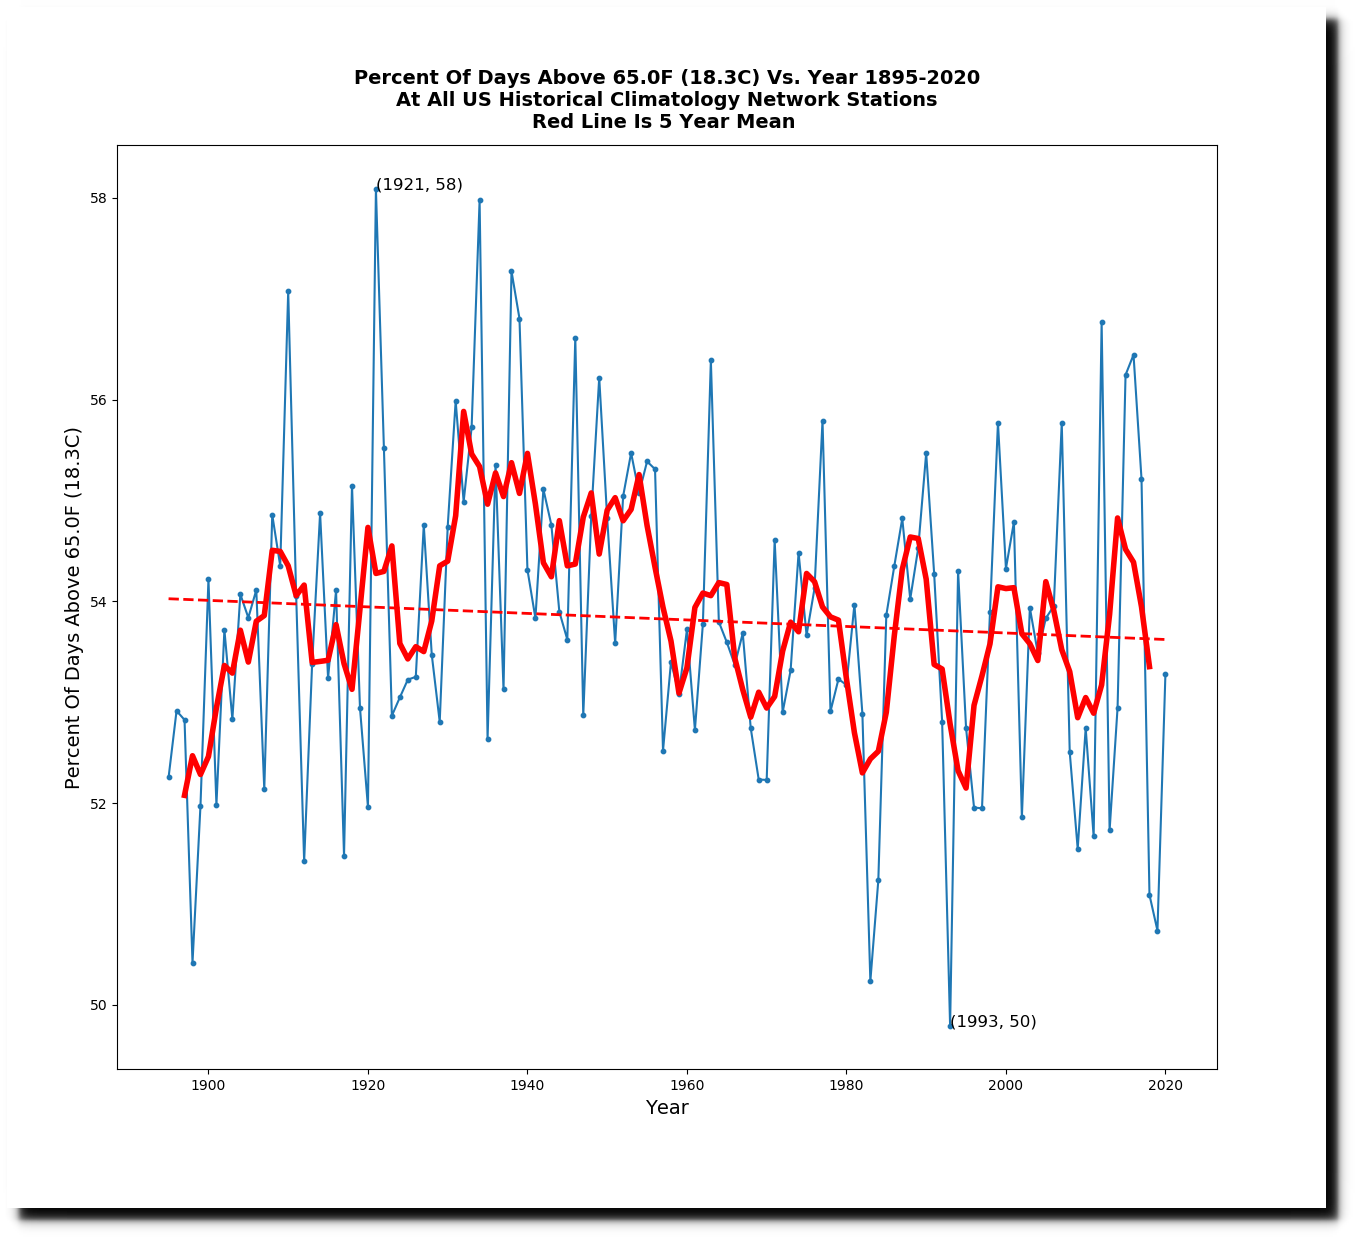
The percent of warm days in the US during 1921 was the highest on record, with 58% of days over 65F.
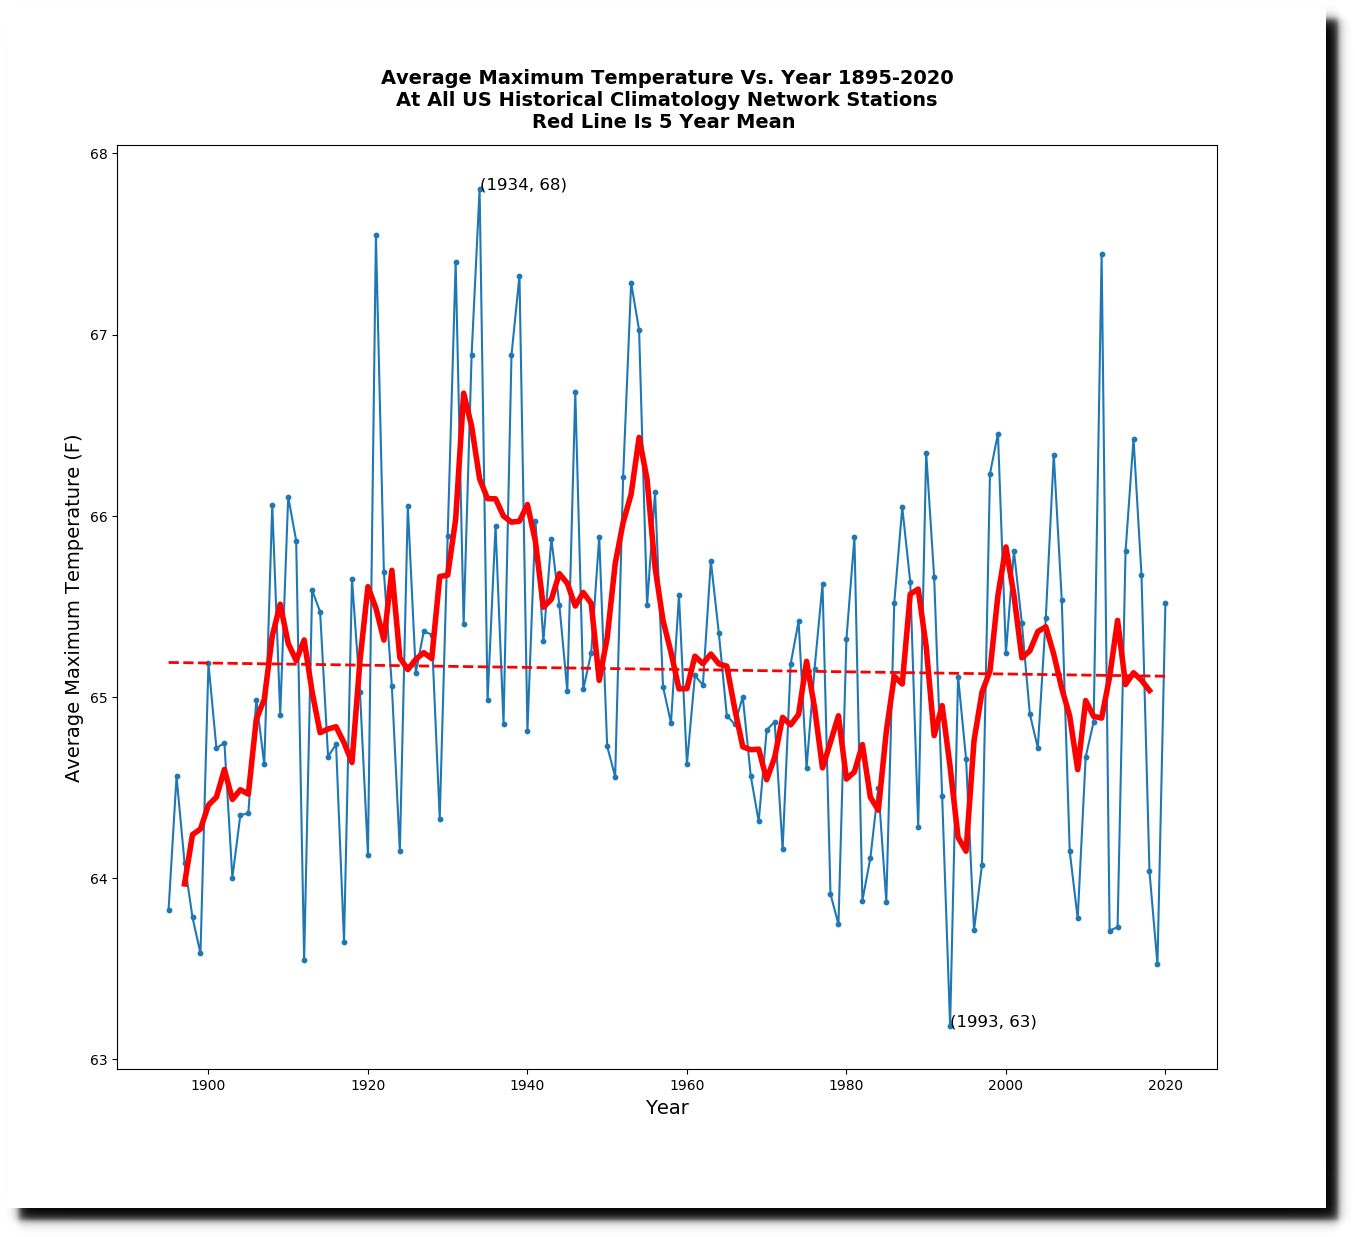
The average daily maximum temperature in the US during 1921 was second highest on record.
There was also lots of extreme weather in 1921.

11 Feb 1921, Page 2 – The Washington Post at Newspapers.com
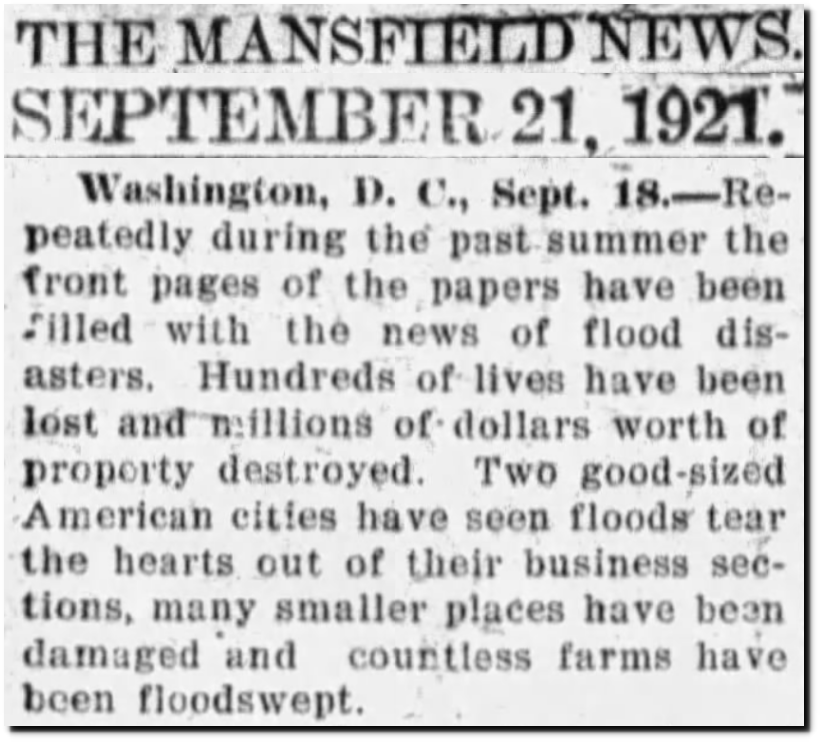
21 Sep 1921, 3 – News-Journal at Newspapers.com
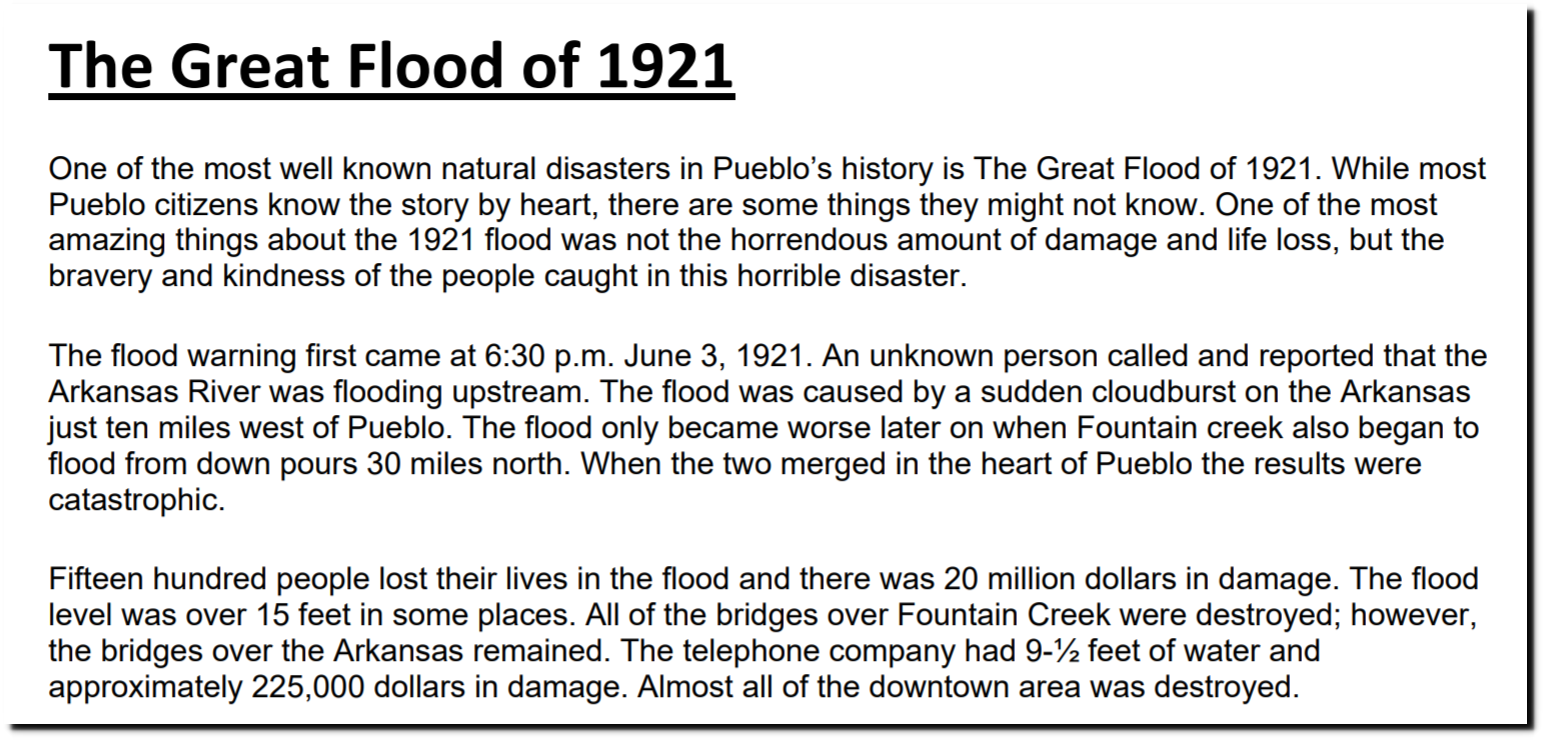
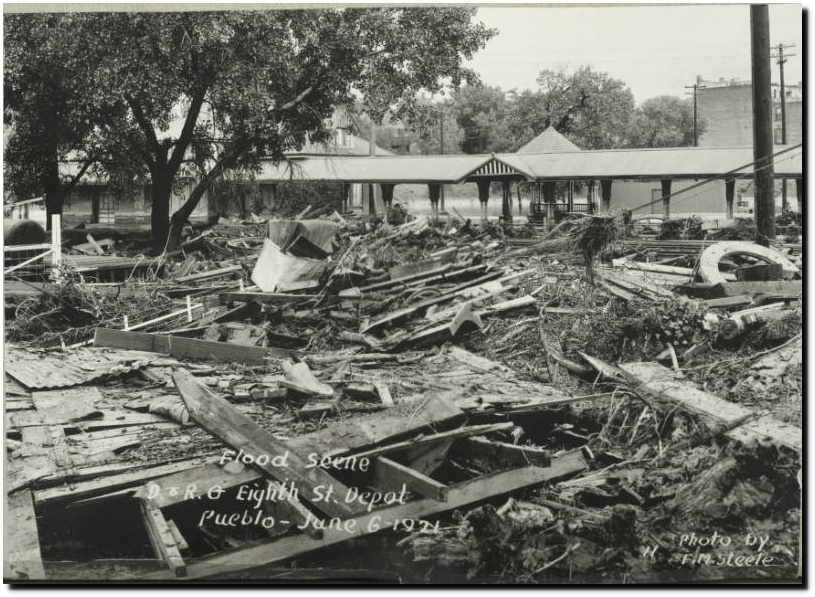
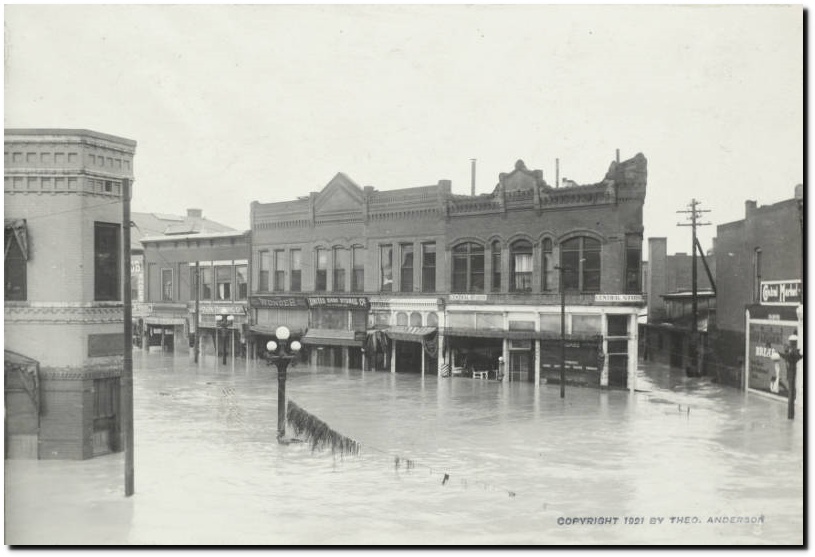
Pueblo, Colorado was largely wiped out by a flood during June, 1921. Much of Kansas suffered damage, and there was flooding on the Pecos River in New Mexico and Texas.
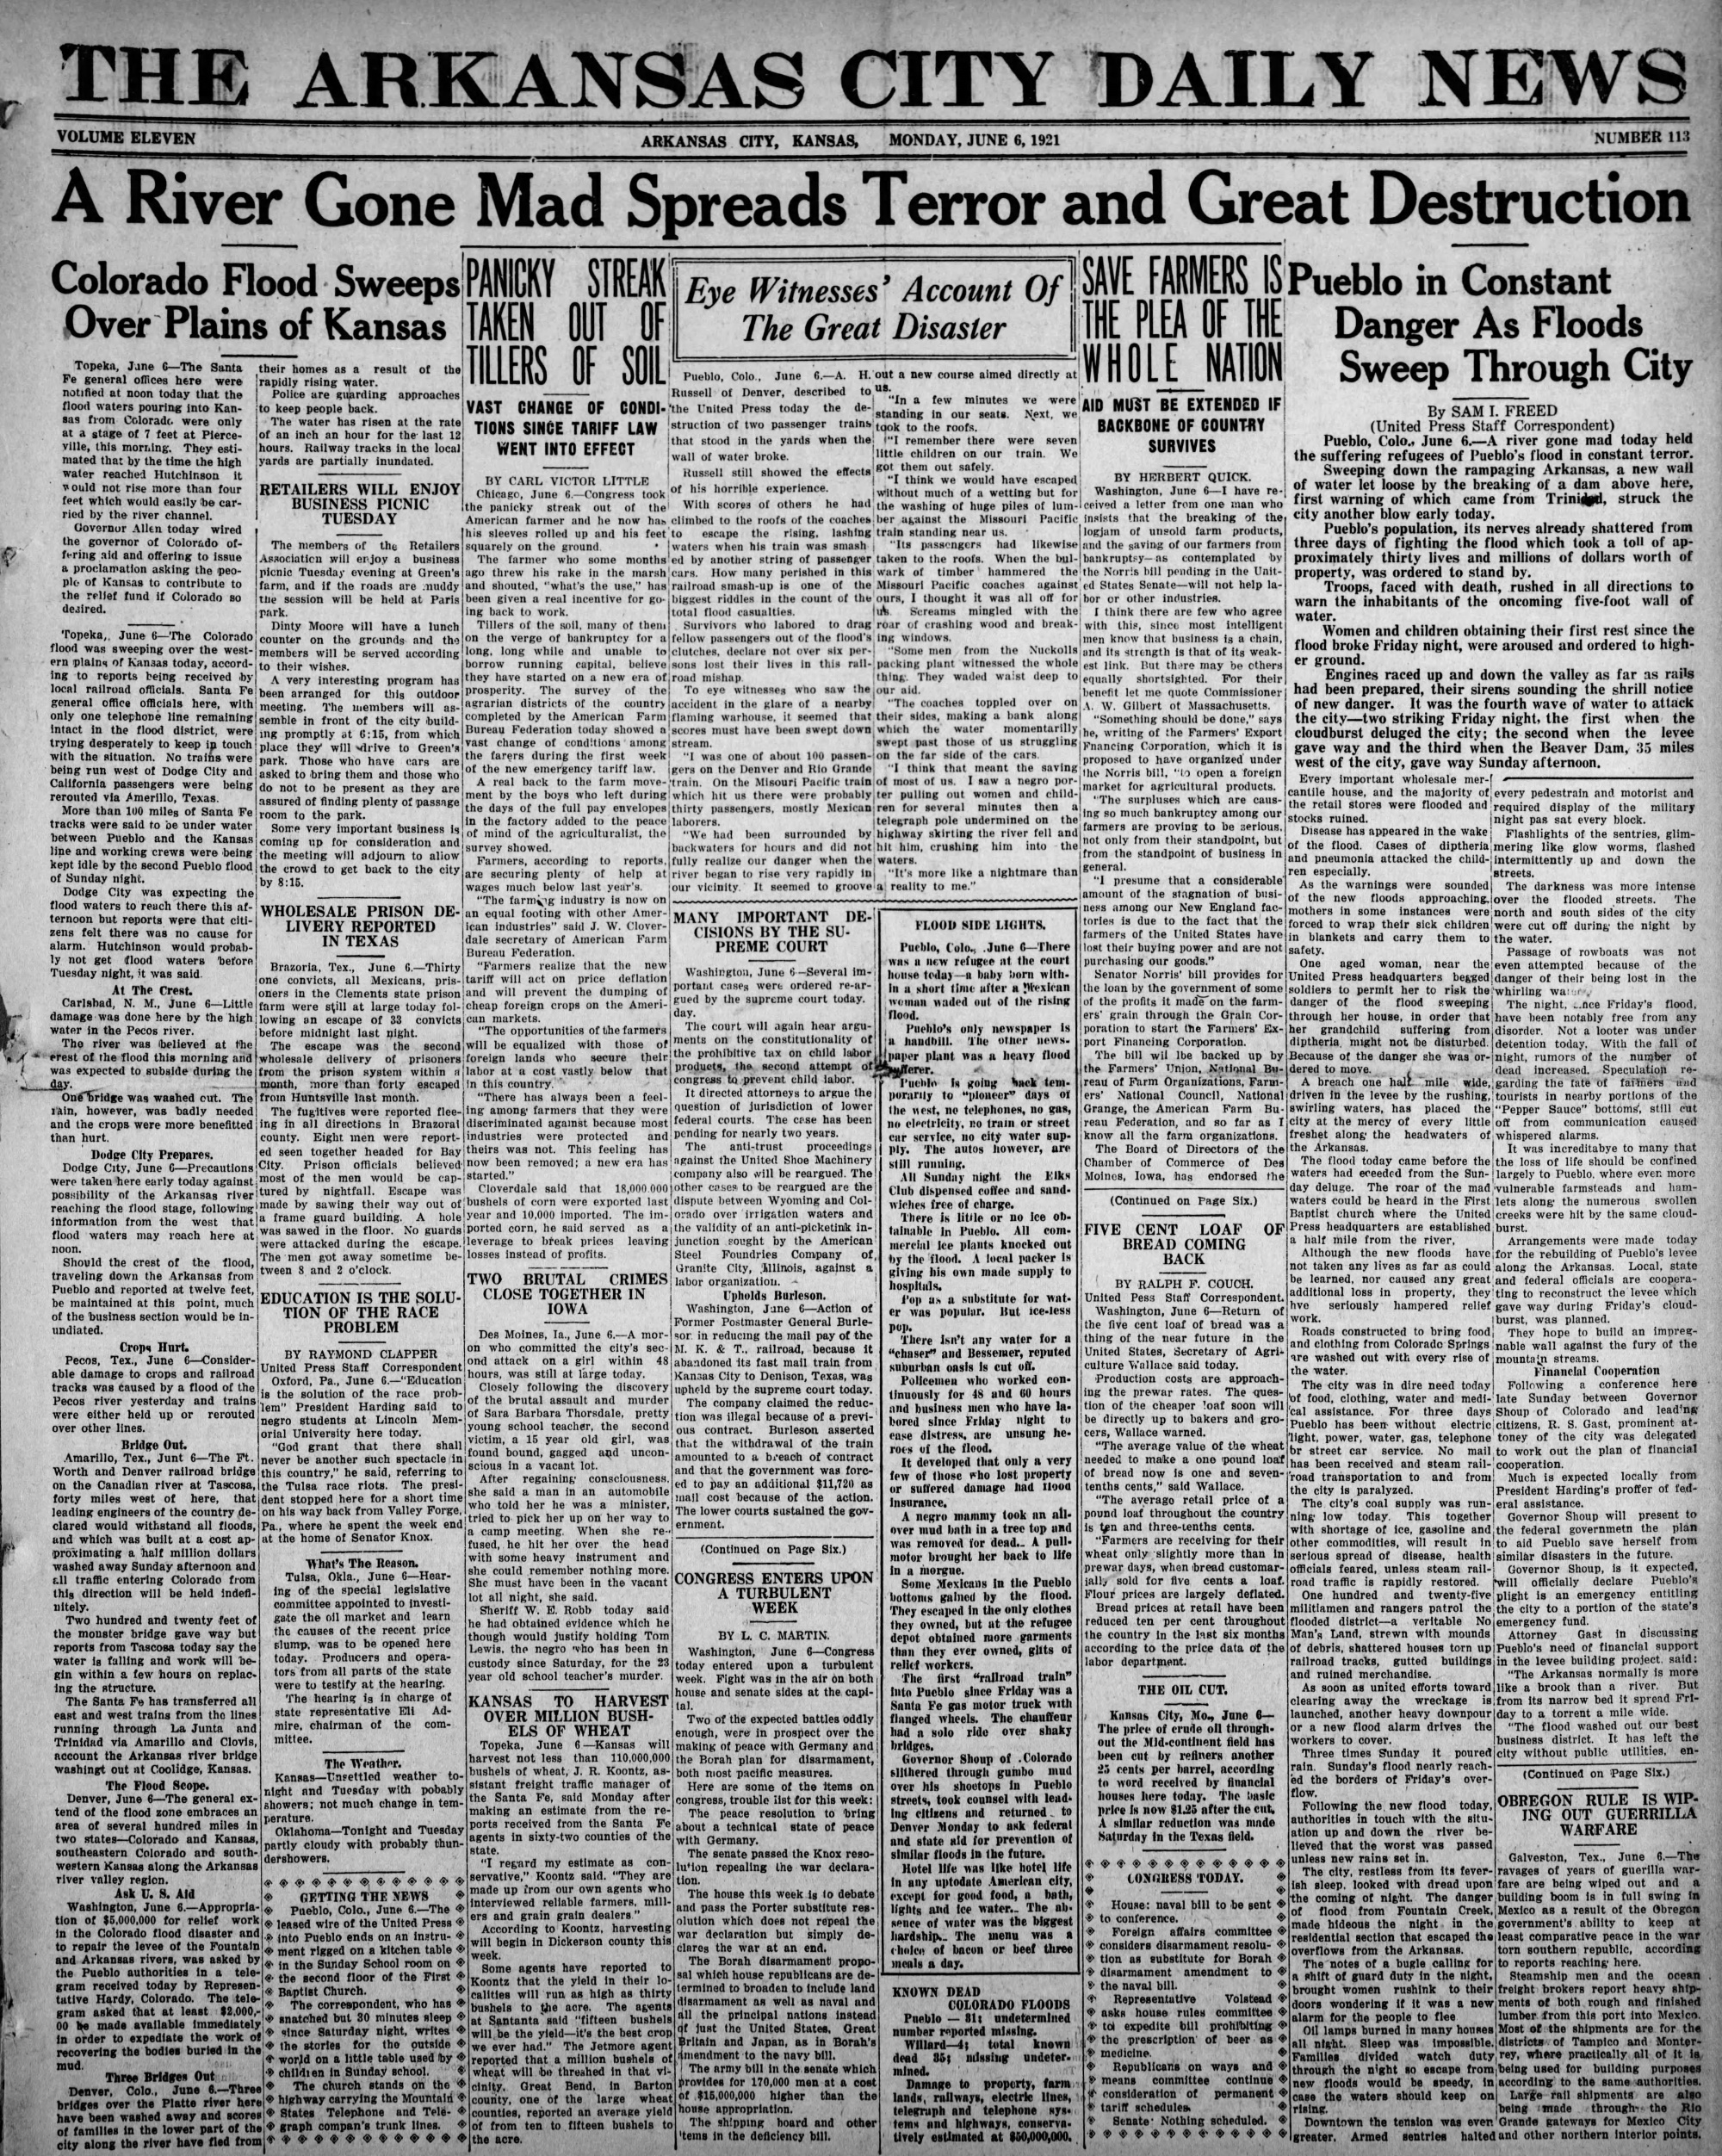
06 Jun 1921, 1 – The Arkansas City Daily News at Newspapers.com
It is estimated that 1,500 people in Pueblo, Colorado died during that flood.

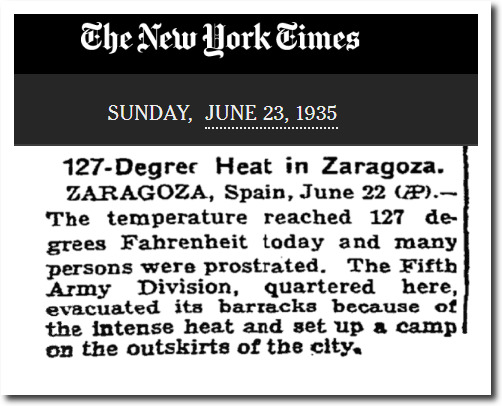 127-Degree Heat in Zaragoza. – The New York Times

17 Dec 1939, Page 15 – Harrisburg Sunday Courier

13 Oct 1940, Page 76 – Hartford Courant at Newspapers.com
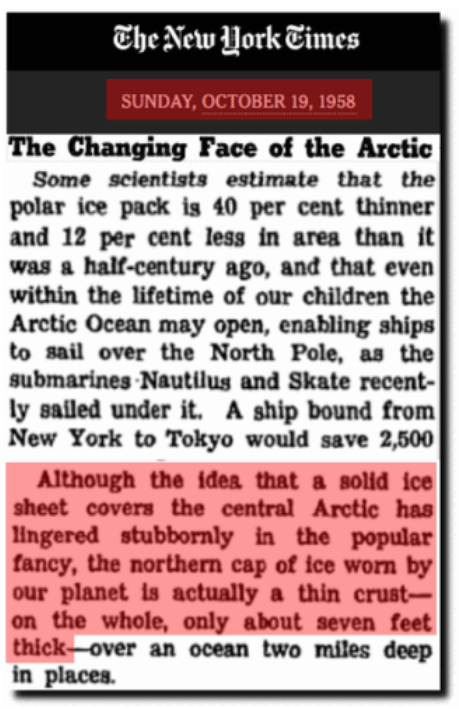
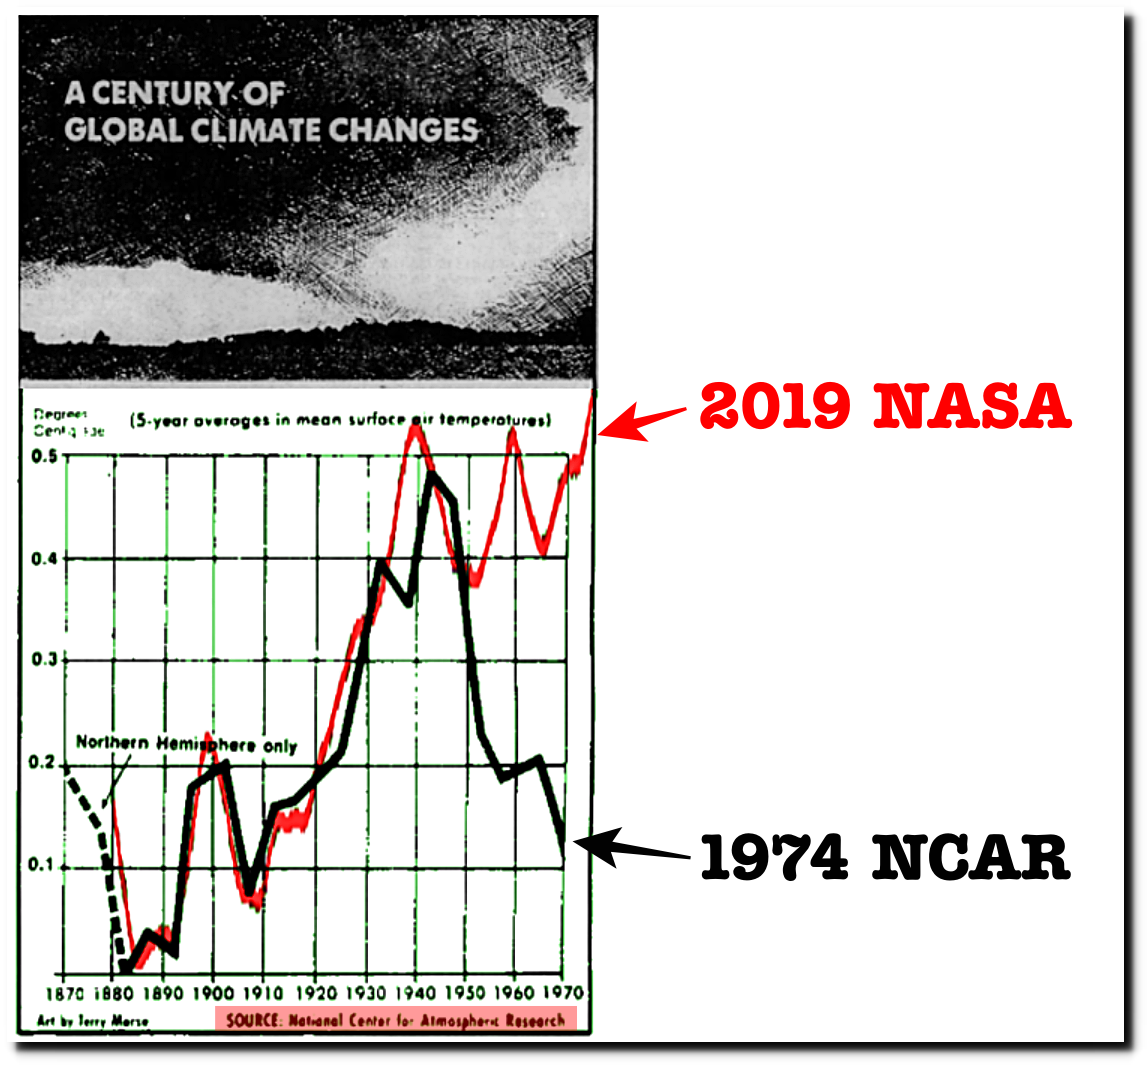
The Changing Face of the Arctic; The Changing Face of the Arctic – The New York Times
14 Jul 1974, Page 1 – Lincoln Evening Journal at Newspapers.com
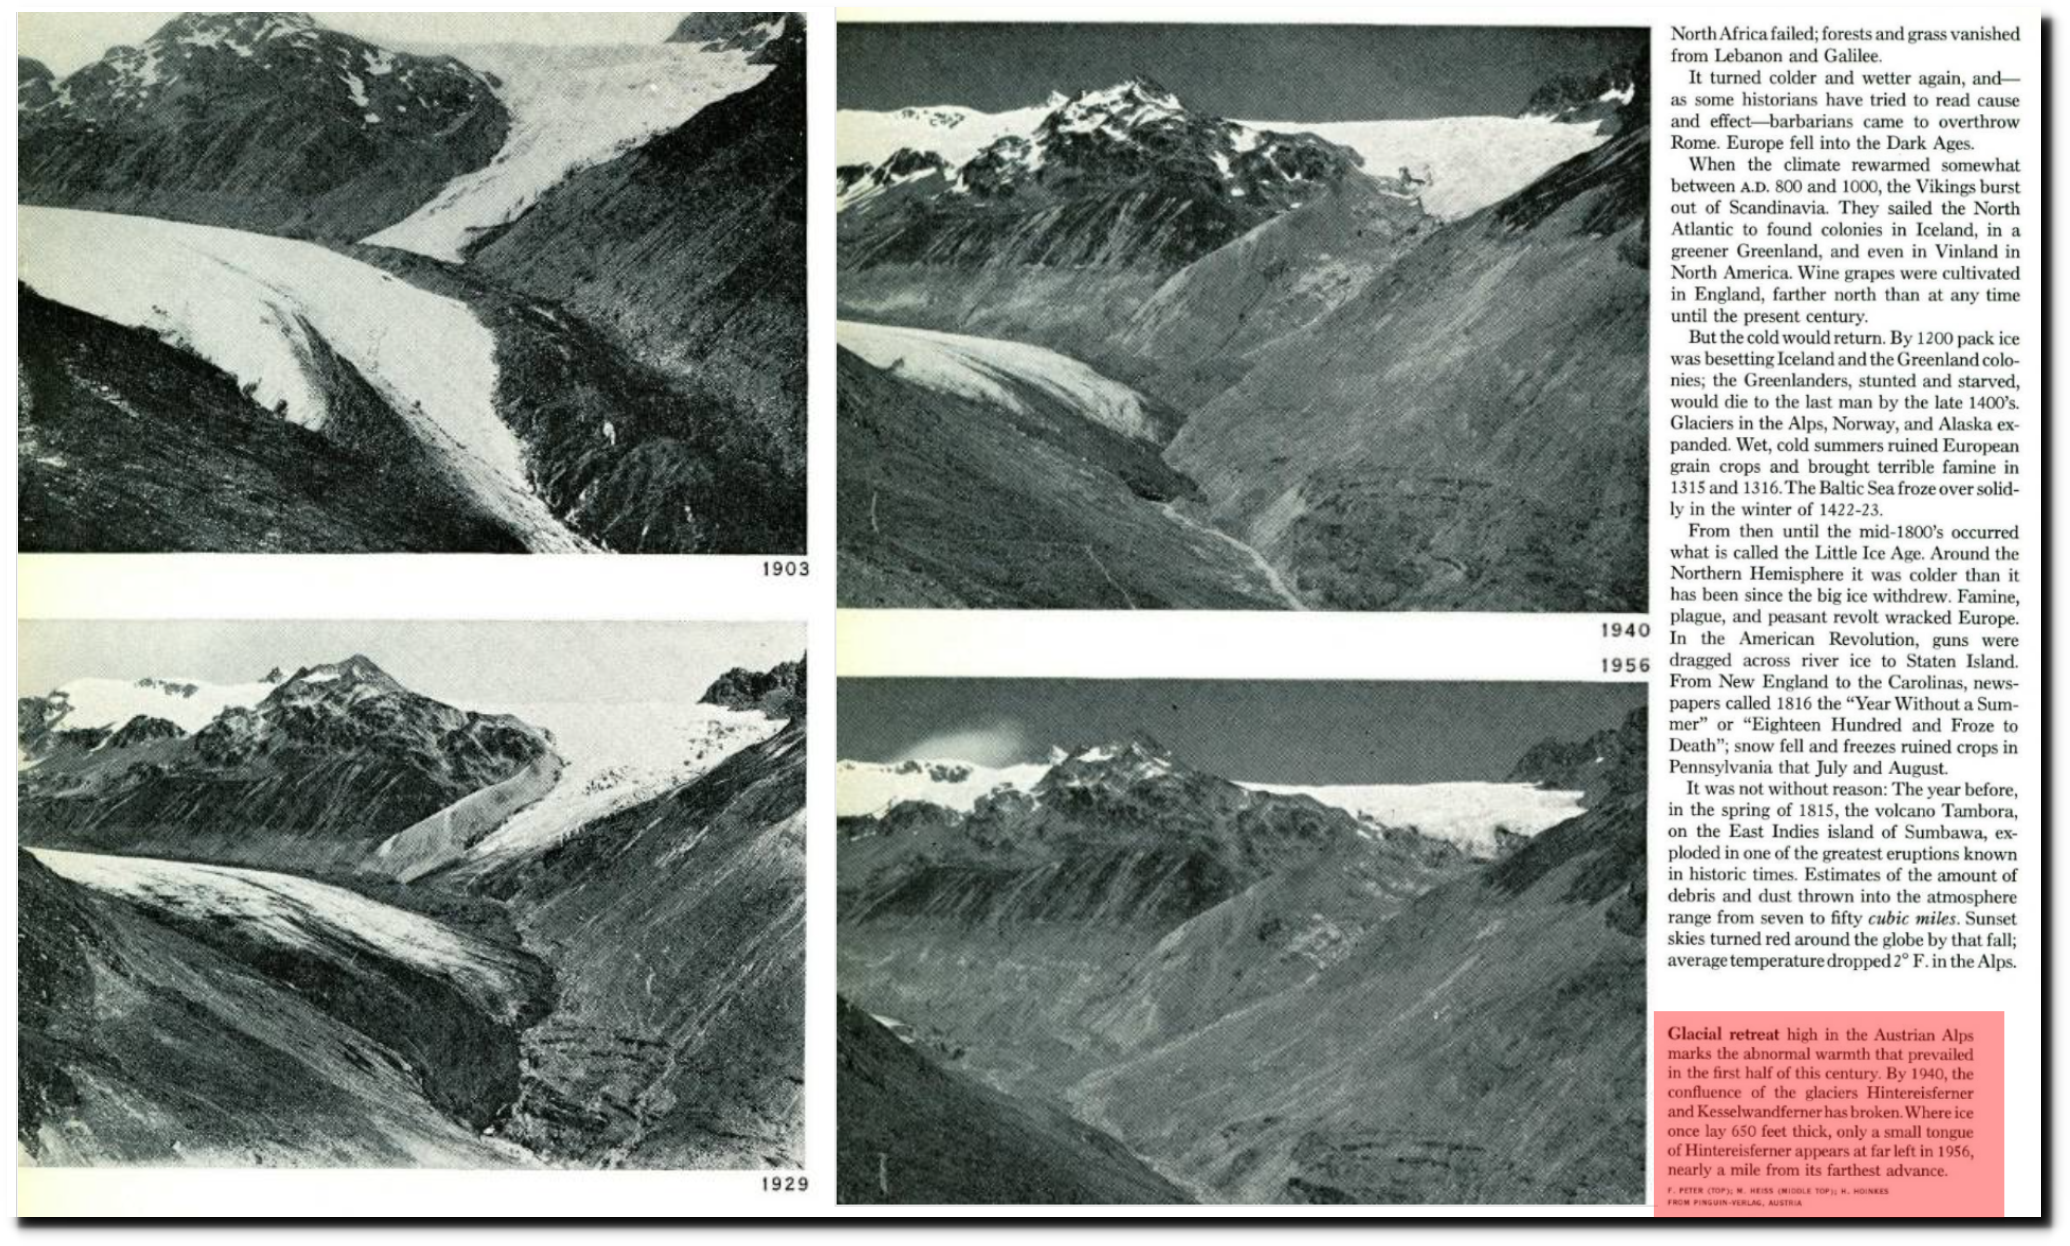
National Geographic Magazine Archive


18 Jul 1963 – Glaciers Grow In Norway – Trove
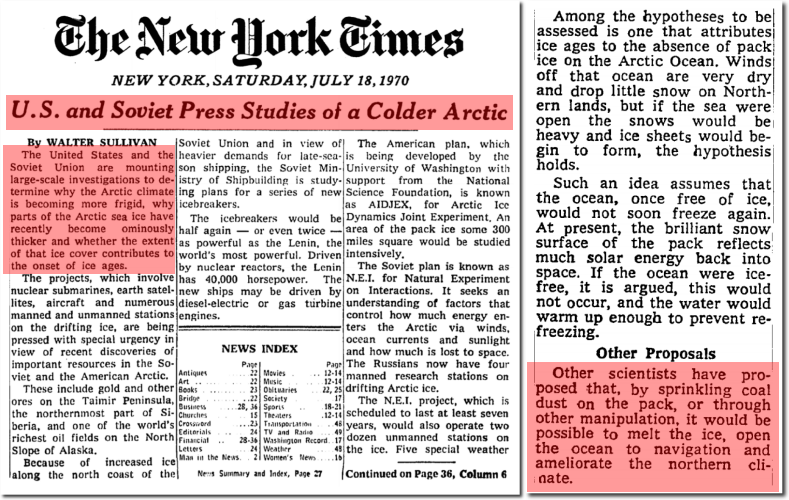
U.S. and Soviet Press Studies of a Colder Arctic – The New York Times
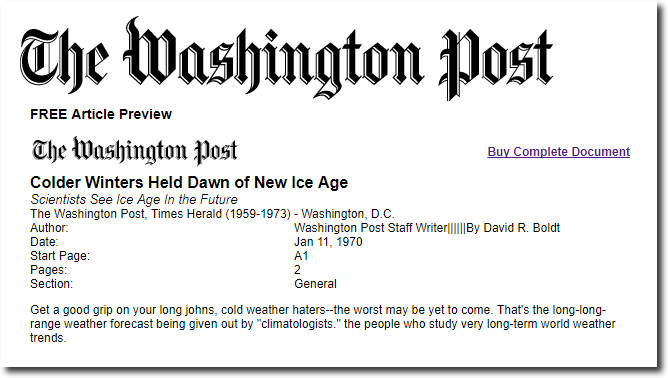
washingtonpost.com – search nation, world, technology and Washington area news archives.
U.S. Scientist Sees New Ice Age Coming
The National Geographic Archive | November 1976 | page 1

Wood for Trees: Interactive Graphs


