GHCN Unadjusted Data Show Zanzibar Has Seen A Cooling Trend Since 1880!

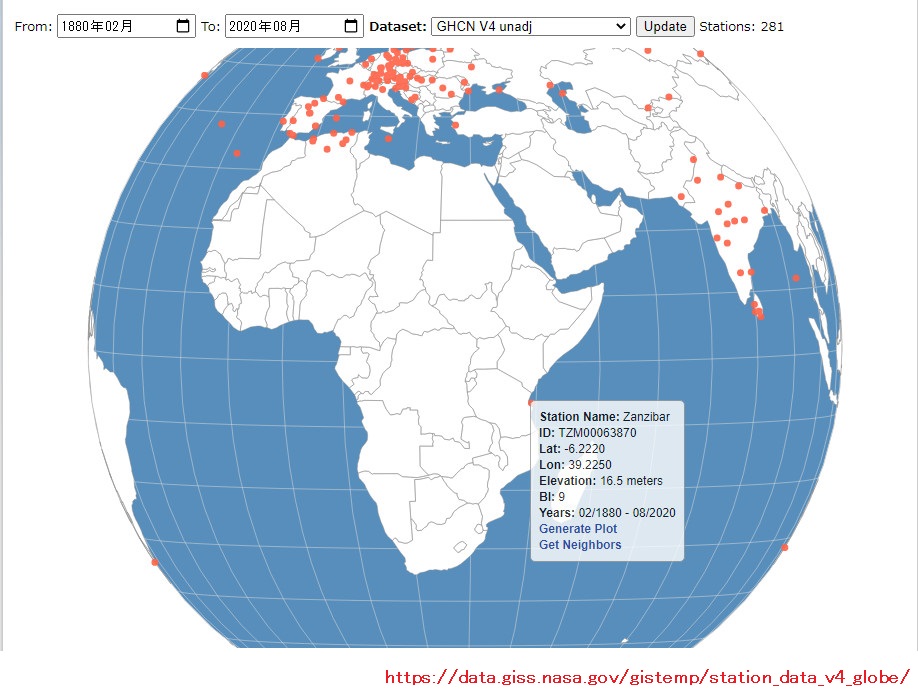
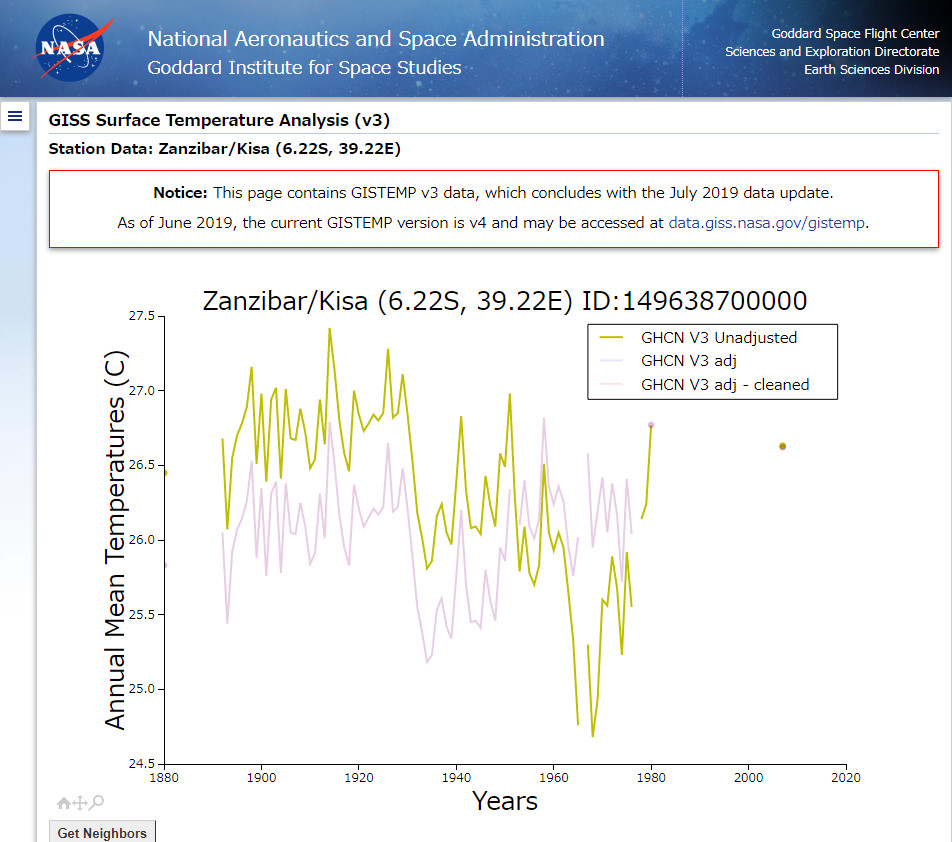
What follows is the data from the Tanzanian Island of Zanzibar in the Indian Ocean.

? Data Source

NASA’s website tells us that the GHCN V3 Unadjusted data gives the mean annual temperature up to 2007, despite the V3 dataset being updated up to July 2019, and the trend is a cooling.

? Data Source

According to NASA, in the GHCN V4 dataset, the station has the mean annual temperature data after 2007, not only the data of up to 2007 from 1880.

? Data Source

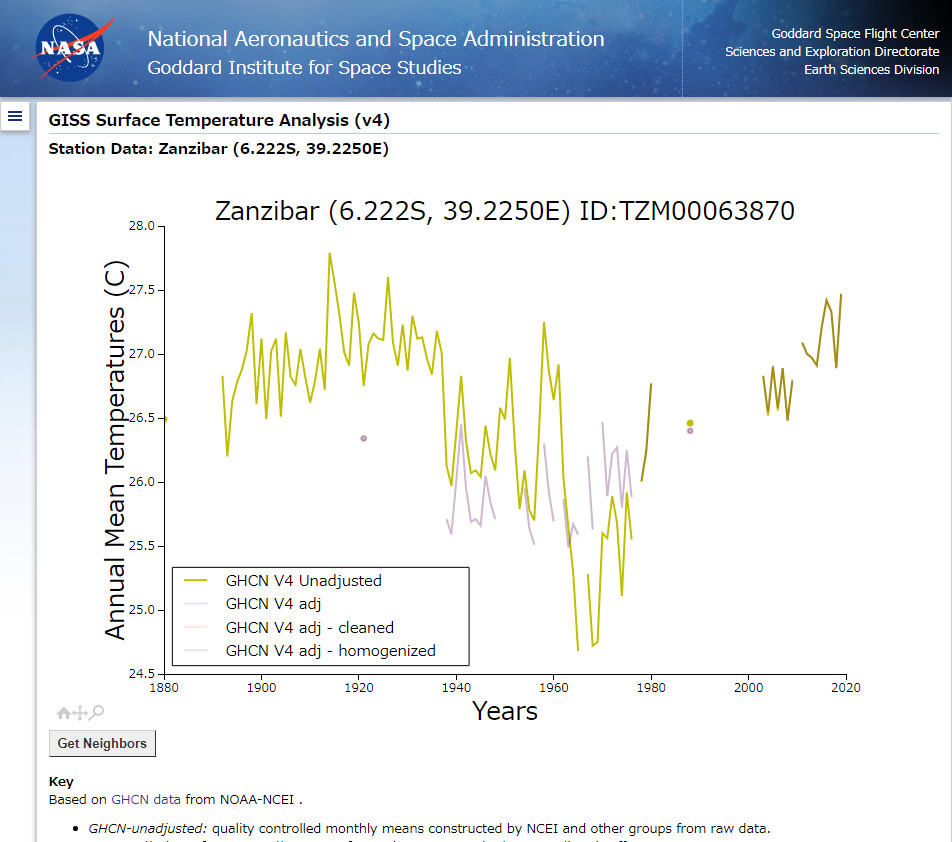
What is worse, the GHCN V4 Unadjusted data show Zanzibar has seen a cooling trend since 1880, but the GHCN V4 adj – homogenized show that the island has had a warming trend.

? GHCN V4 Unadjusted vs. GHCN V4 adj – homogenized

I wonder just how much NASA likes data alteration?

? GHCN V3 Unadjusted vs GHCN V4 Unadjusted

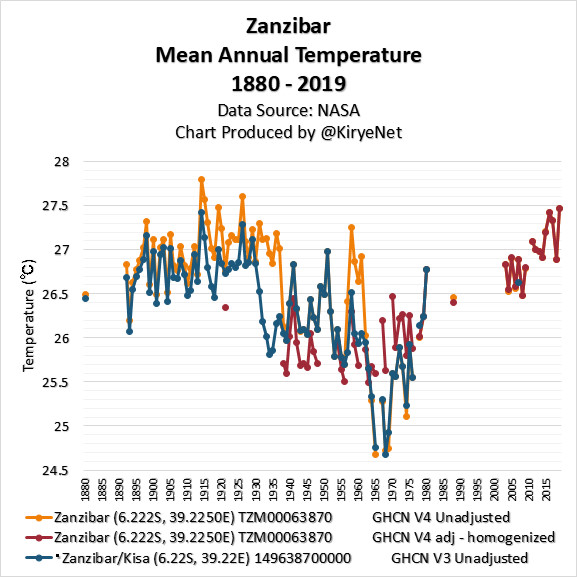
? GHCN V4 Unadjusted vs. GHCN V4 adj – homogenized and GHCN V3 Unadjusted


Posted in Uncategorized | Leave a comment

Listen To The Scientists

Democrats always say “listen to the scientists” – while ignoring what the scientists are actually saying.

Coronavirus: Health experts join global anti-lockdown movement – BBC News

Posted in Uncategorized | Leave a comment

New Video : Supercomputer Mathematics

https://newtube.app/user/TonyHeller/FZHUgUx

Posted in Uncategorized | Leave a comment

New Video : Science Wins – Superstition Loses

https://newtube.app/user/TonyHeller/M3SEDJH

Posted in Uncategorized | Leave a comment

Tokyo Island Of Hachijojima Has Seen No Warming Trend For September Since 1915!

Hachijojima is an island located 287 kilometers from south central Tokyo, and the address is Hachijojima, Tokyo Prefecture.

NASA’s Brightness Index (BI) for the island is 11, so it’s almost rural.

It seems that the island little affected by urban heat island (UHI).

Looking at the data for September from the Japan Meteorological Agency (JMA), Hachijojima has seen no warming trend for September since 1915.

The warmest September was 1999 with 26.7?, not this September.

If you are interested in the mean annual temperature chart, you can see it here with summer and winter charts.

Many Japanese people don’t know that Hachijojima has a long period with no warming trend because the Japanese media are not good.


Posted in Uncategorized | Leave a comment

New Video : The New Normal


NewTube Link

Posted in Uncategorized | Leave a comment

New Video : Statistics Of Fear

Posted in Uncategorized | Leave a comment

East Ongul Island In Antarctica Has Had A Cooling Trend For September Since 1960

Today, I made the chart below using the data from the Japan Meteorological Agency(JMA).

? Data Source

As you can see, Syowa Station, which is a Japanese research station, East Ongul Island in Antarctica, has shown a cooling trend for September since 1960.

The mean monthly temperature for last month was -18.2?. The mildest September was 1996 with -11.8?.

The September data since 1960 at that location clearly show the exact opposite of alarmist expectations.

Posted in Uncategorized | Leave a comment

New Video : Alterations To The US Temperature Record (Part One)

NewTube Link

Posted in Uncategorized | Leave a comment

Tokyo Has Had No Warming Trend Since 1994 For September

The day before yesterday was the end of September, so I made this chart.

? Data Source

I’m sure many people in Tokyo believe the city is getting hotter every year because Japanese citizens often see TV commercials promoting man-made global warming.

However, there has been no warming trend since 1994 for September.

Now including the data for 2020 so far, the capital city of Japan has not experienced a warming trend since the end of the 1990s up to now, neither in spring nor summer.

Even if you look at the autumn data until 2019, there has been no warming trend since 1989.

When November finishes, I will update the autumn chart.

Posted in Uncategorized | Leave a comment