
The world faces some important deadlines. If we don’t stop global warming by the year 2000, entire nations will be wiped off the face of the earth.
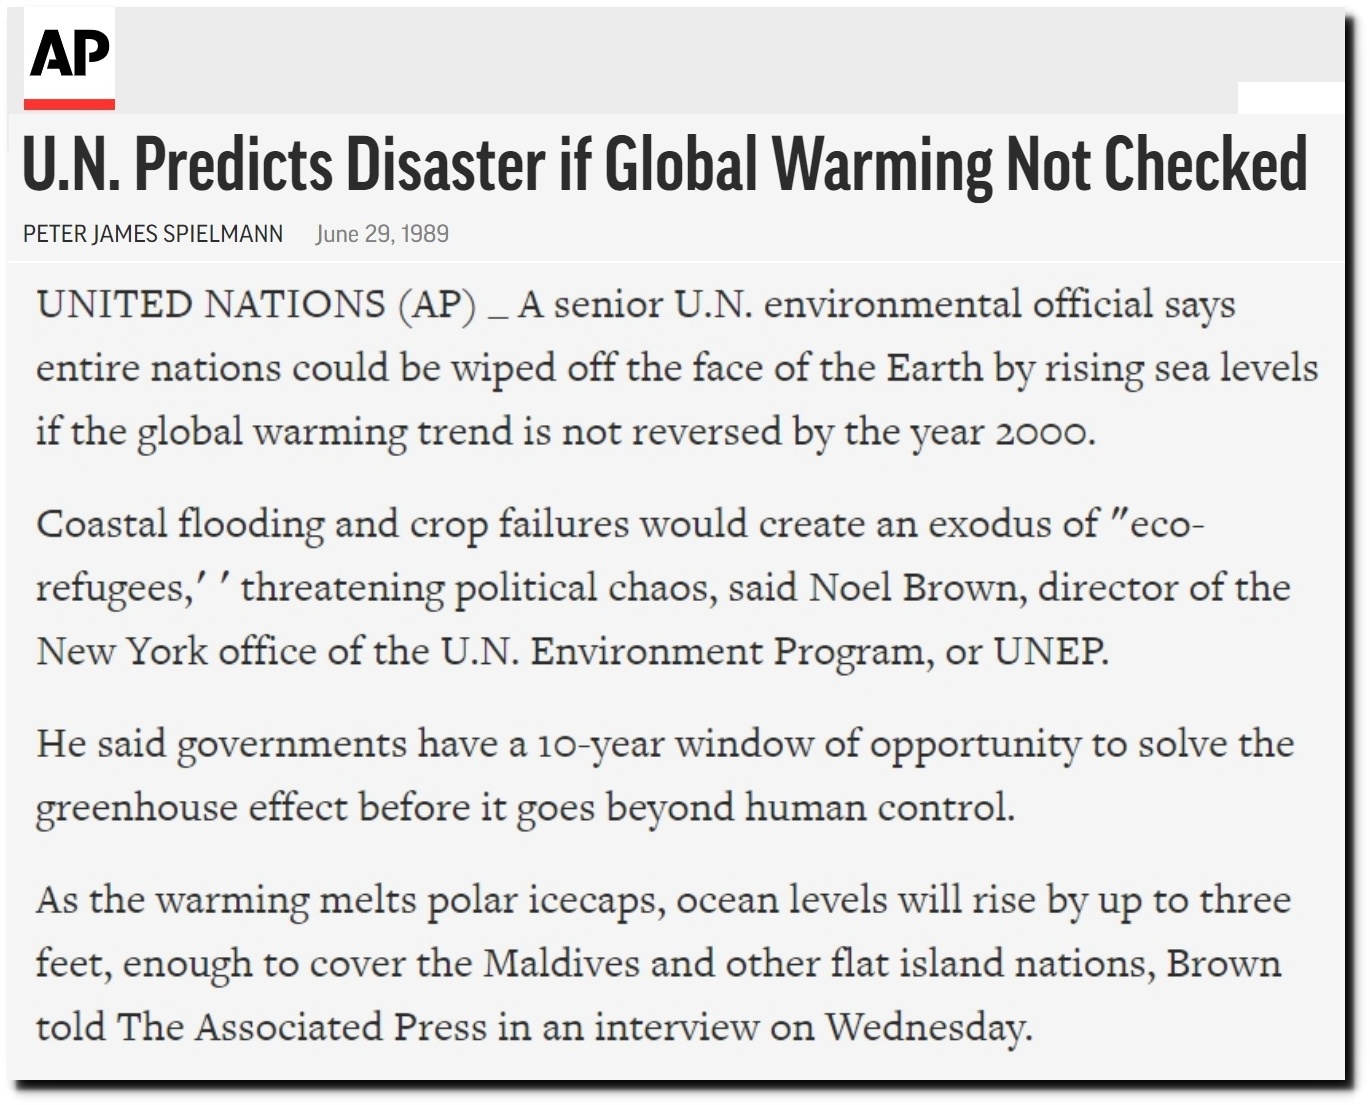
U.N. Predicts Disaster if Global Warming Not Checked
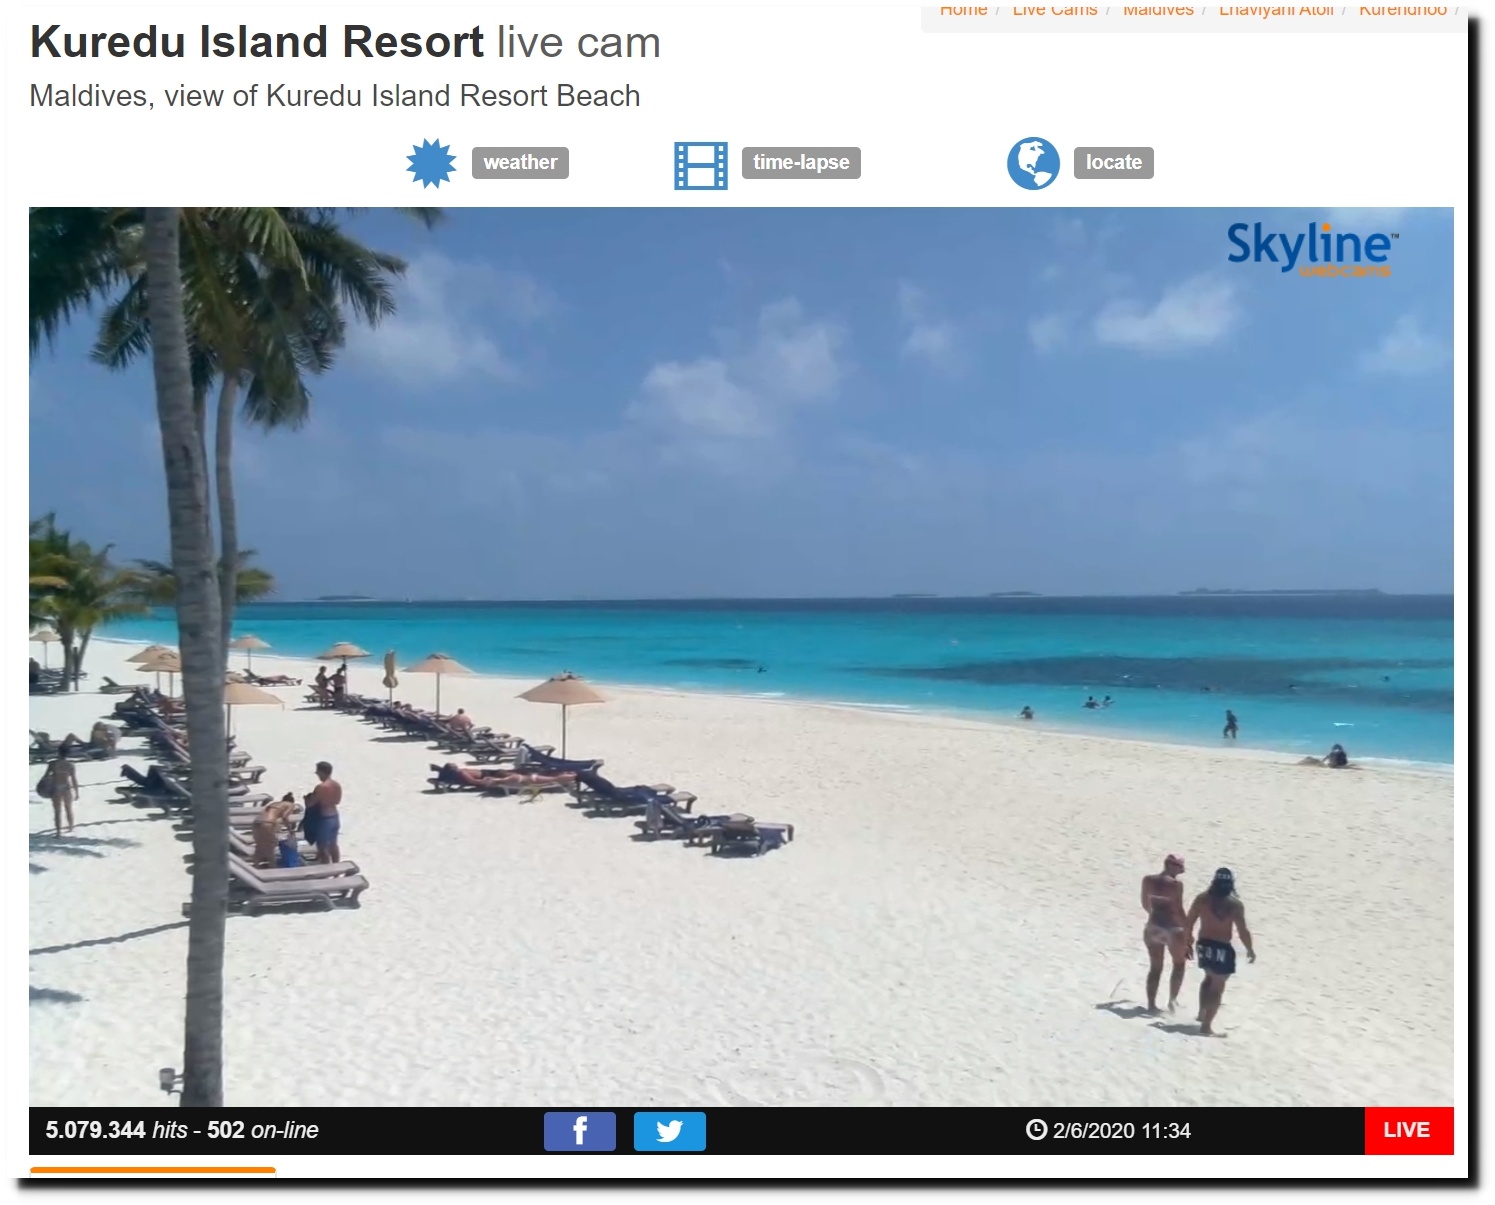
The Maldives will drown no later than 2018.
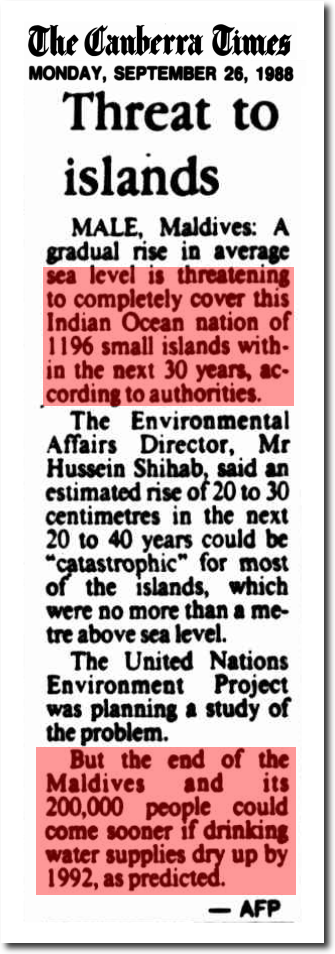
26 Sep 1988 – Threat to islands
The Arctic will be ice-free by 2018.

The Argus-Press – Google News Archive Search
Lower Manhattan will also be underwater by 2018.
Stormy weather – Global warming – Salon.com
The Arctic will also be ice-free by 2014.
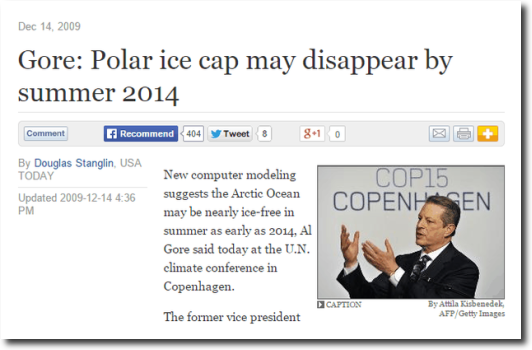
Gore: Polar ice cap may disappear by summer 2014
If we don’t stop global warming by the year 2020, entire nations will be wiped off the face of the Earth.
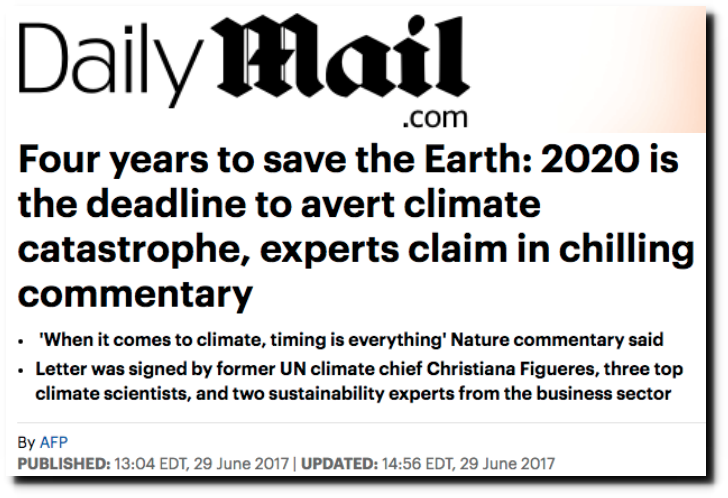 2020 is the deadline to avert climate catastrophe | Daily Mail Online
Britain will have Siberian climate by the year 2020.
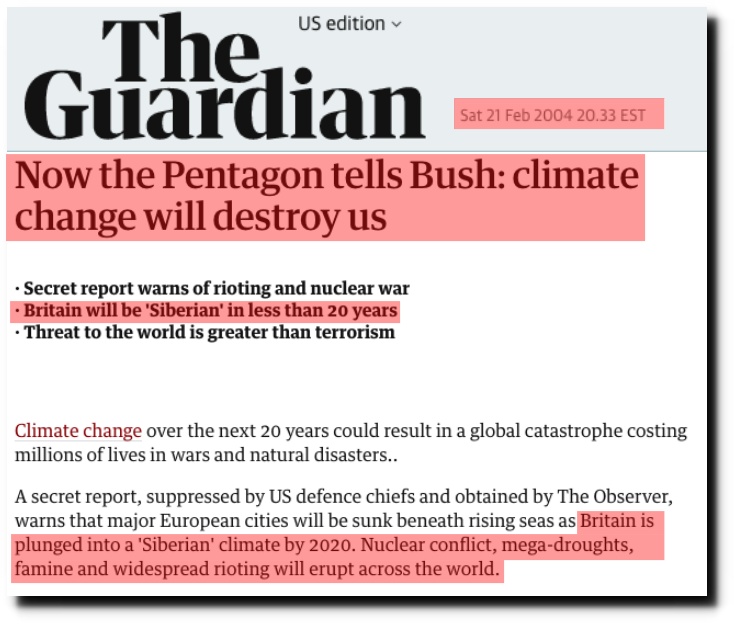
Pentagon tells Bush: climate change will destroy us | Environment | The Guardian
Britain has been in permanent drought for eight years.
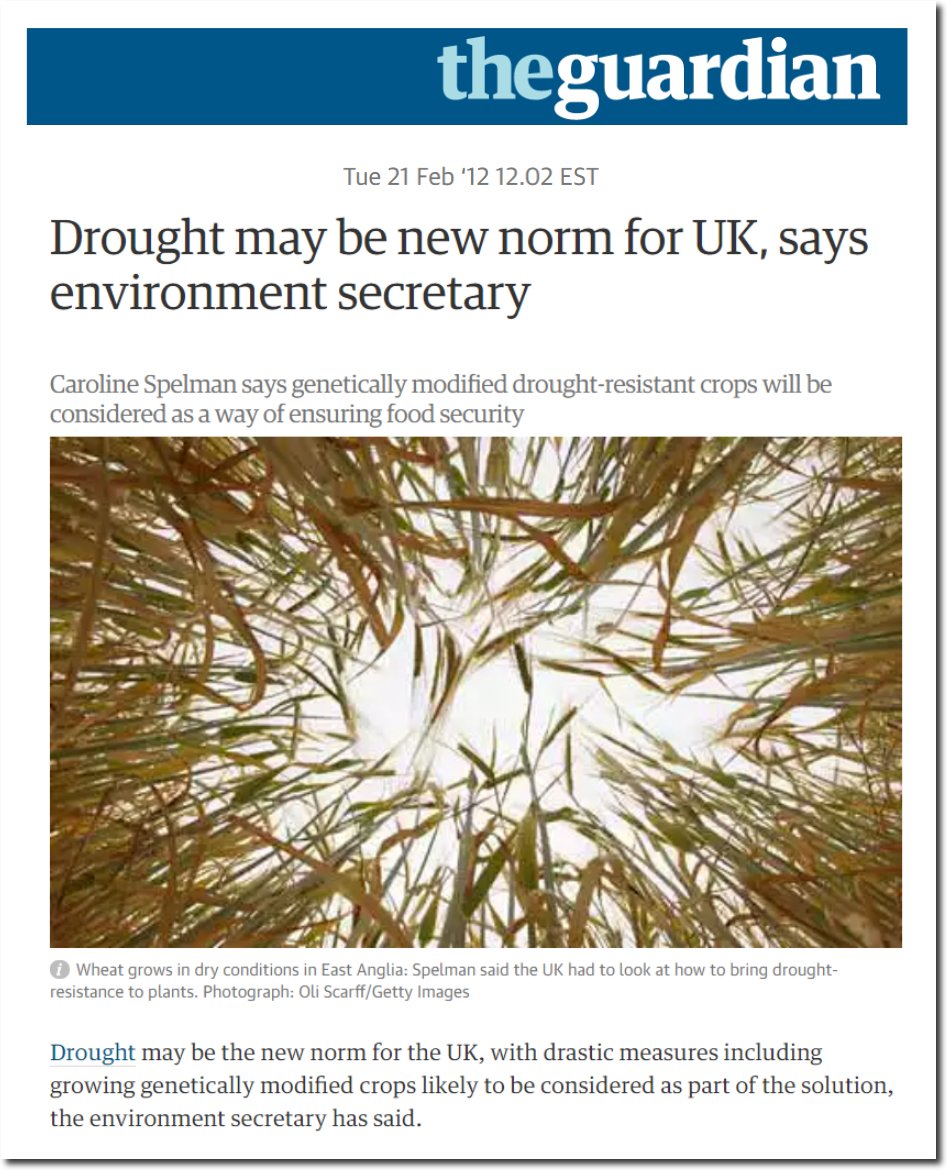
Drought may be new norm for UK, says environment secretary | Environment | The Guardian
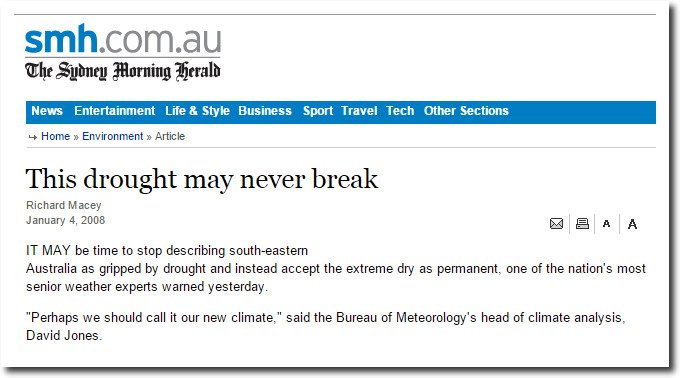
Australia has been in permanent drought for twelve years.
And snowfalls ended twenty years ago.
Snowfalls are now just a thing of the past – Environment – The Independent
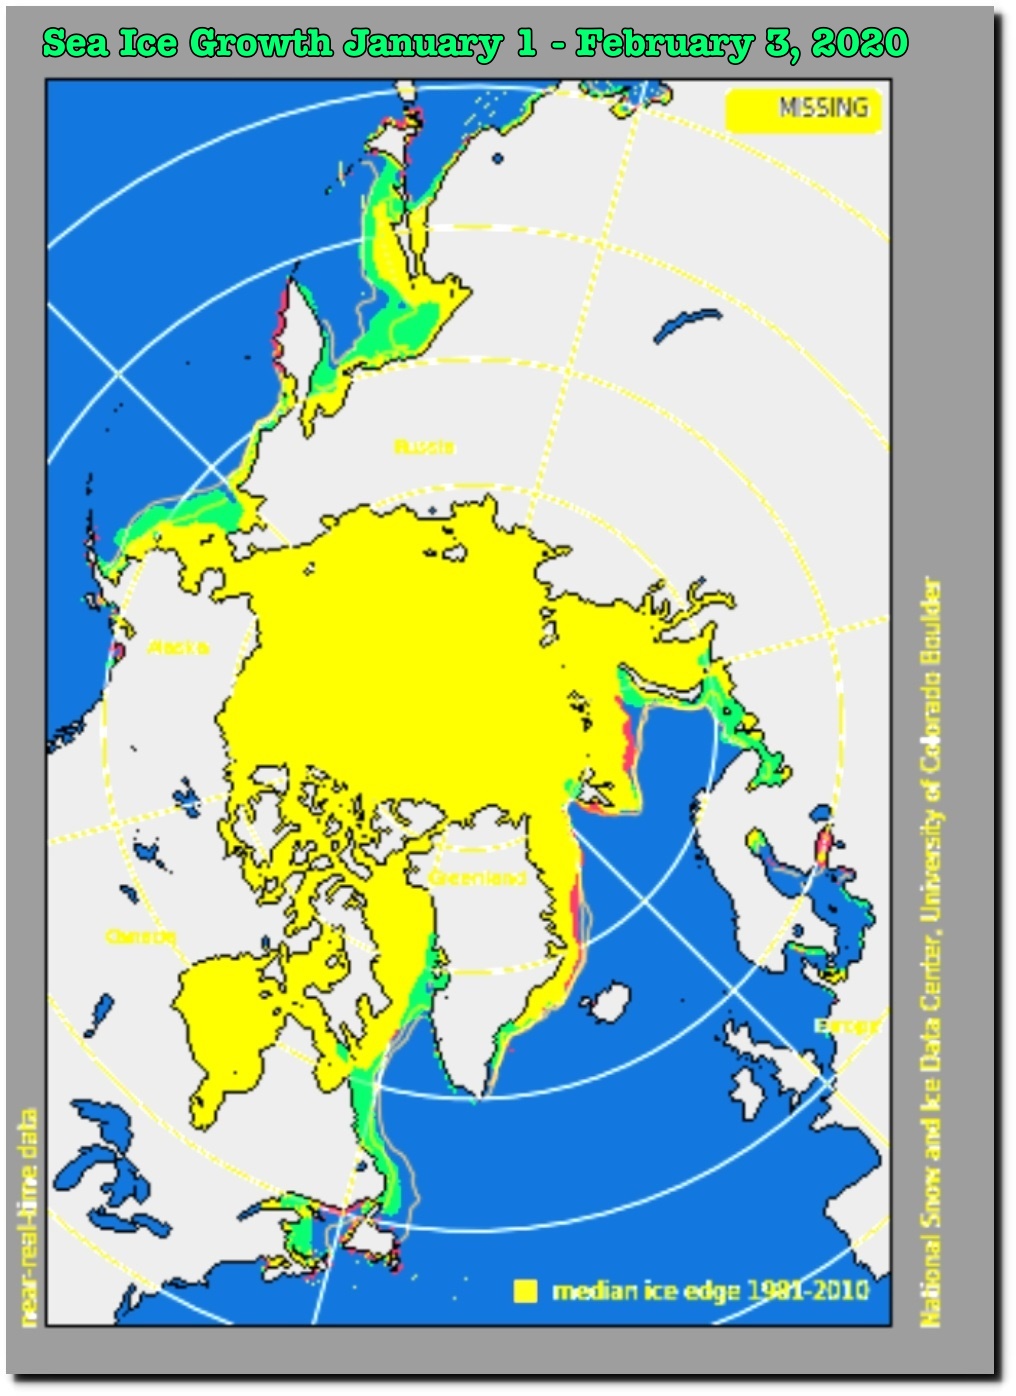
Despite the fact that the world ended twenty years ago, government agencies are still cranking out climate data. Arctic sea ice extent is normal, and the highest in many years.
Charctic Interactive Sea Ice Graph | Arctic Sea Ice News and Analysis
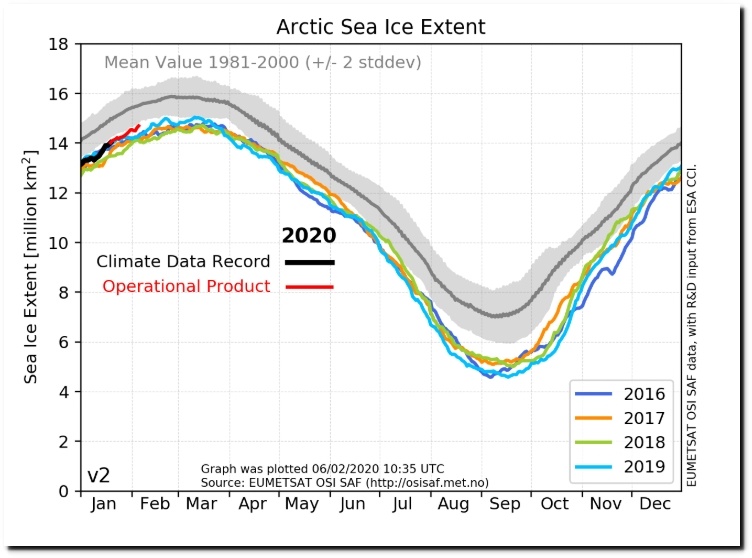
Ocean and Ice Services | Danmarks Meteorologiske Institut
Arctic winter temperatures have dropped about 5C since 2016. Summer temperatures have been running consistently below normal.
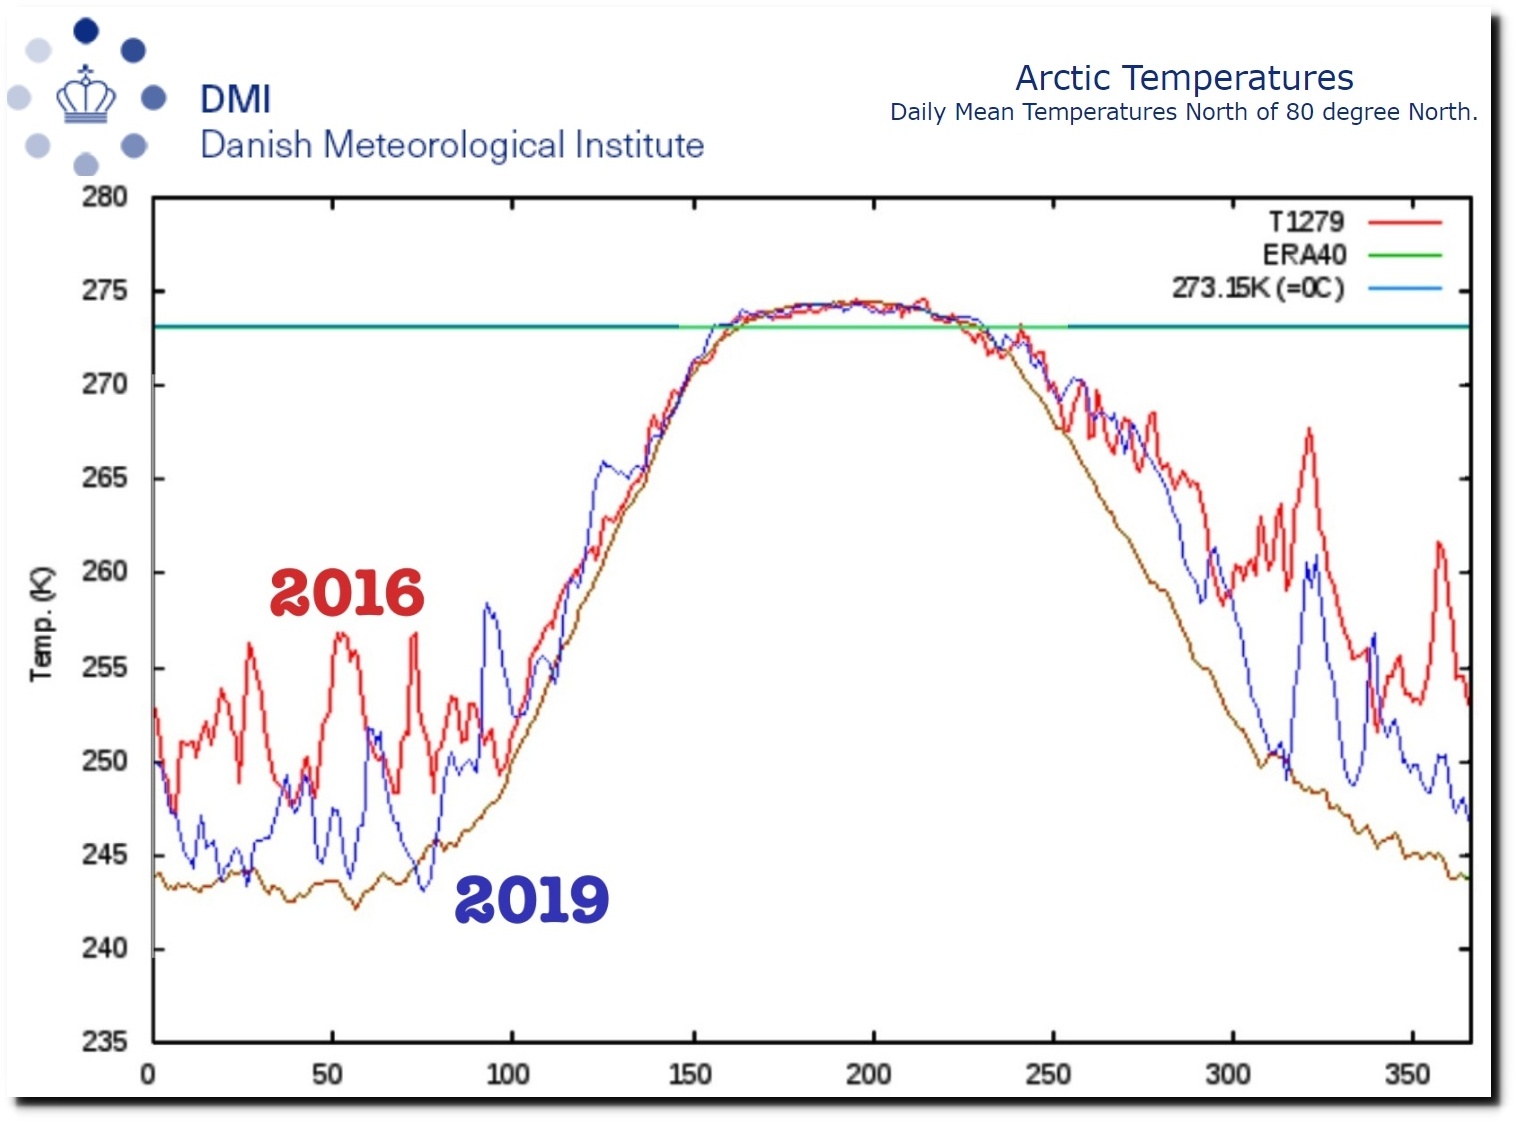
Ocean and Ice Services | Danmarks Meteorologiske Institut
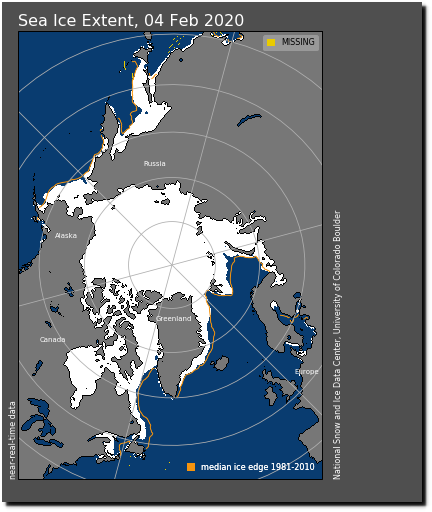
NOAA/G02135/north/daily/images/2020/02_Feb/N_20200204_extn_v3.0.png
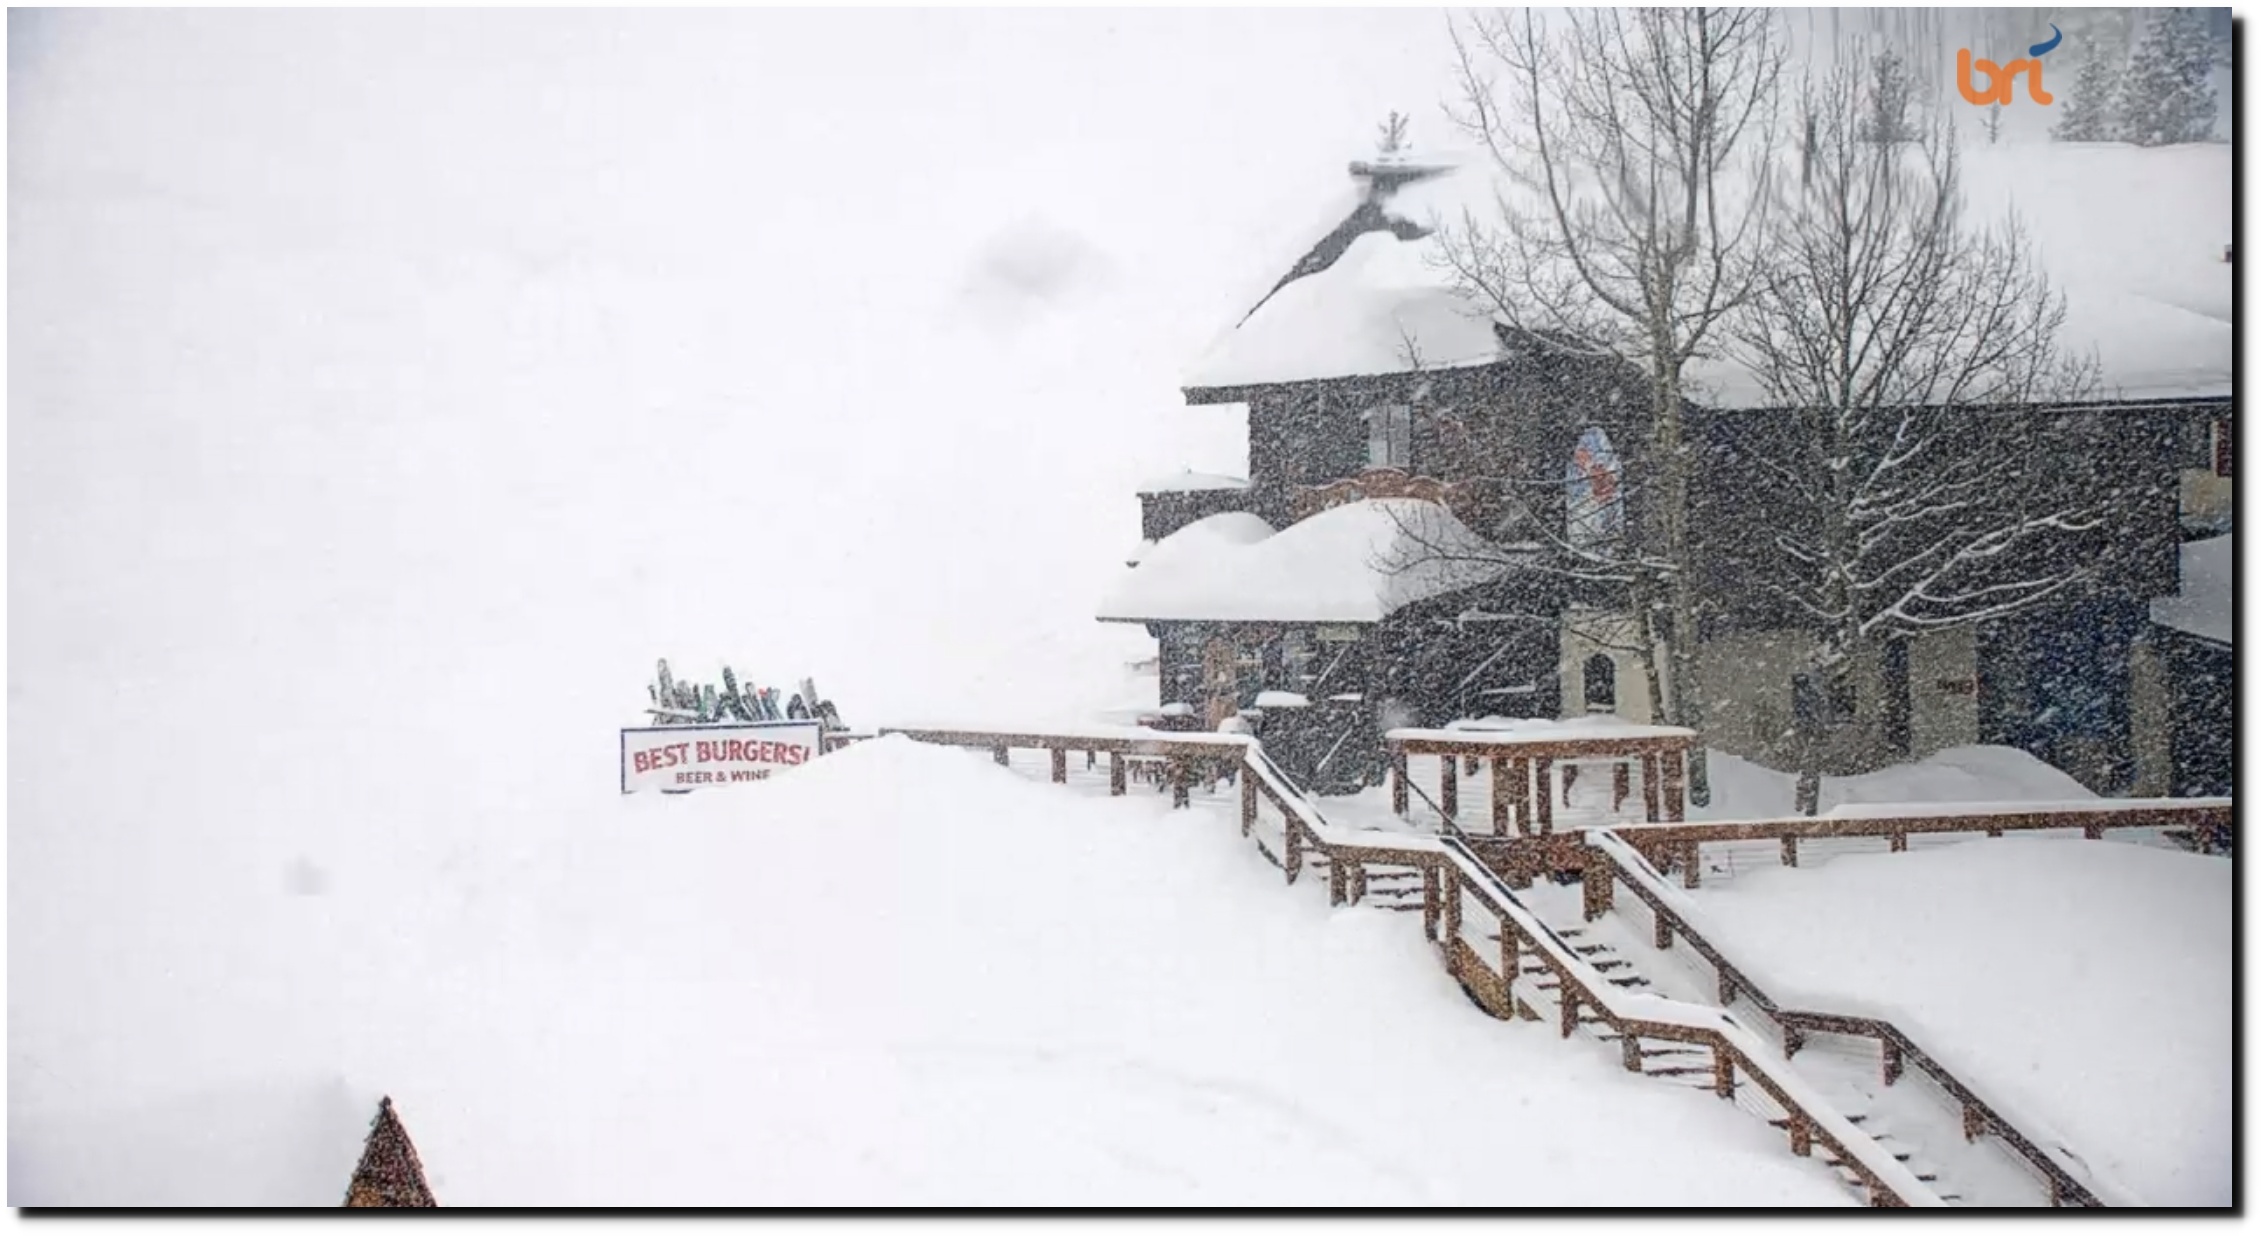
We are getting record snowfall, year after year.

This is what Taos, New Mexico looked like yesterday.
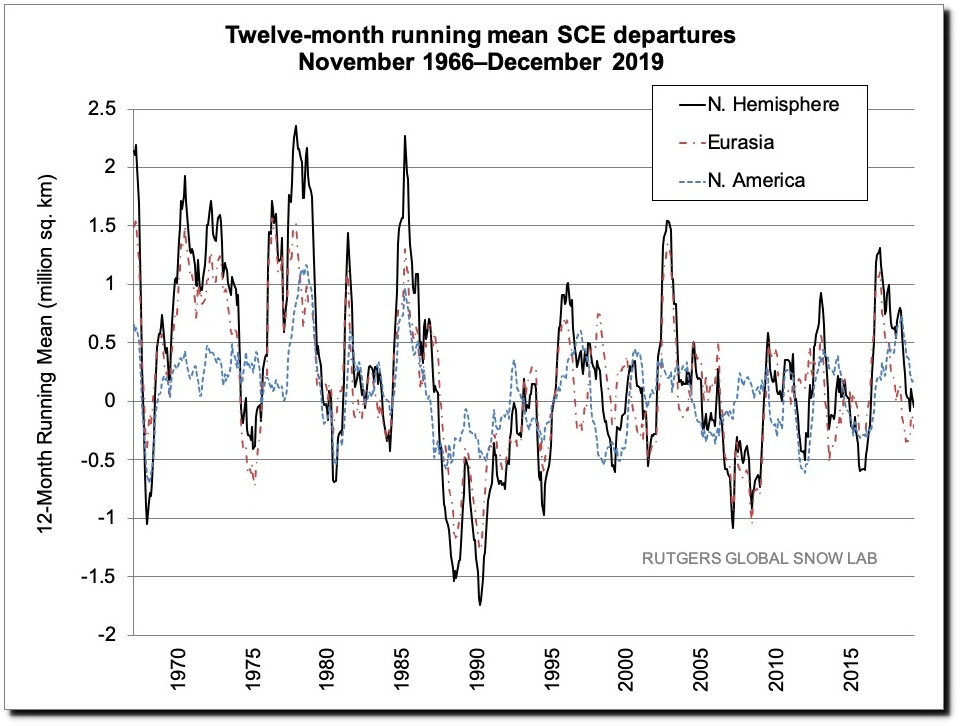
Snow extent during the snow season has been increasing to record levels for the past 50 years.
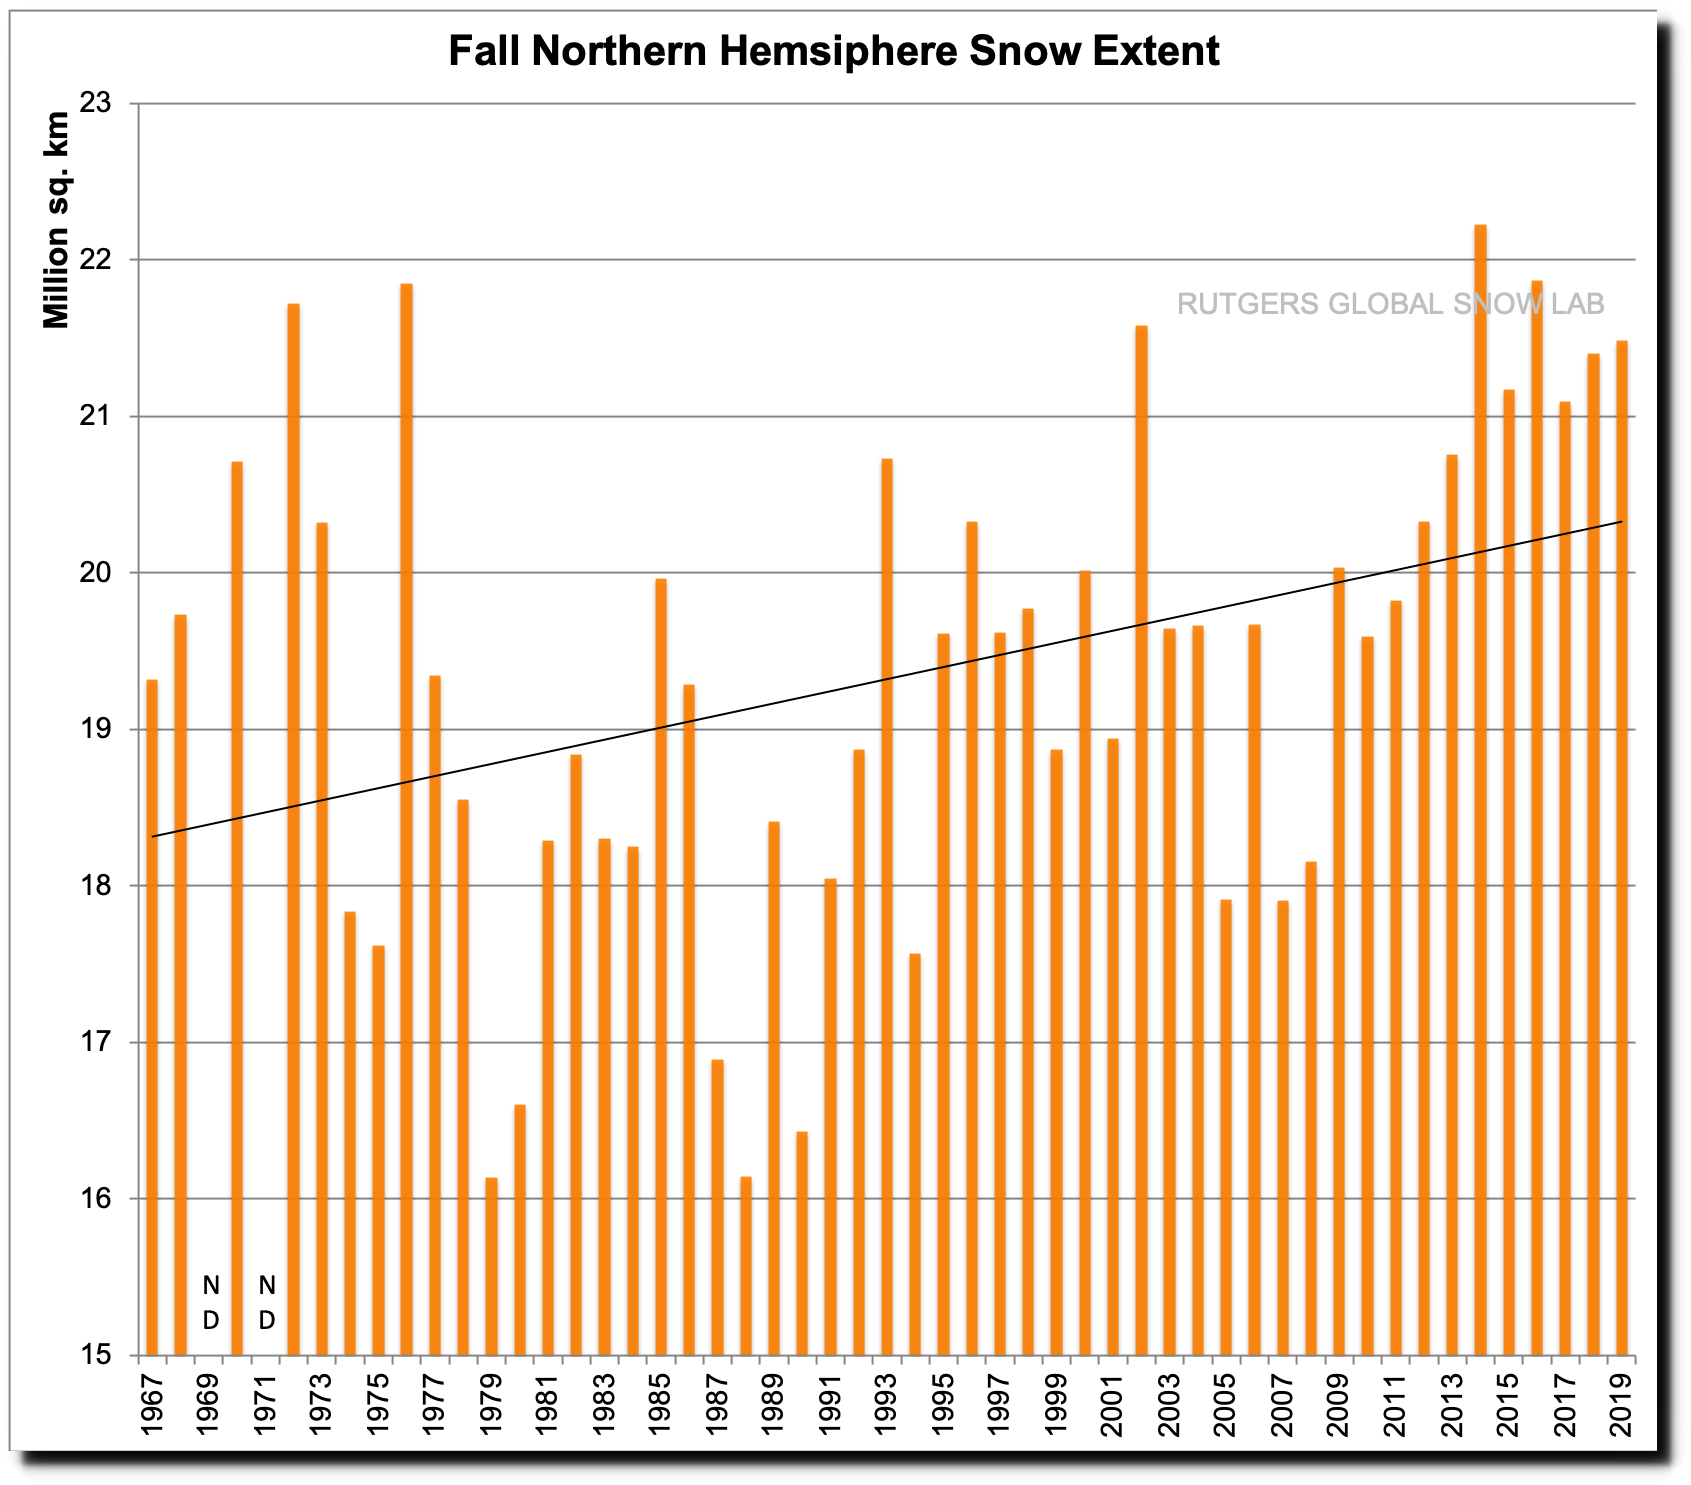

For the entire year, snow cover has been above normal for the past five years.
Rainfall in Australia has been increasing for over a centiry.
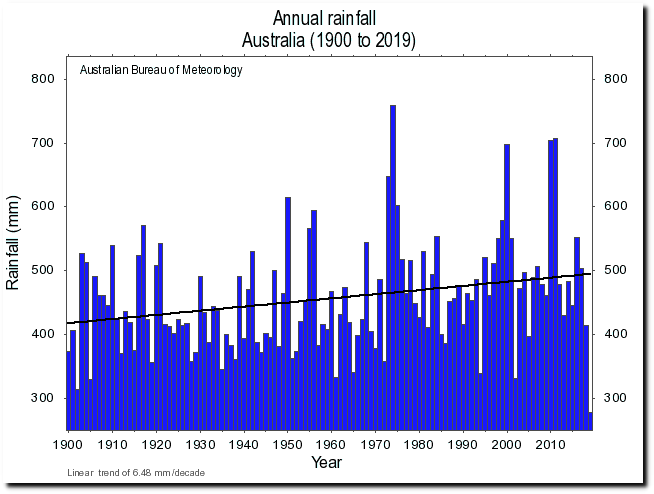
Australian climate variability & change – Time series graphs

Australian climate variability & change – Time series graphs
Rainfall in the US has been increasing for over 100 years.
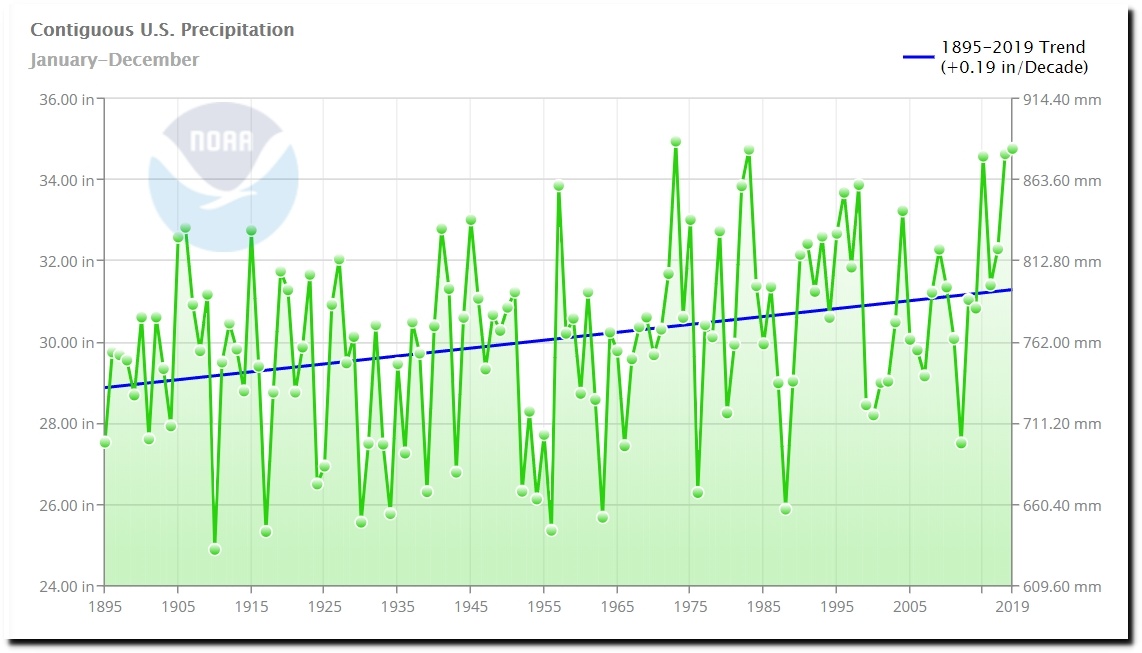
Climate at a Glance | National Centers for Environmental Information (NCEI)
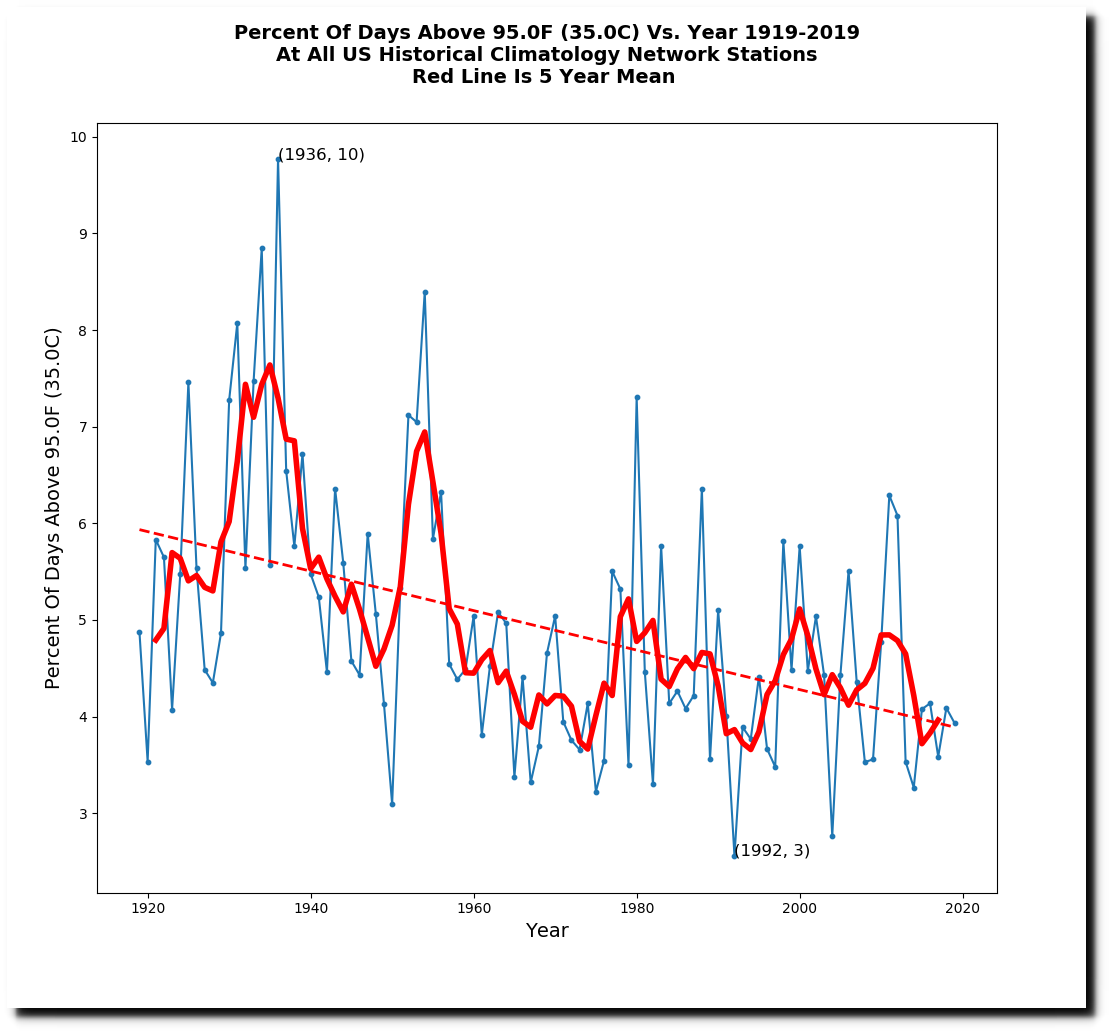
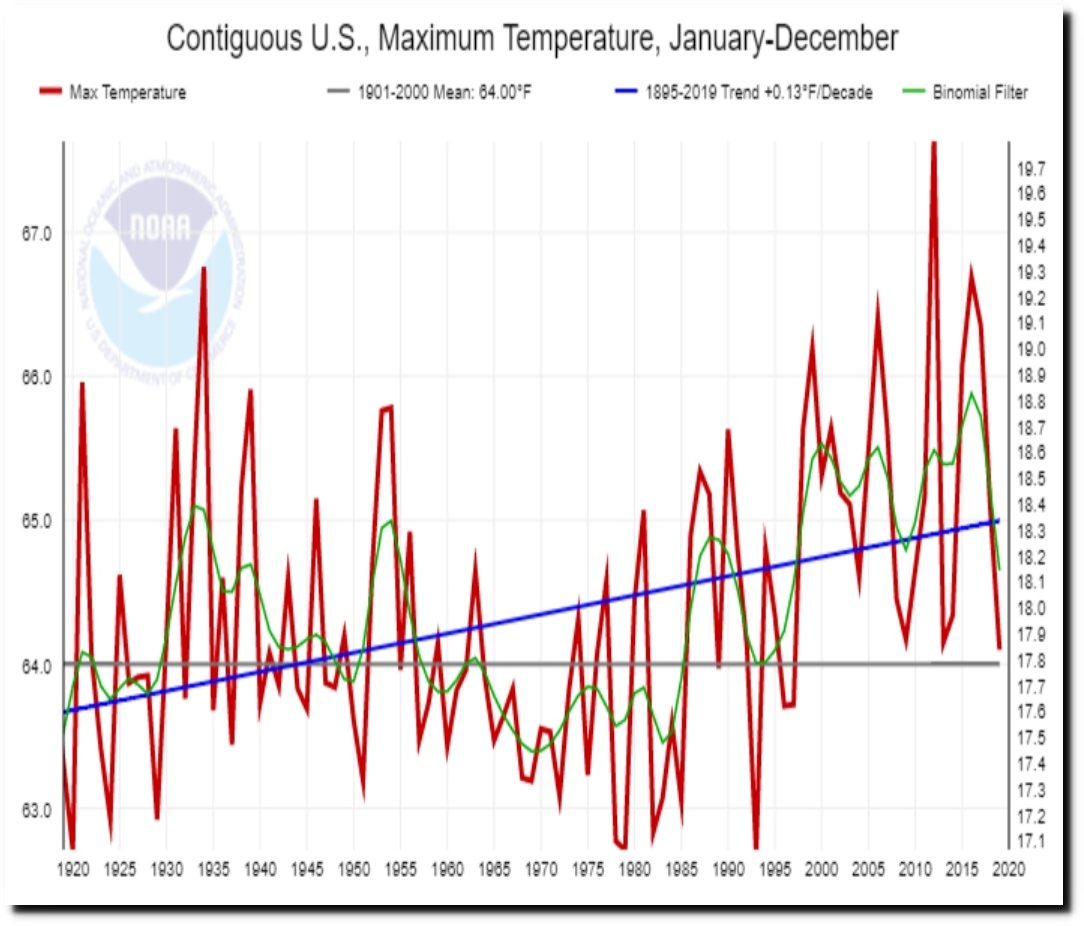
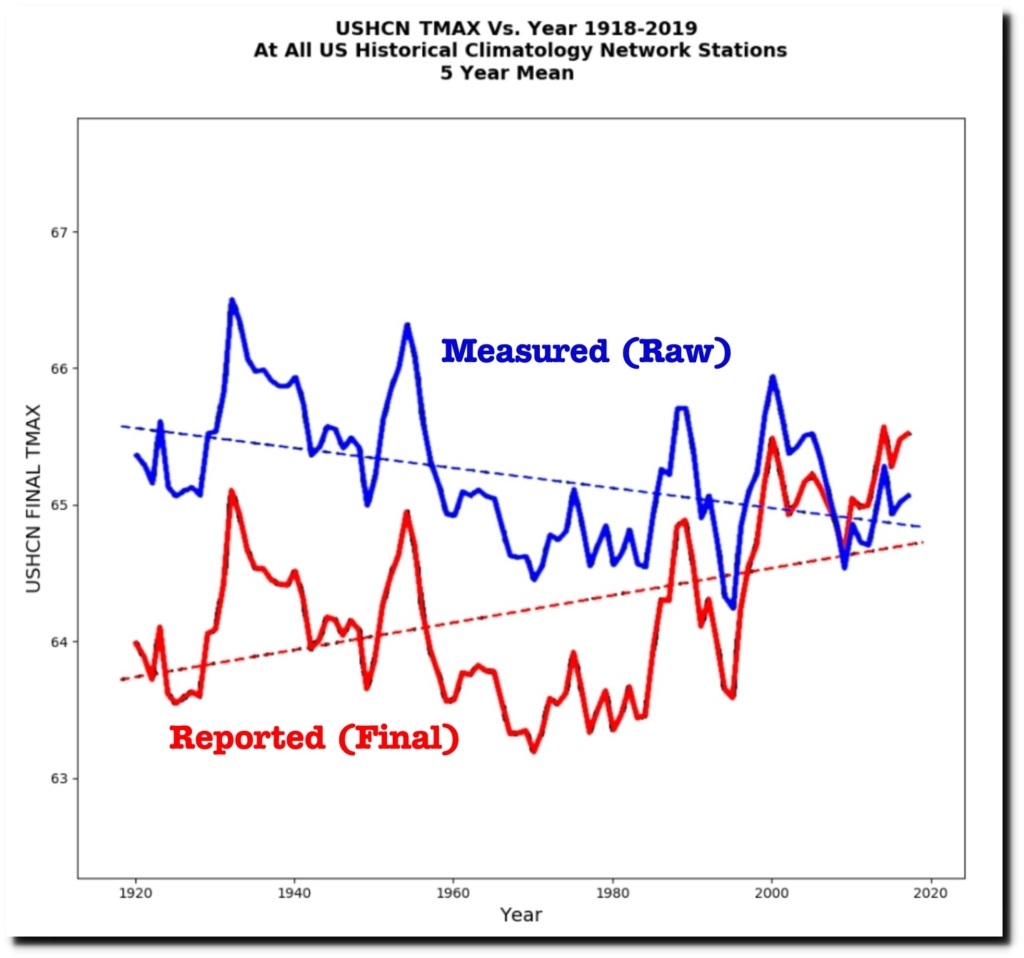
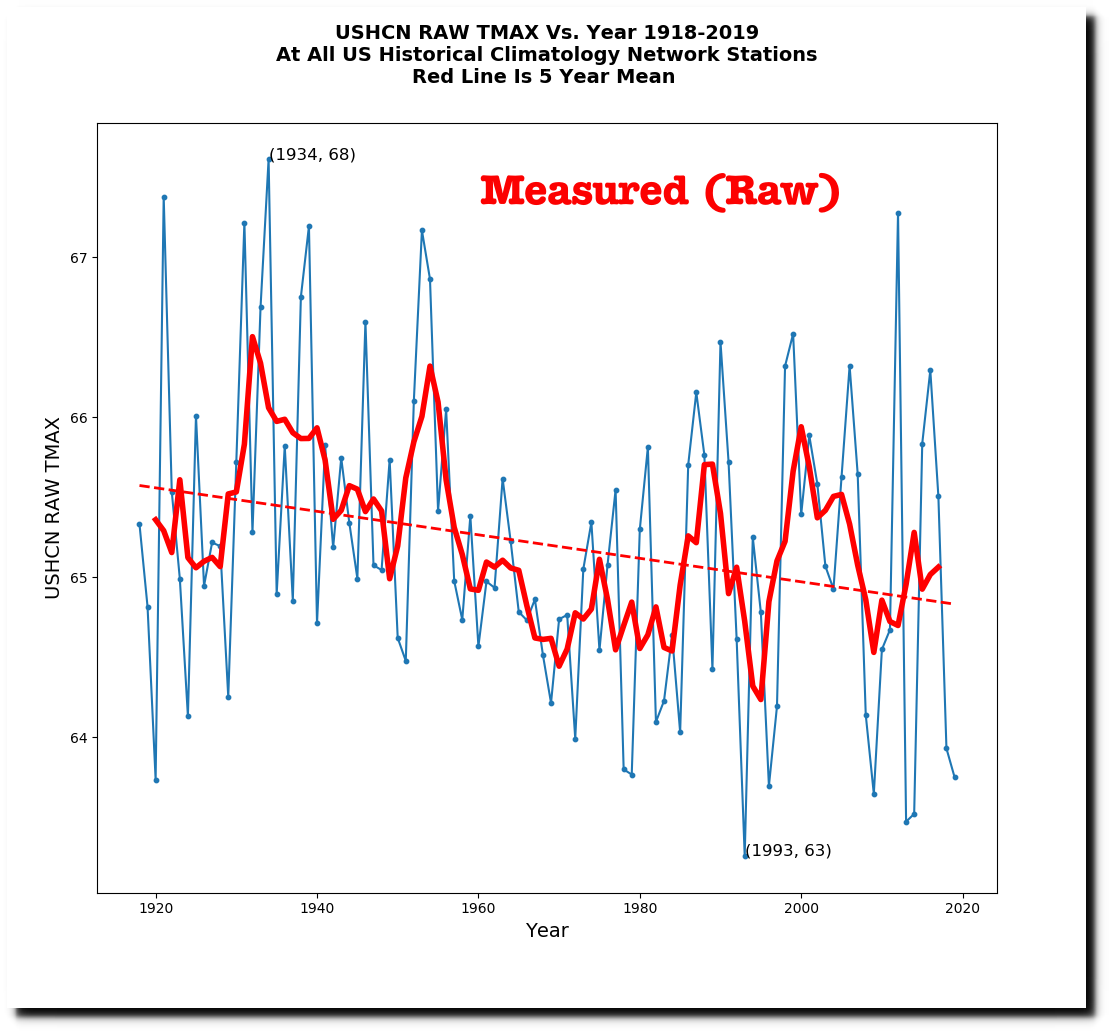
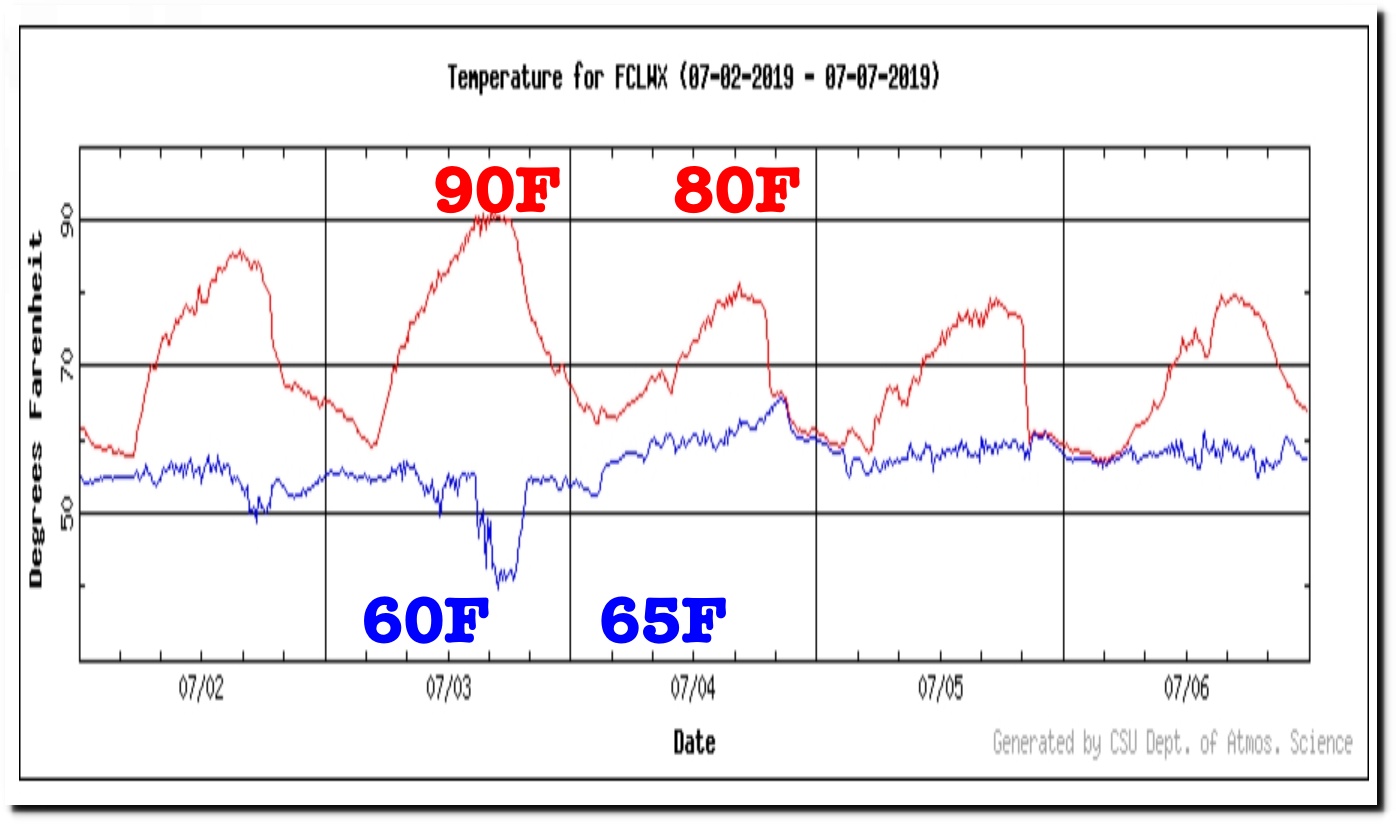
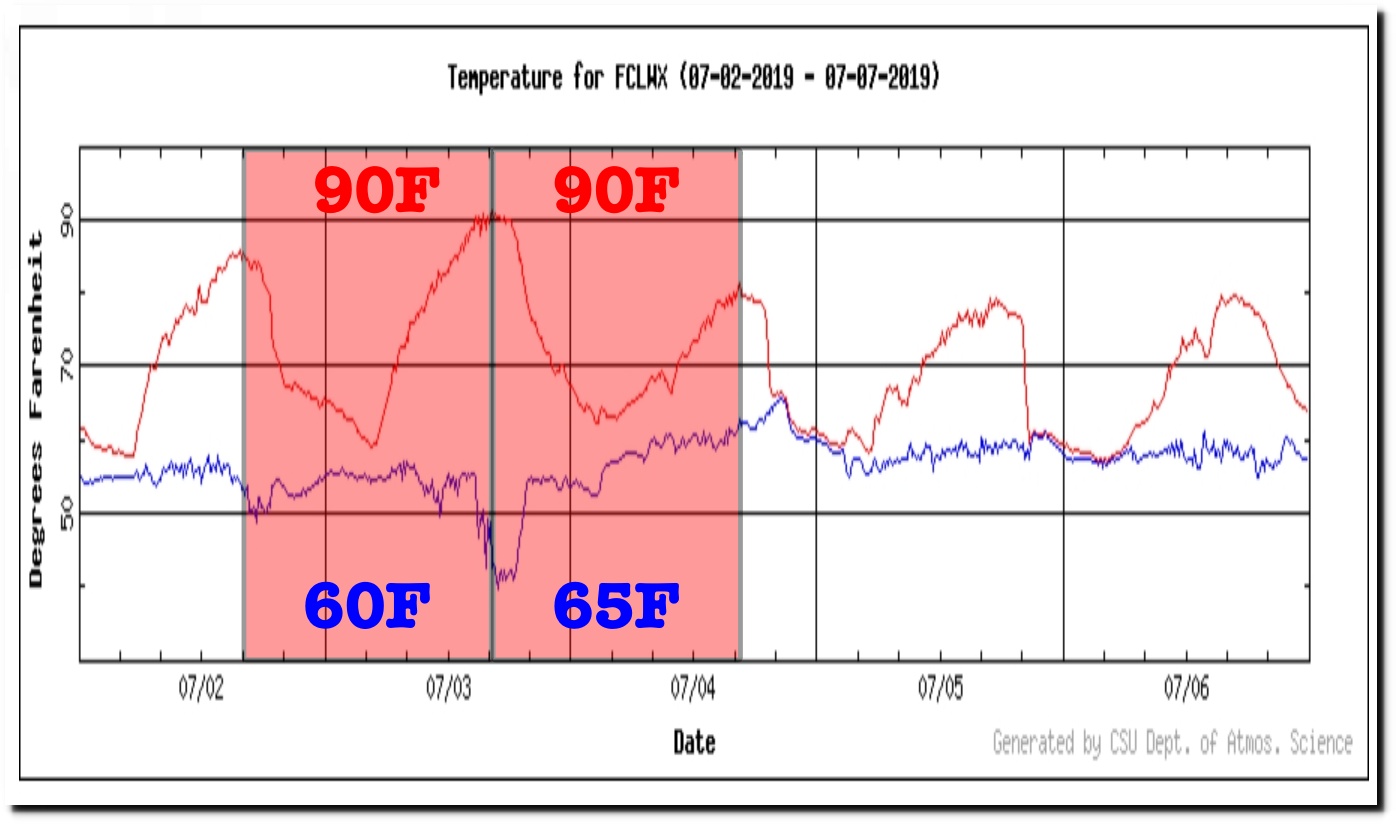
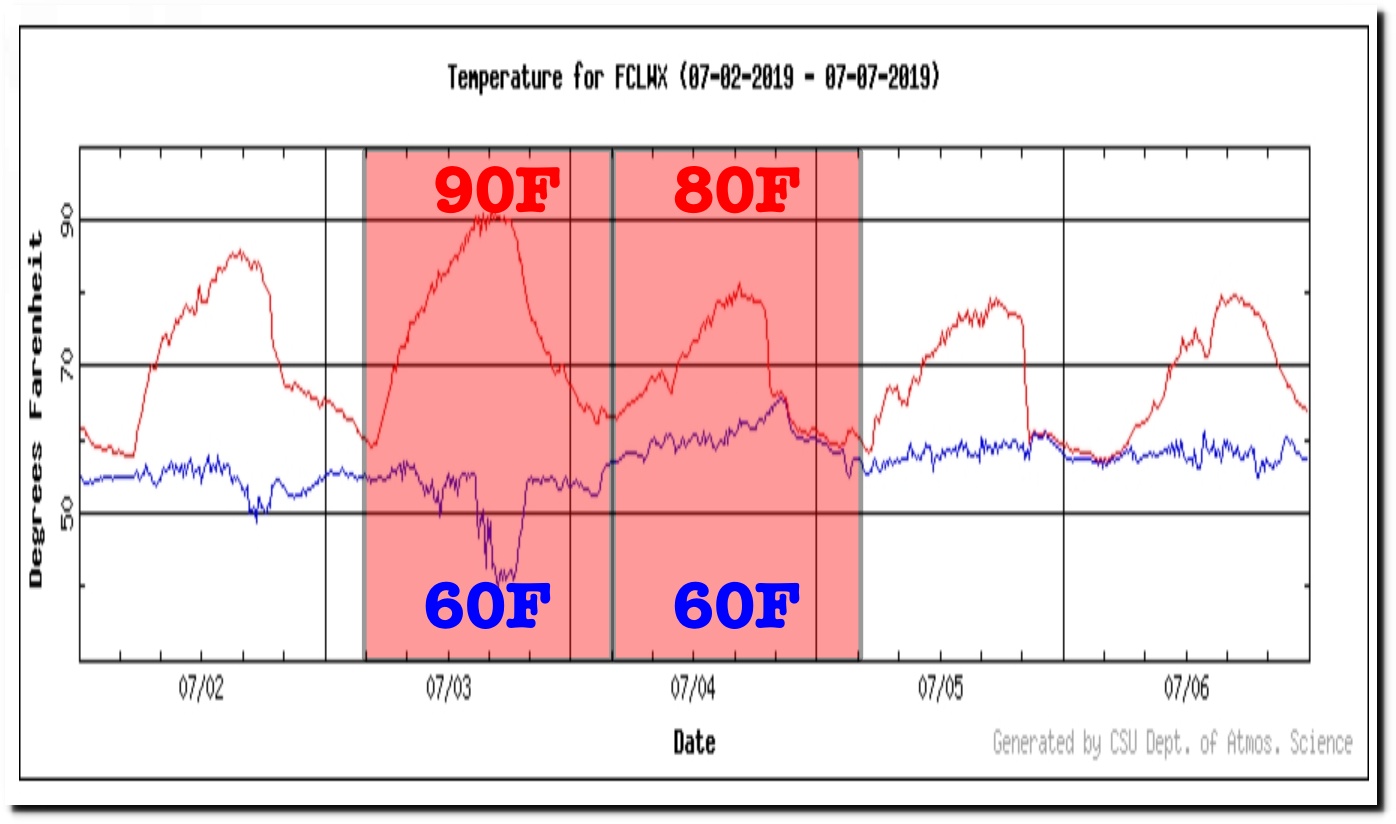
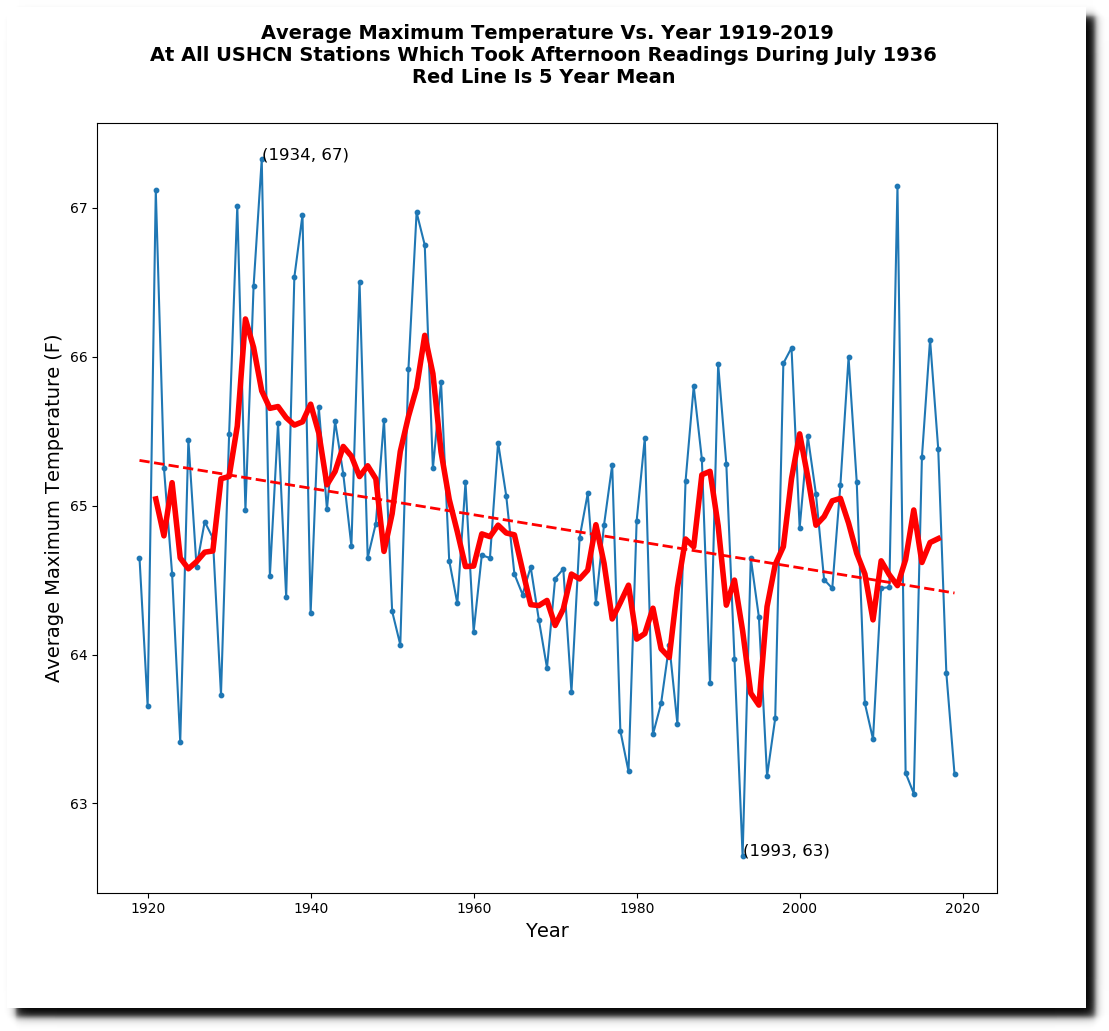
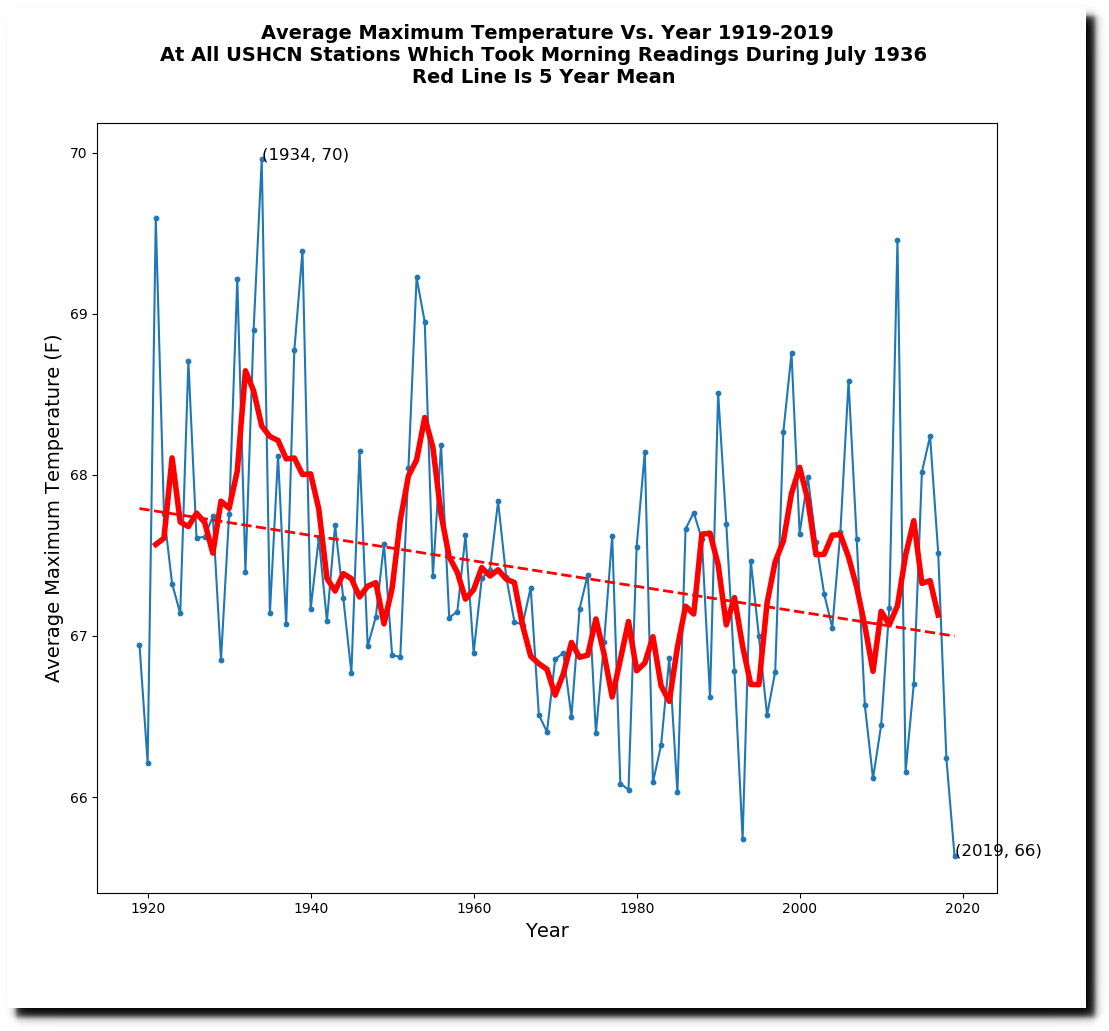
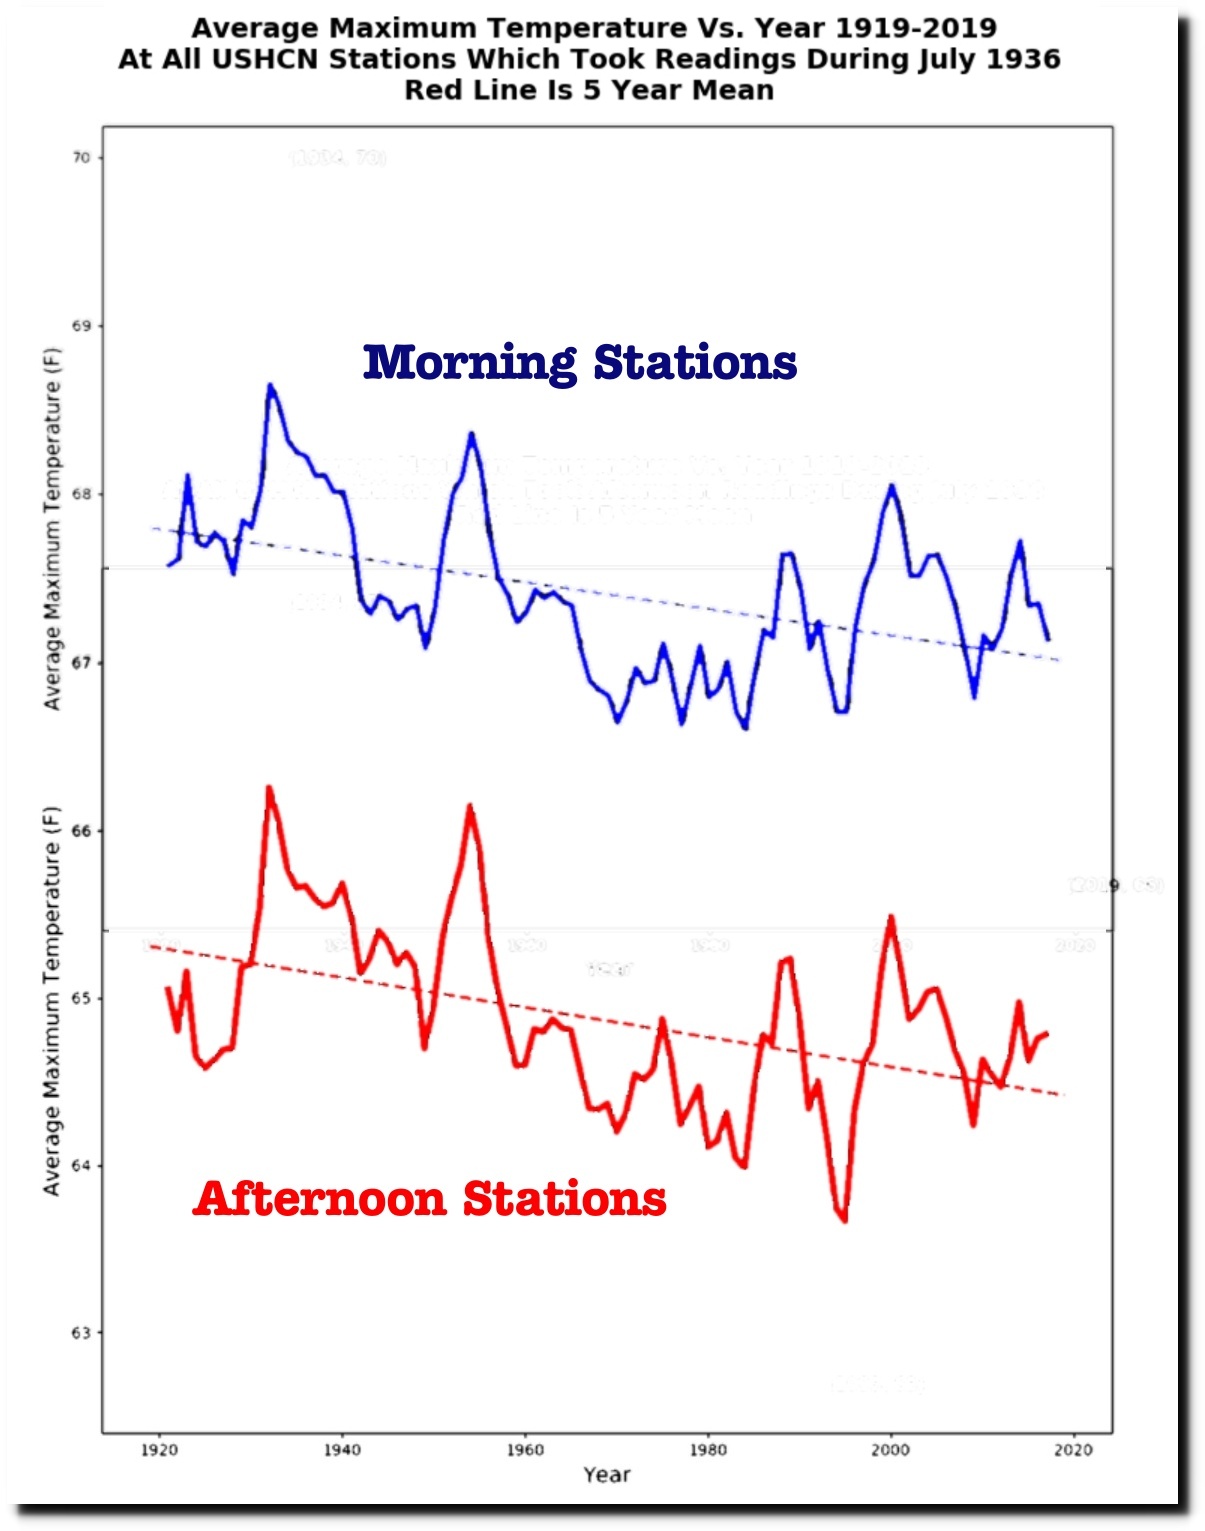
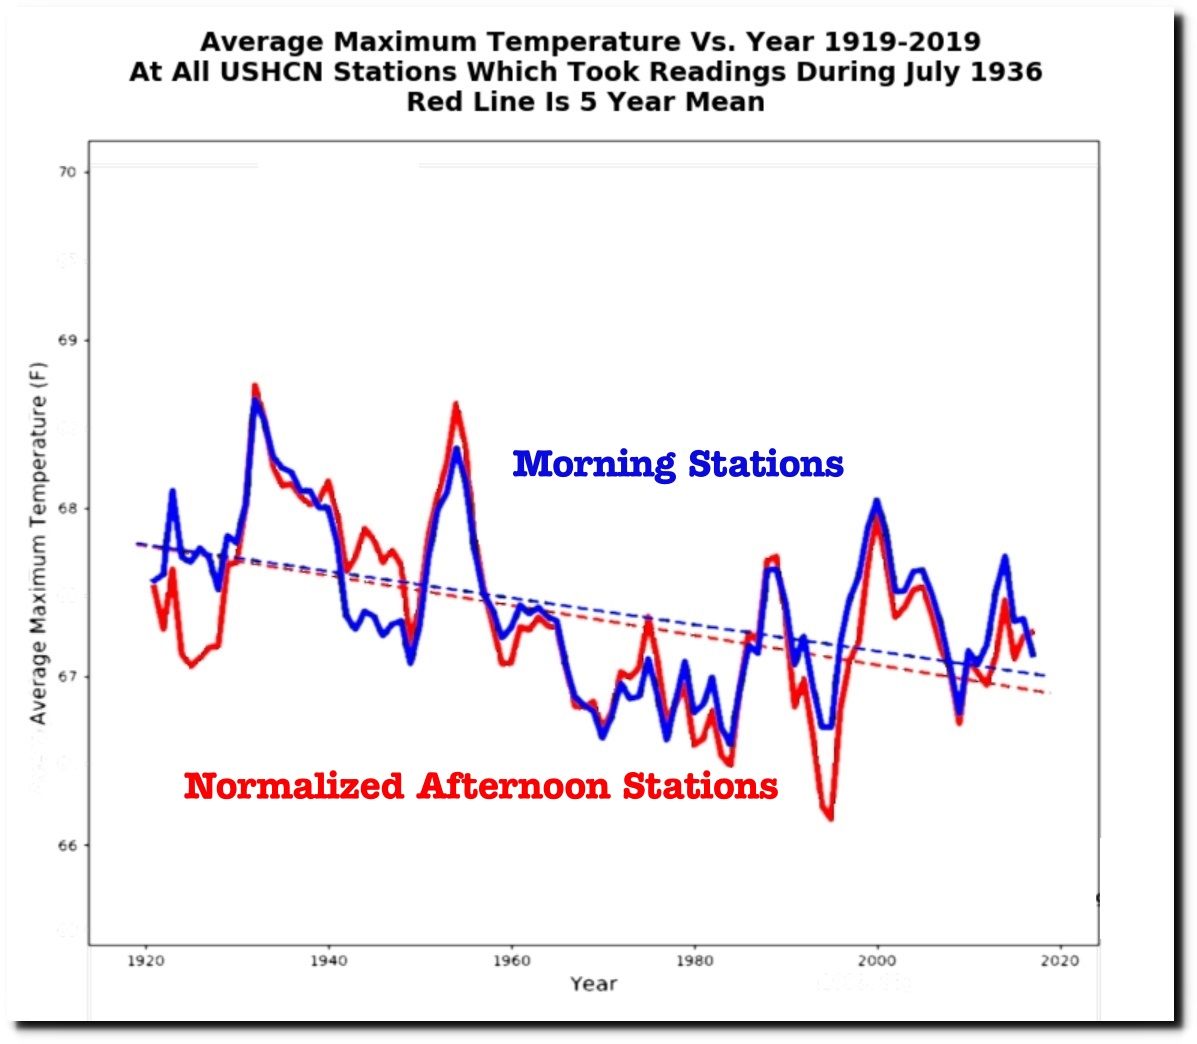
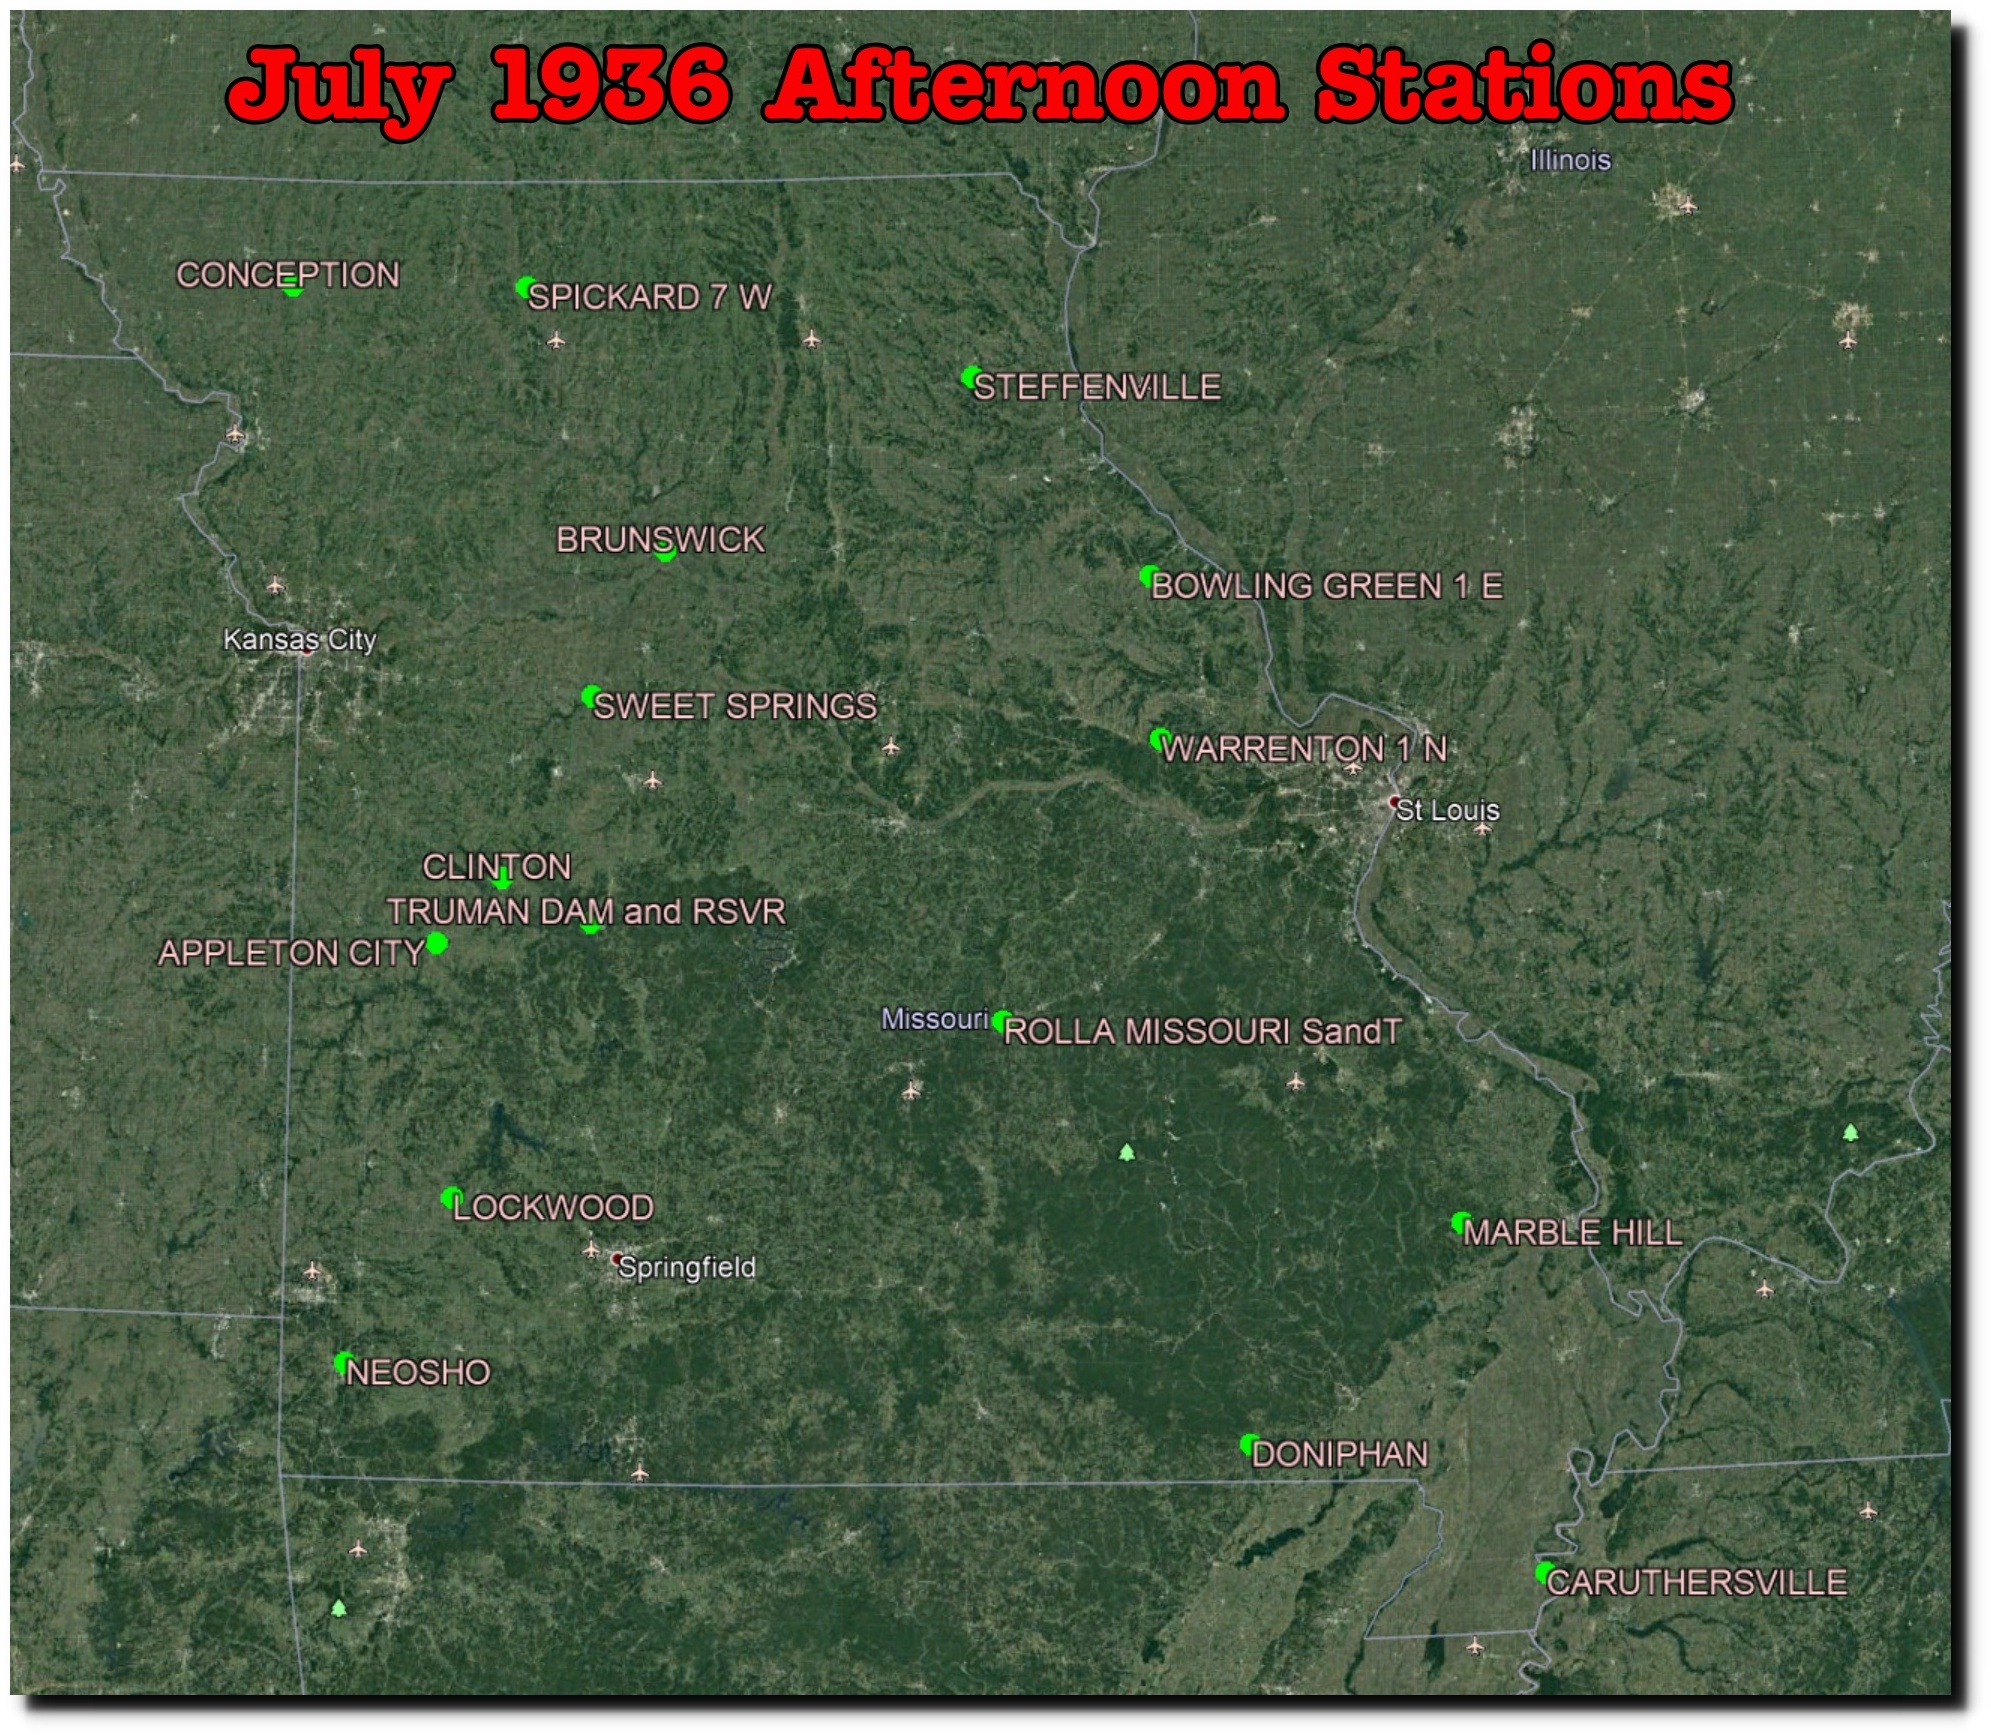
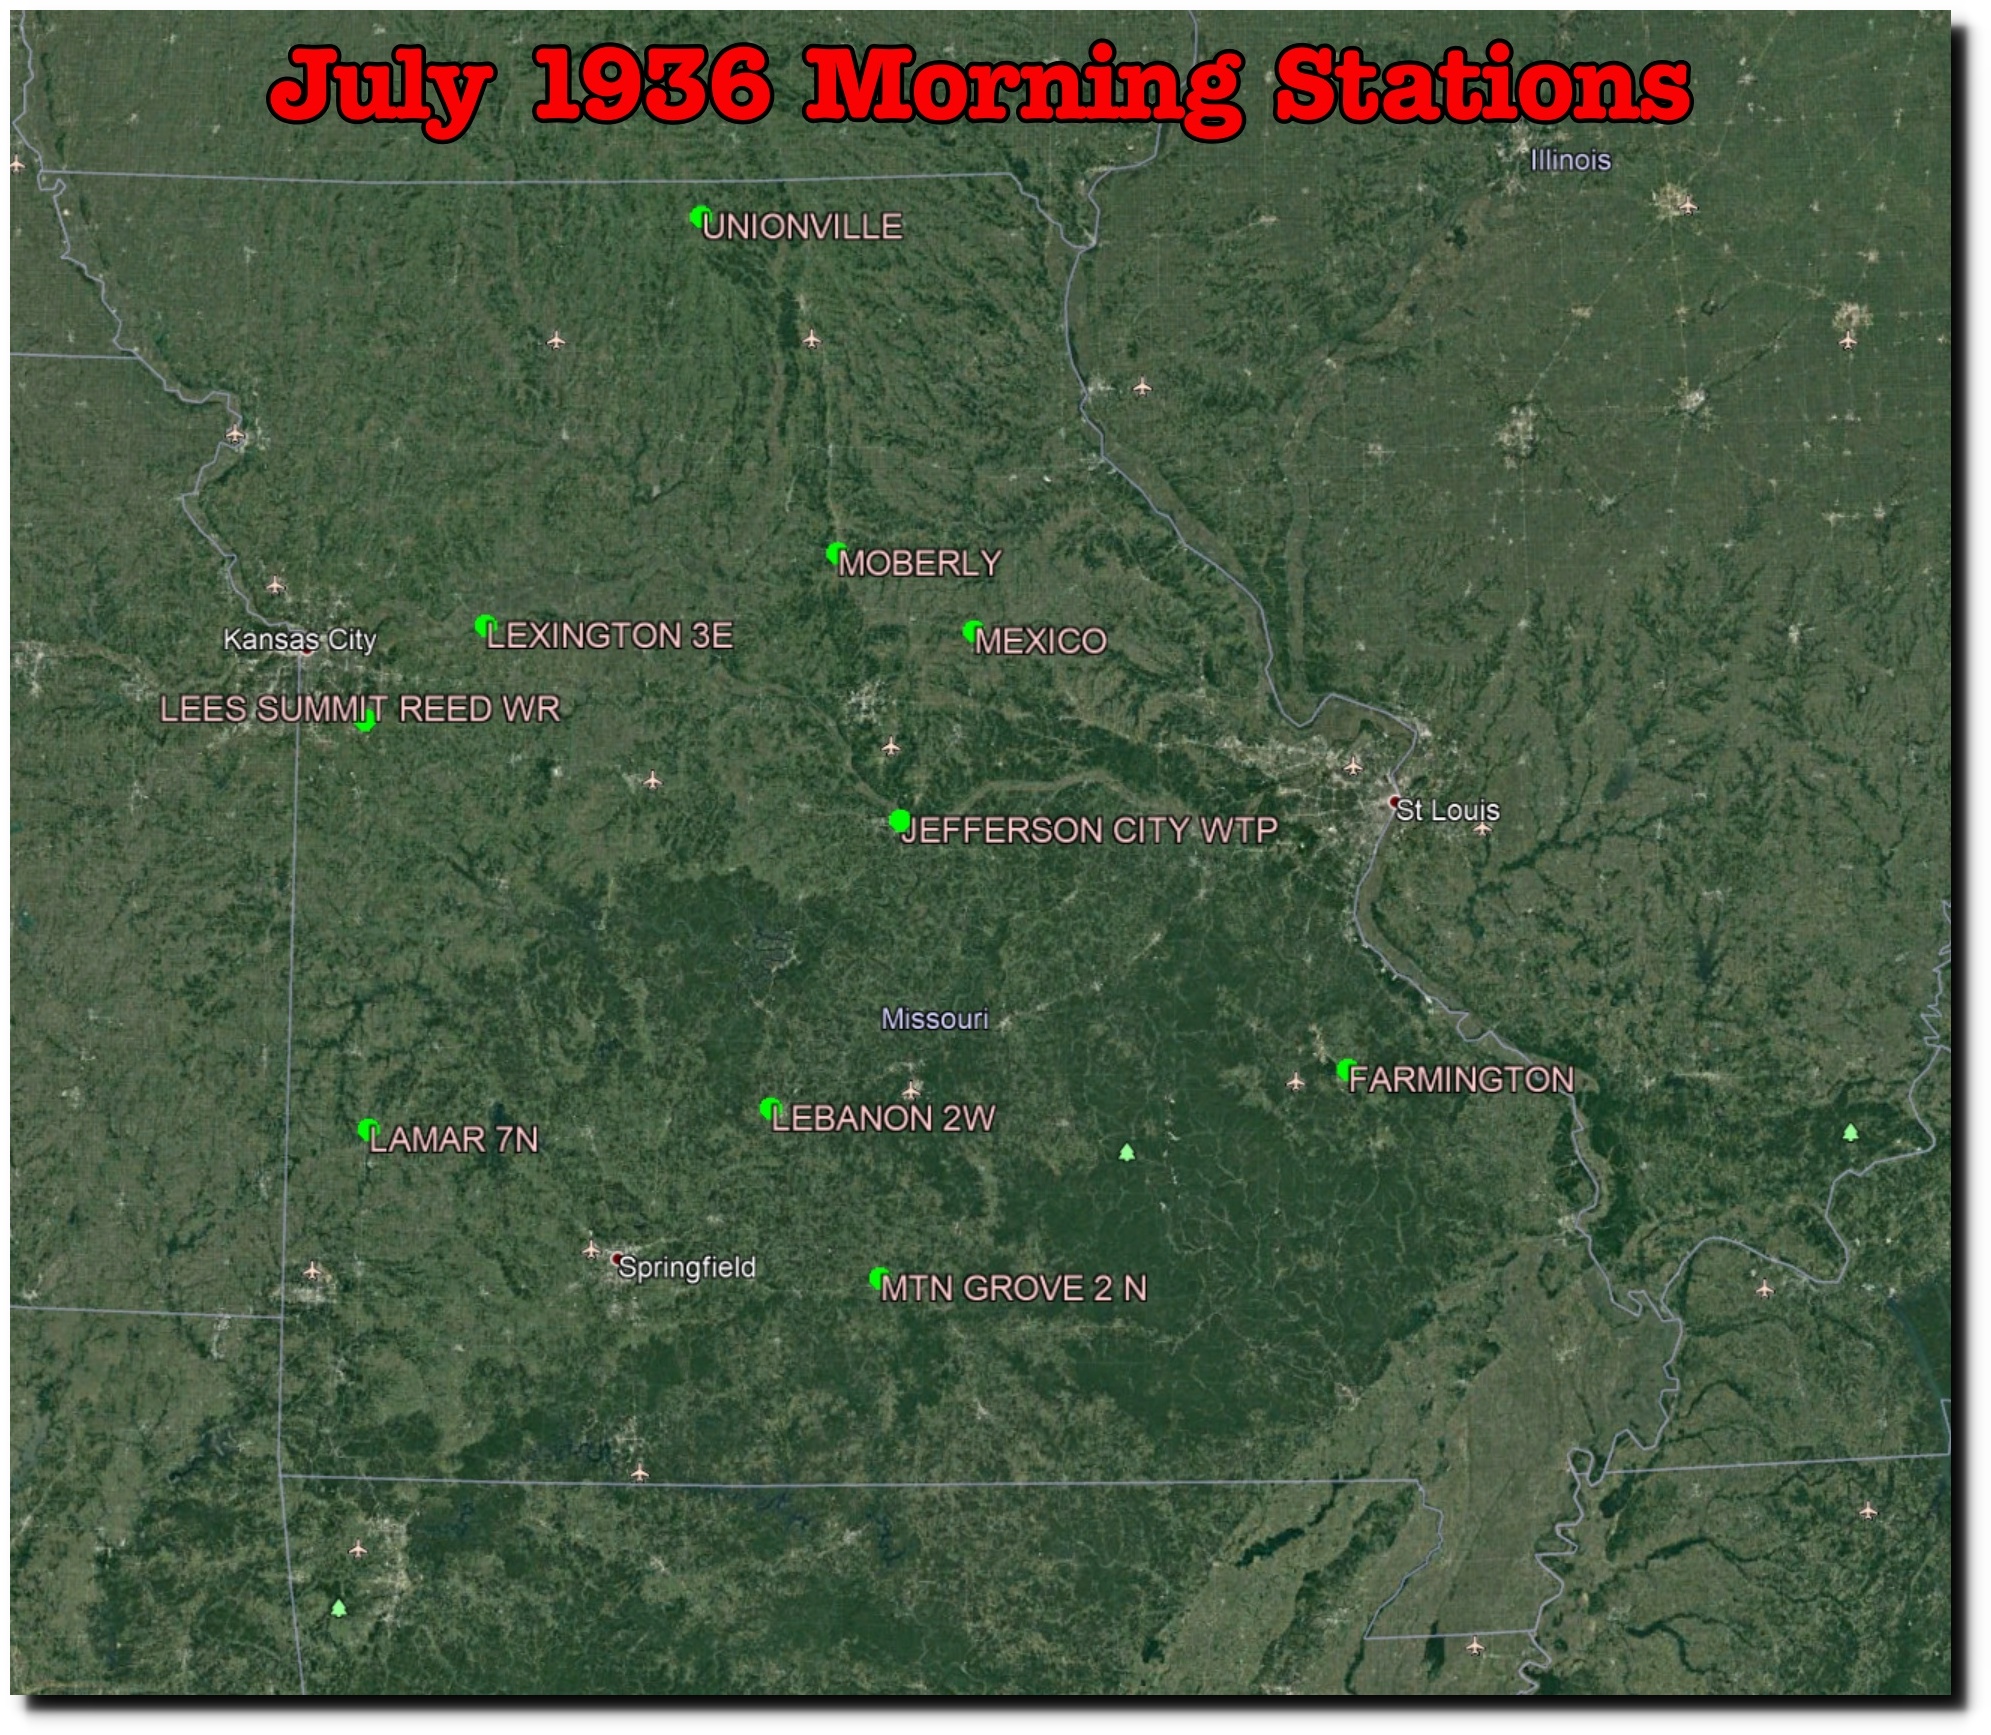
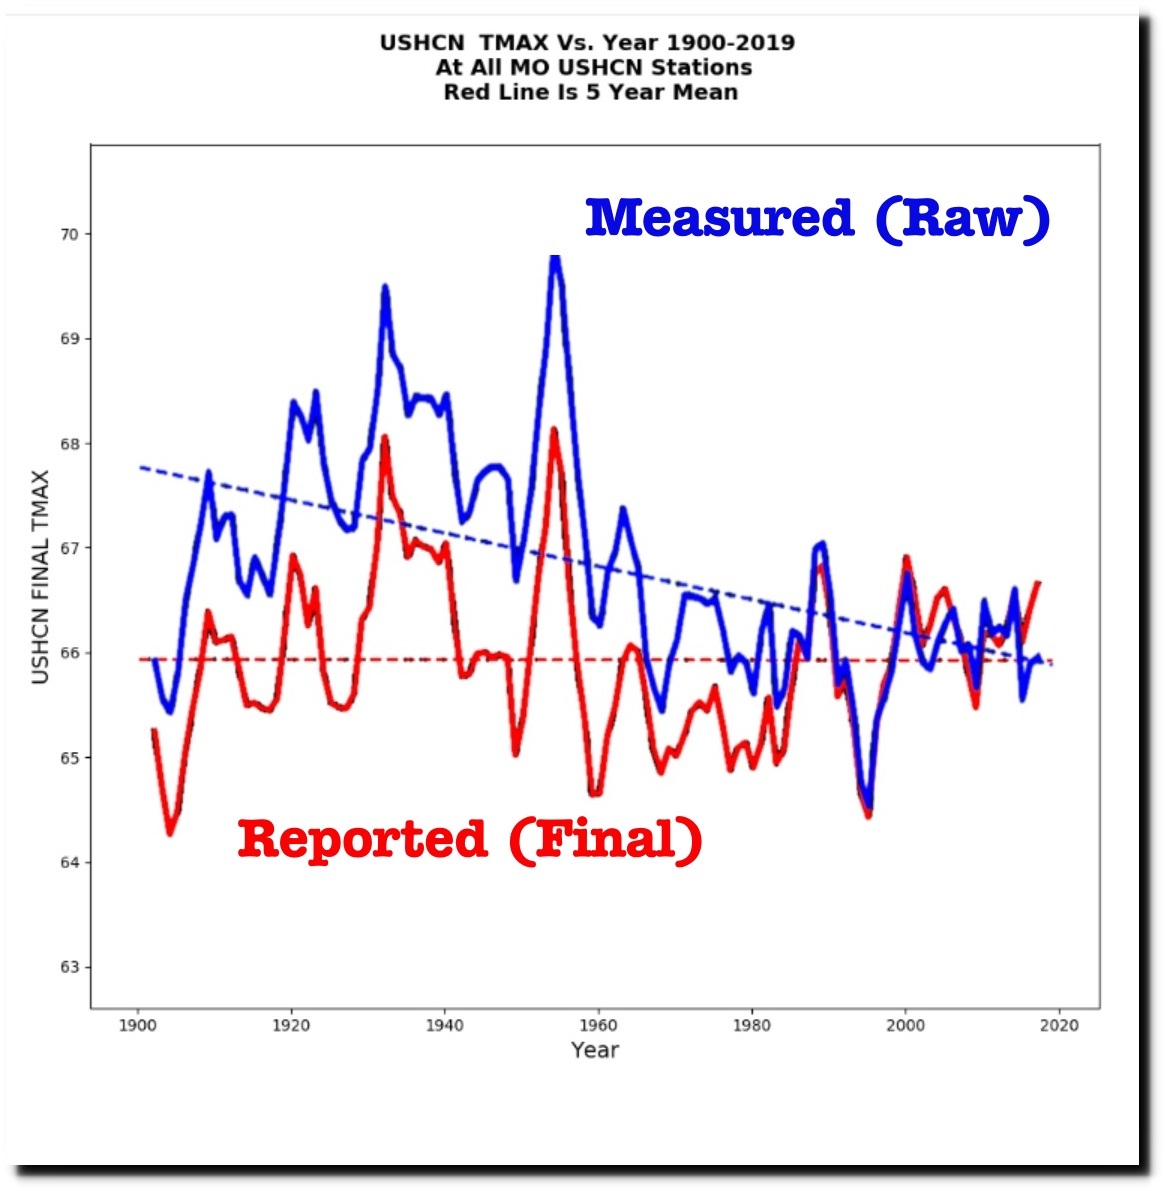
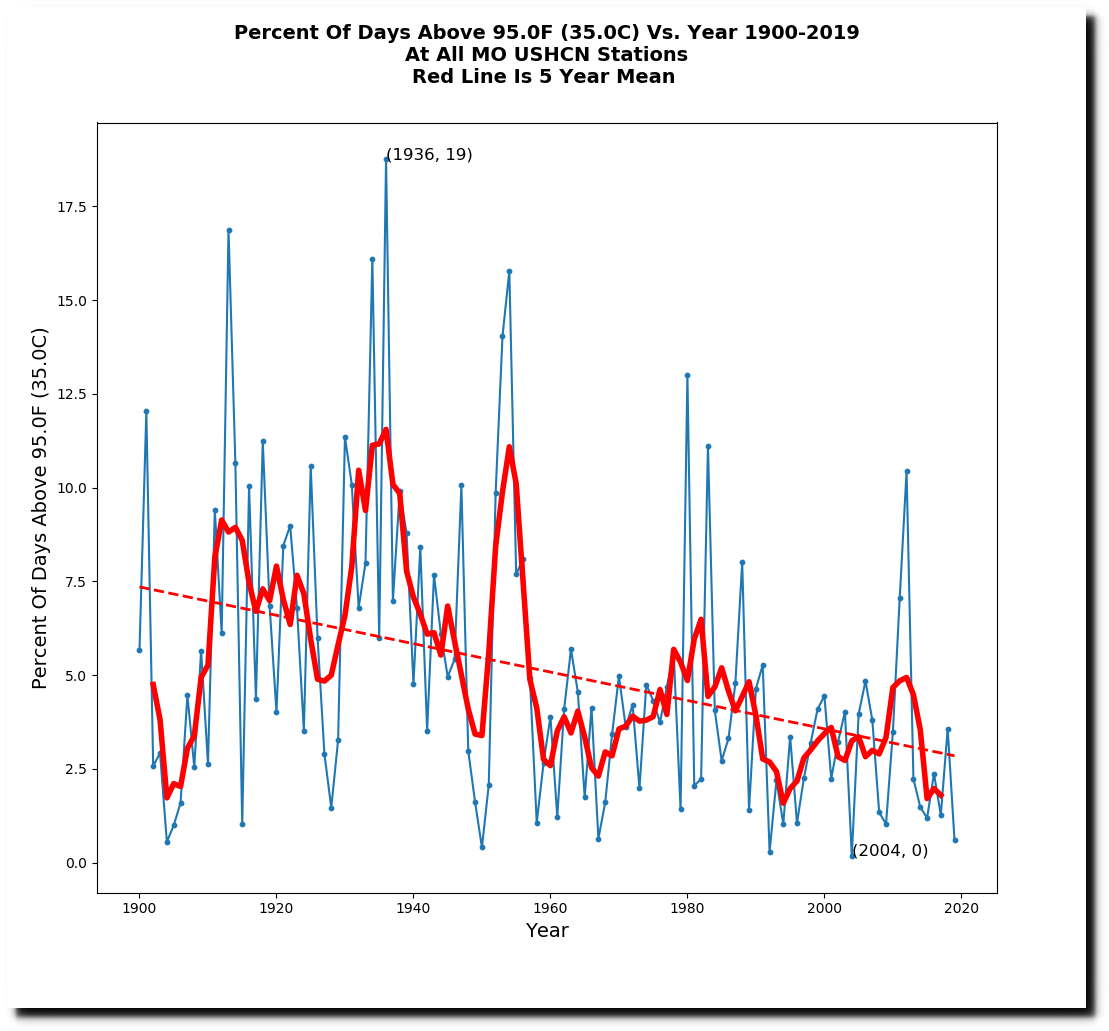
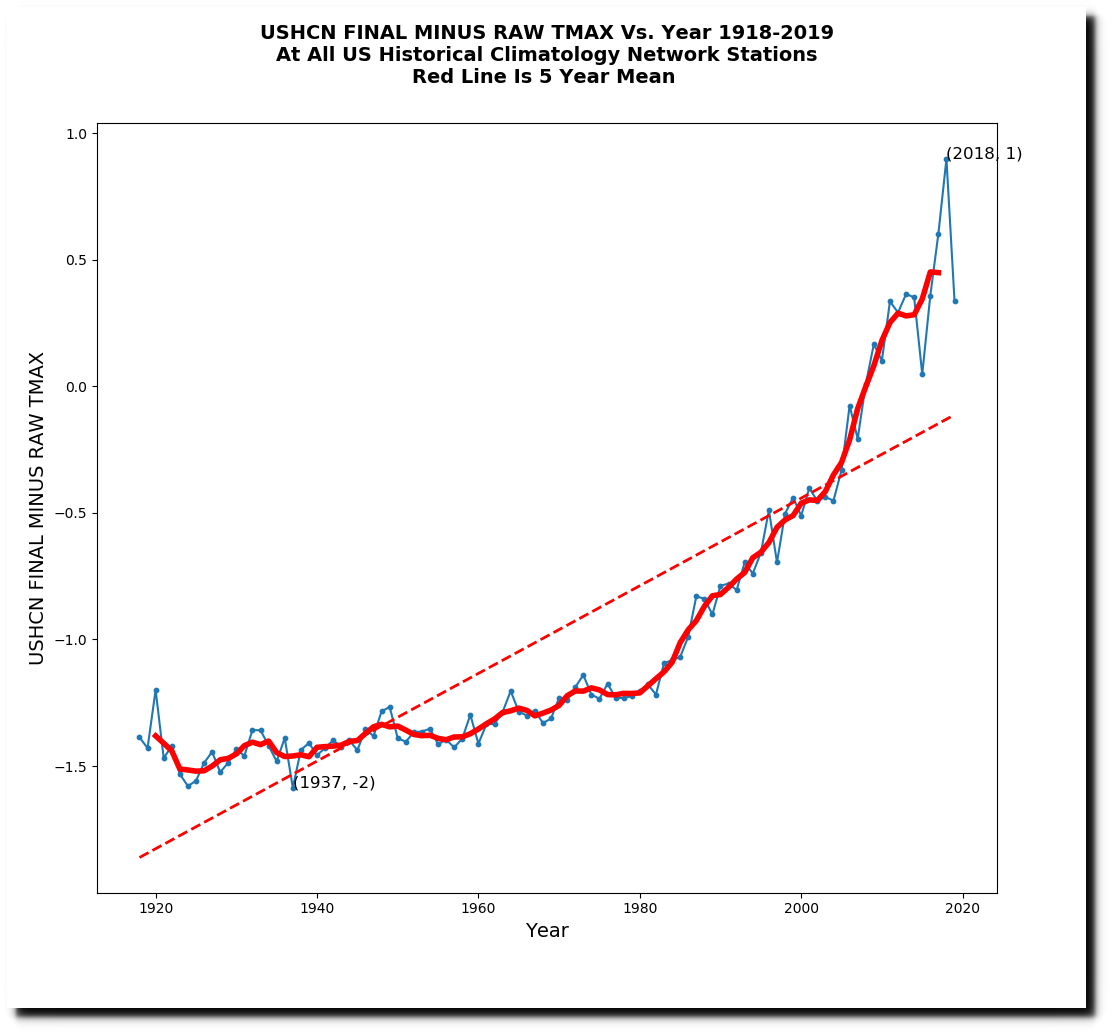
Afternoon temperatures have been declining in the US for a century.

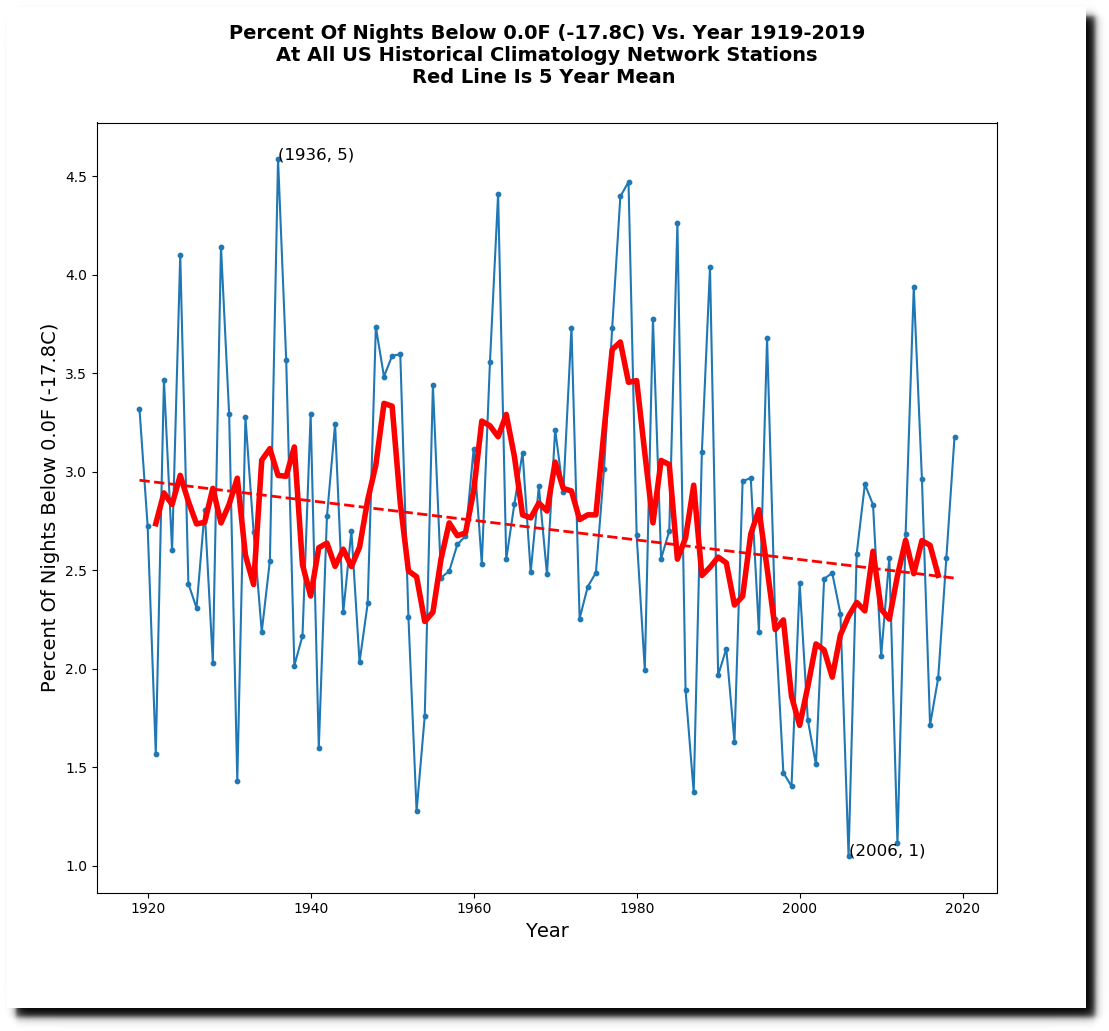
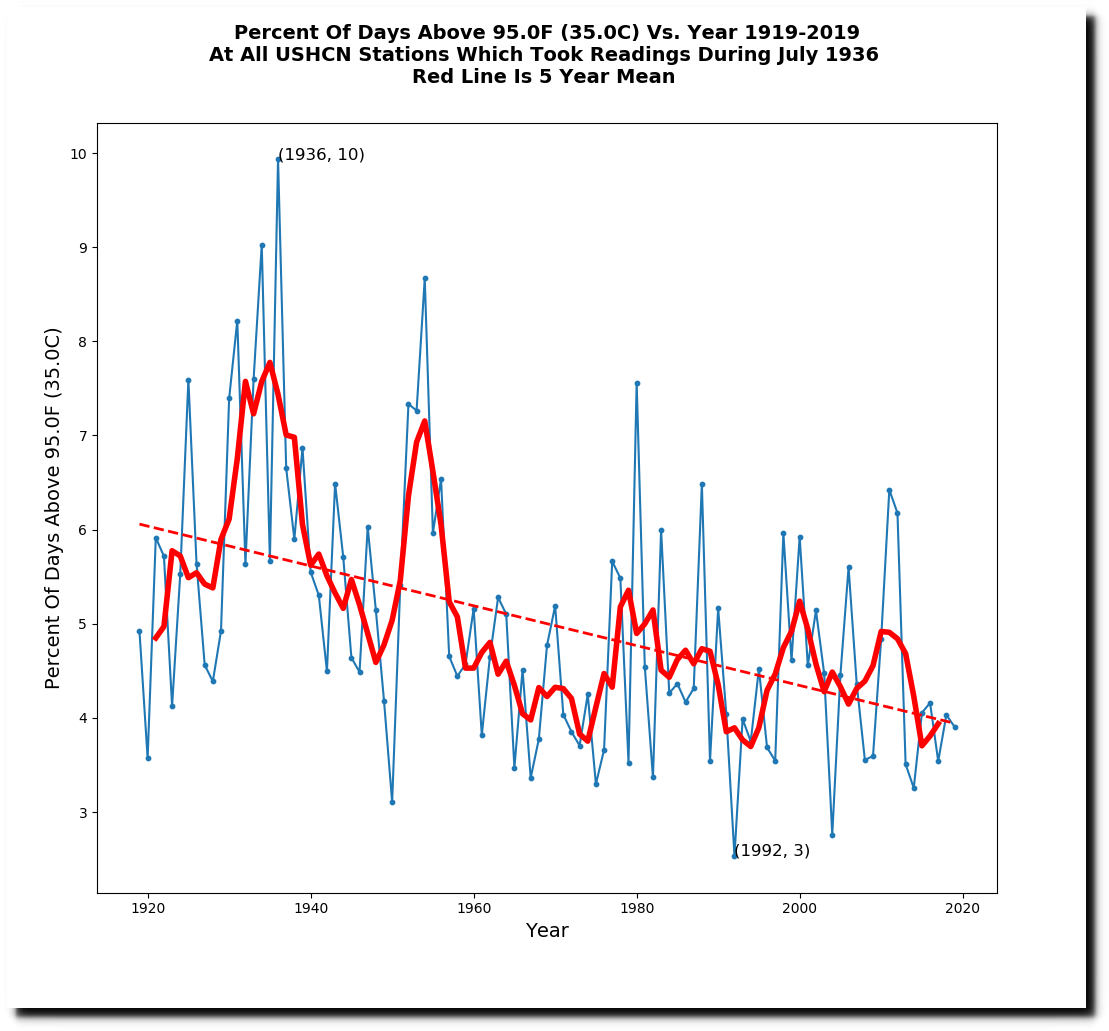
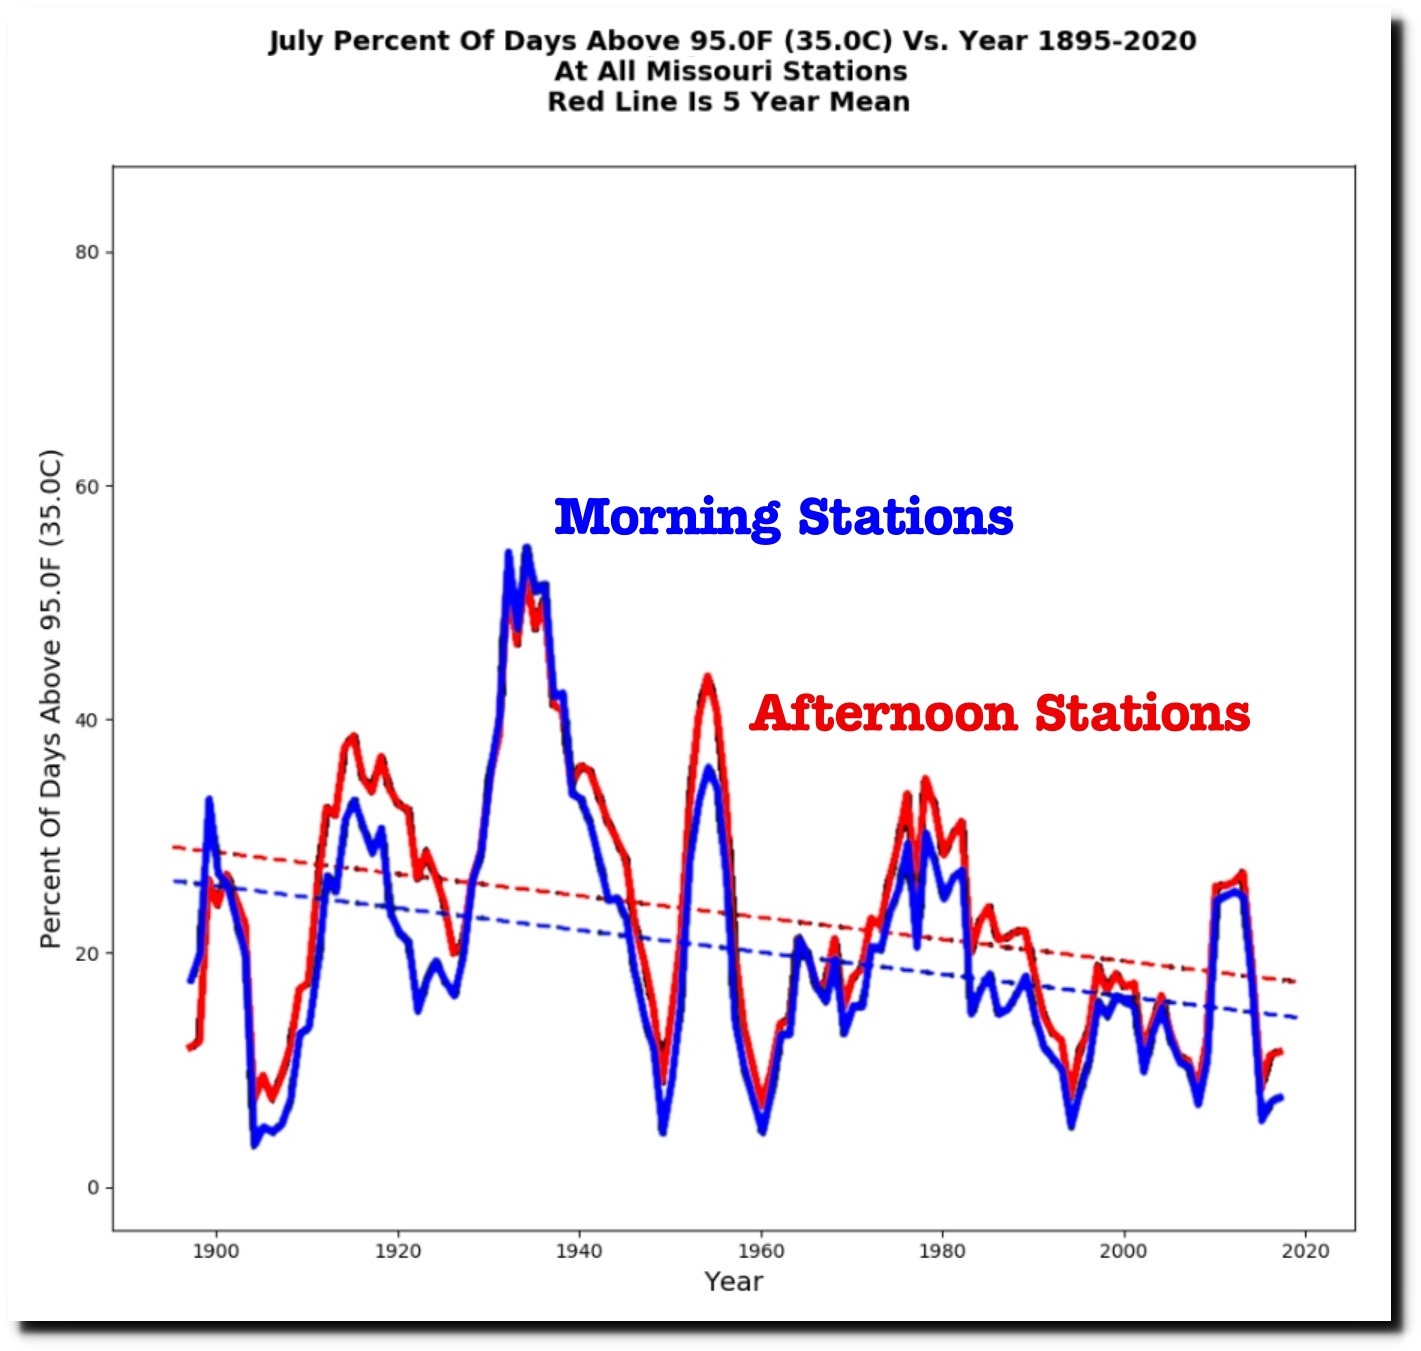
The frequency of both hot days and cold nights have been declining for a century.
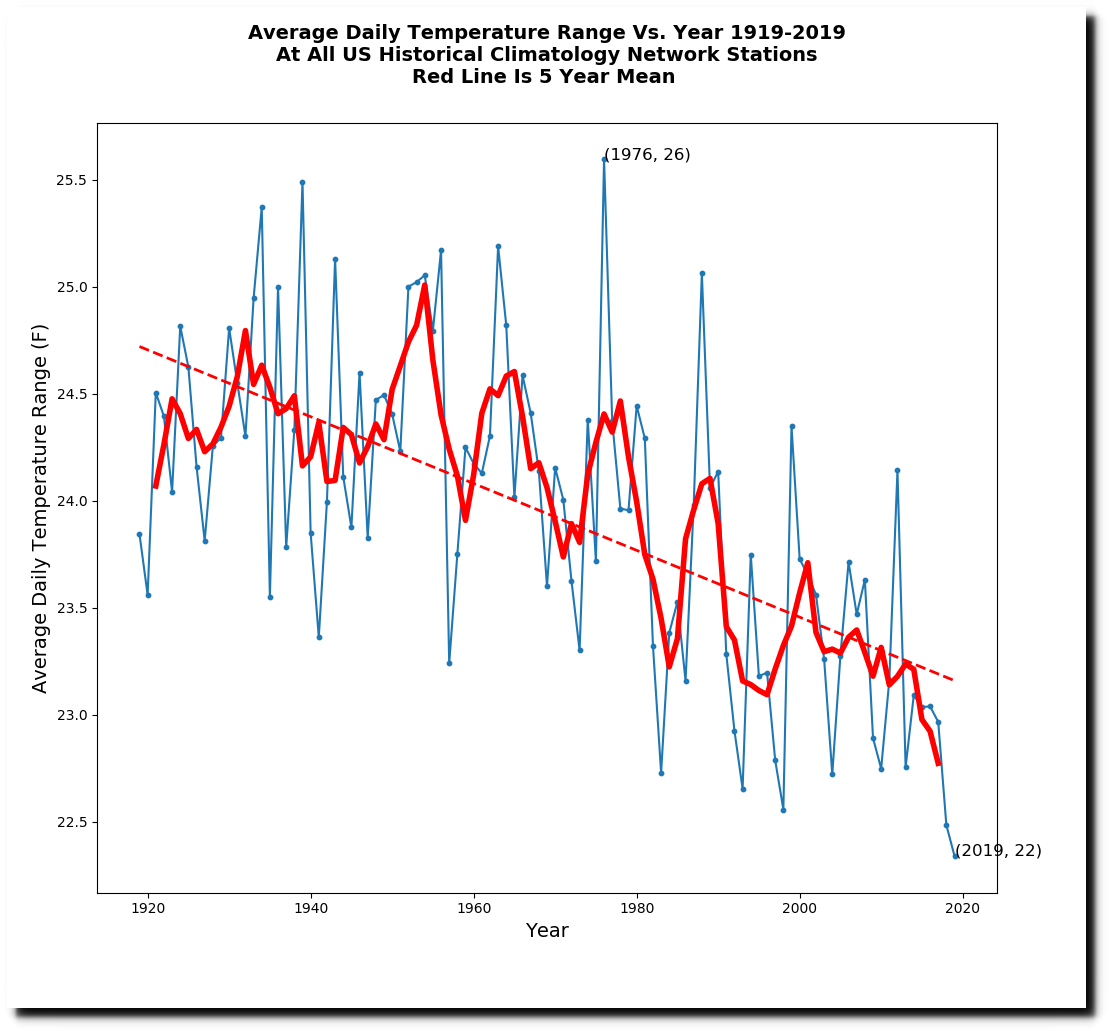
The daily temperature range in the US has been rapidly declining, as the US climate becomes milder.
Forest fire burn acreage has been plummeting for 90 years.
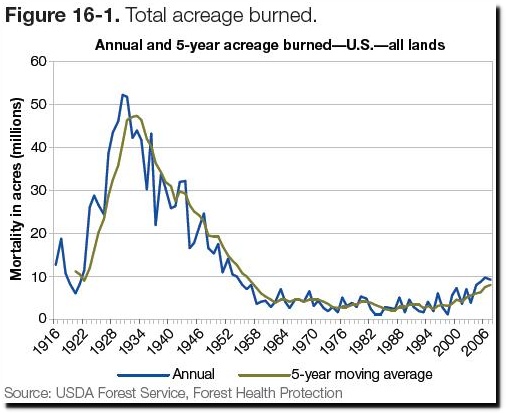
Indicator 3.16: Area and percent of forest affected by abiotic agents
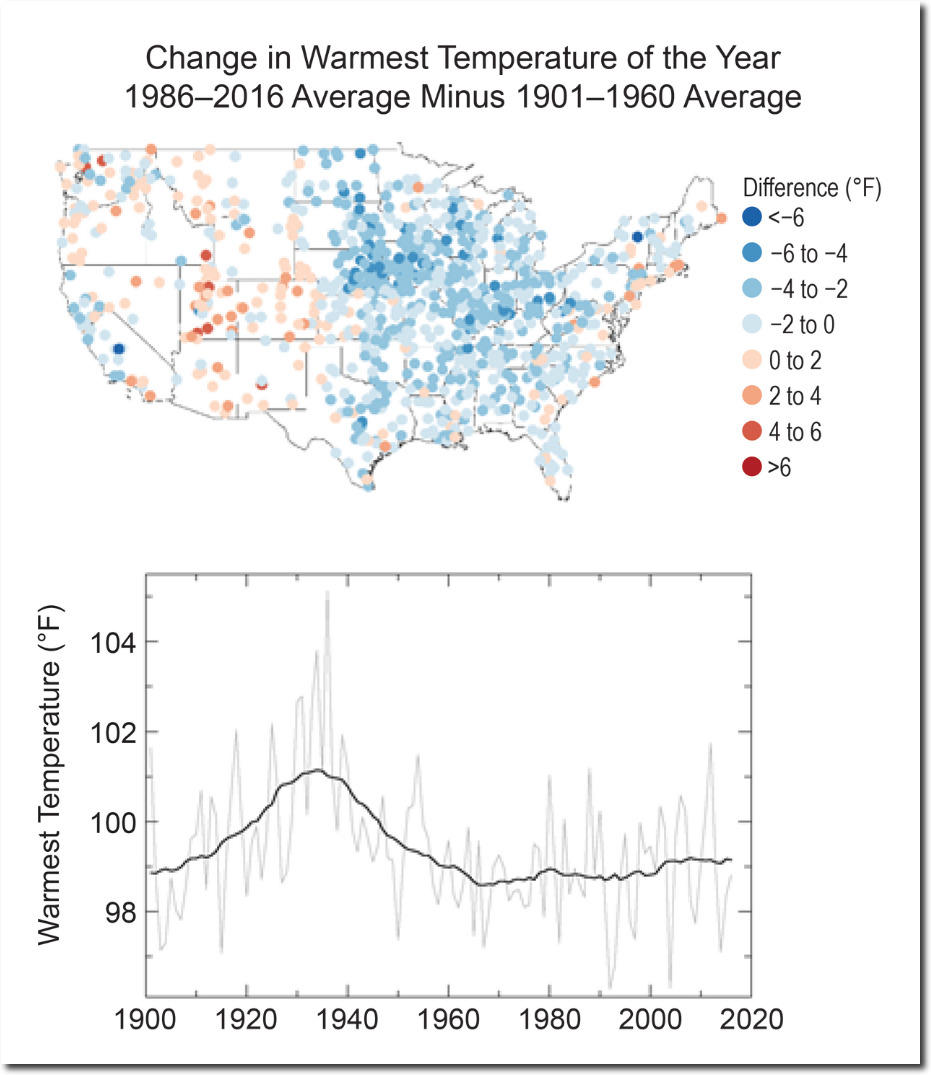
This closely matches the decline in heatwaves.
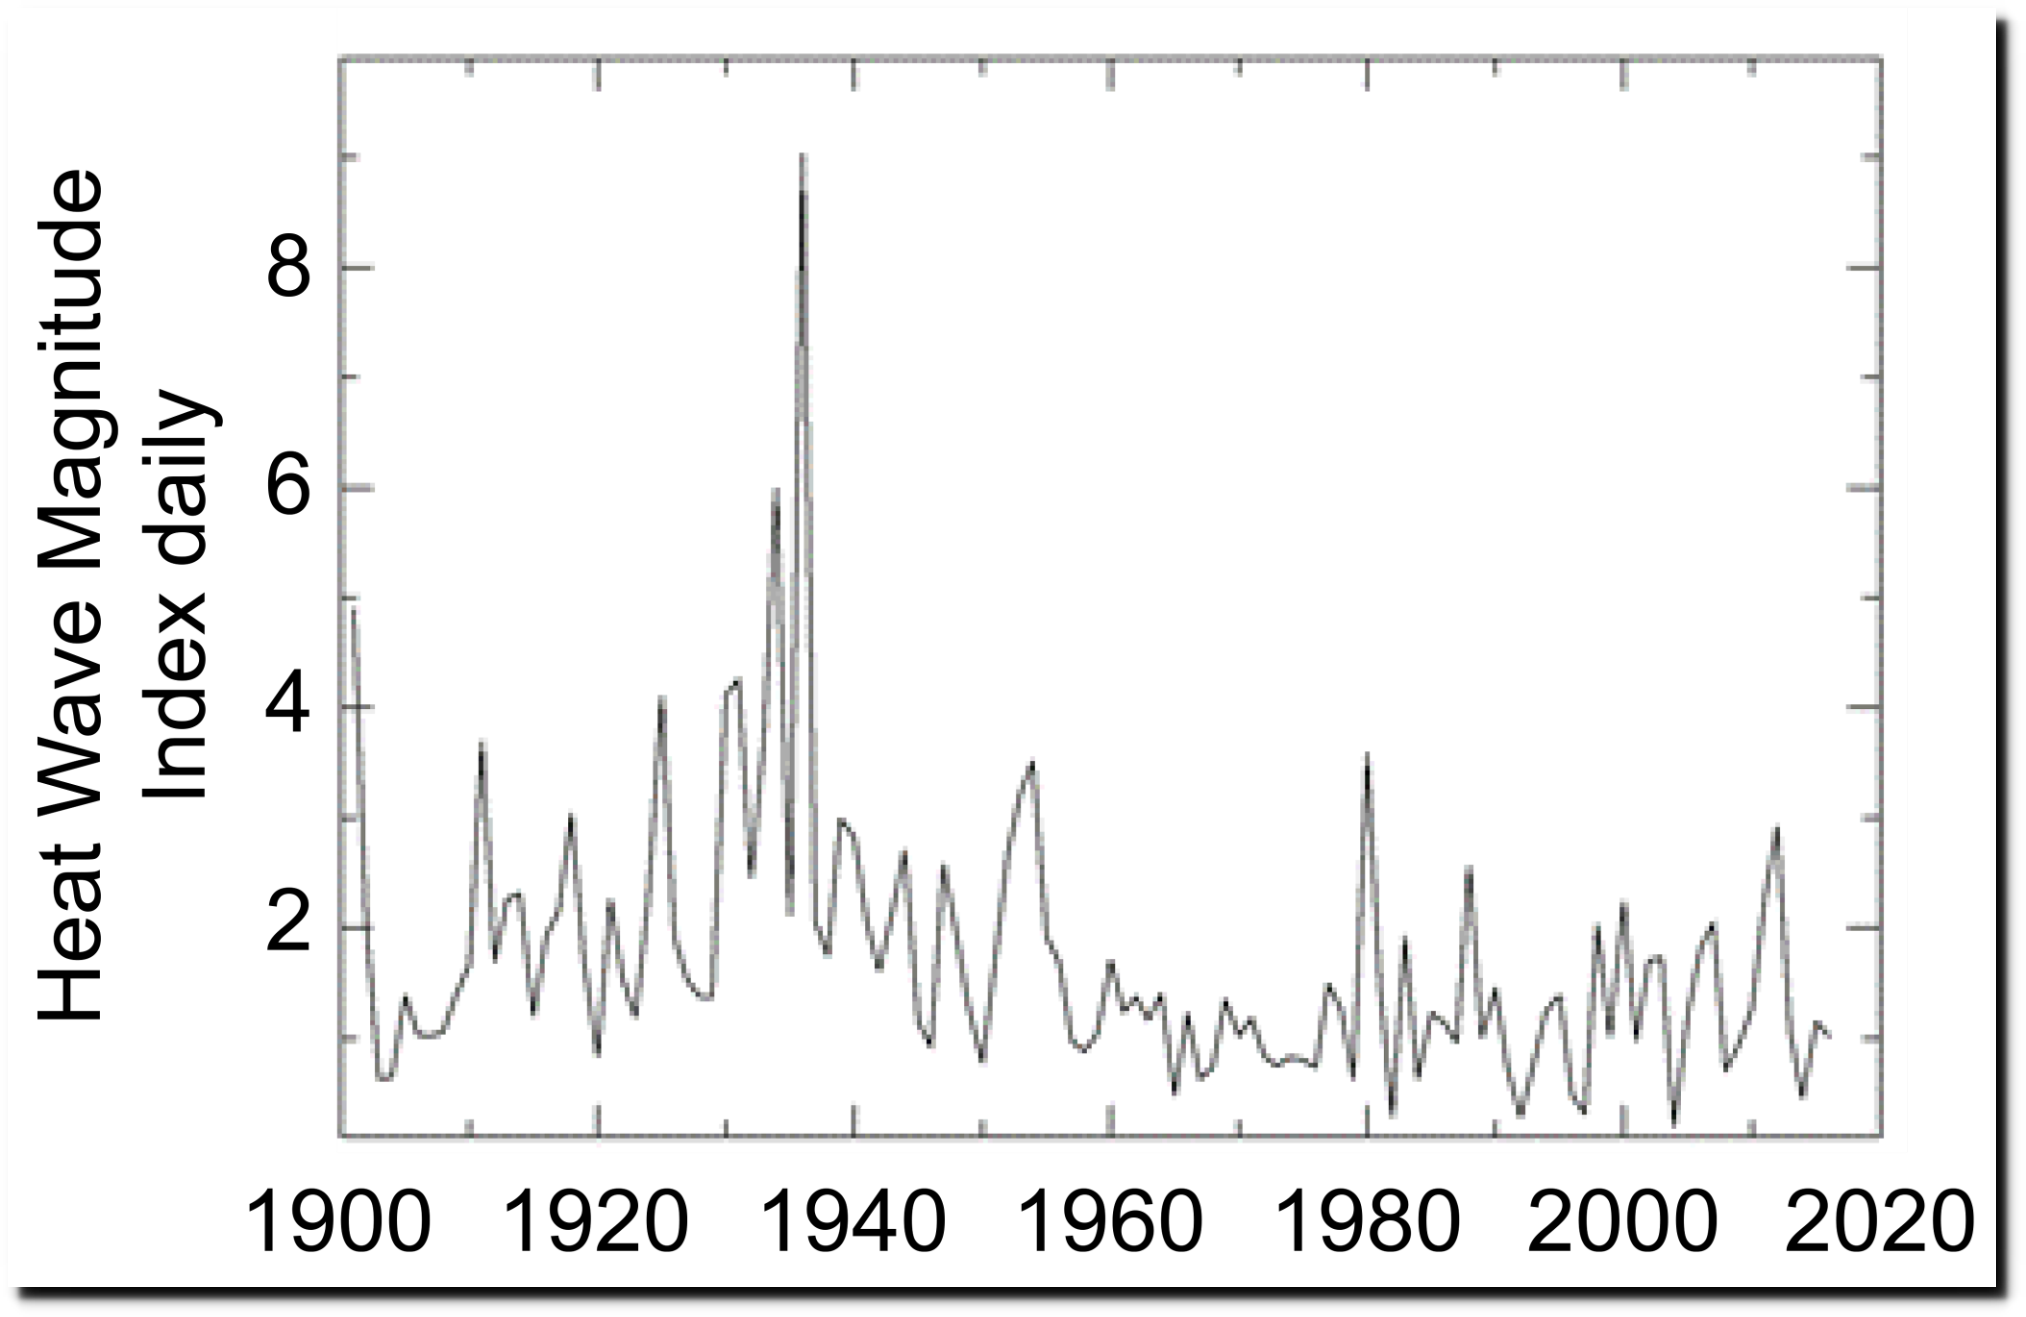
Temperature Changes in the United States – Climate Science Special Report

In 2011, Texas academics predicted that Texas would be hot and dry for the rest of the century.
Texas is vulnerable to warming climate – Houston Chronicle
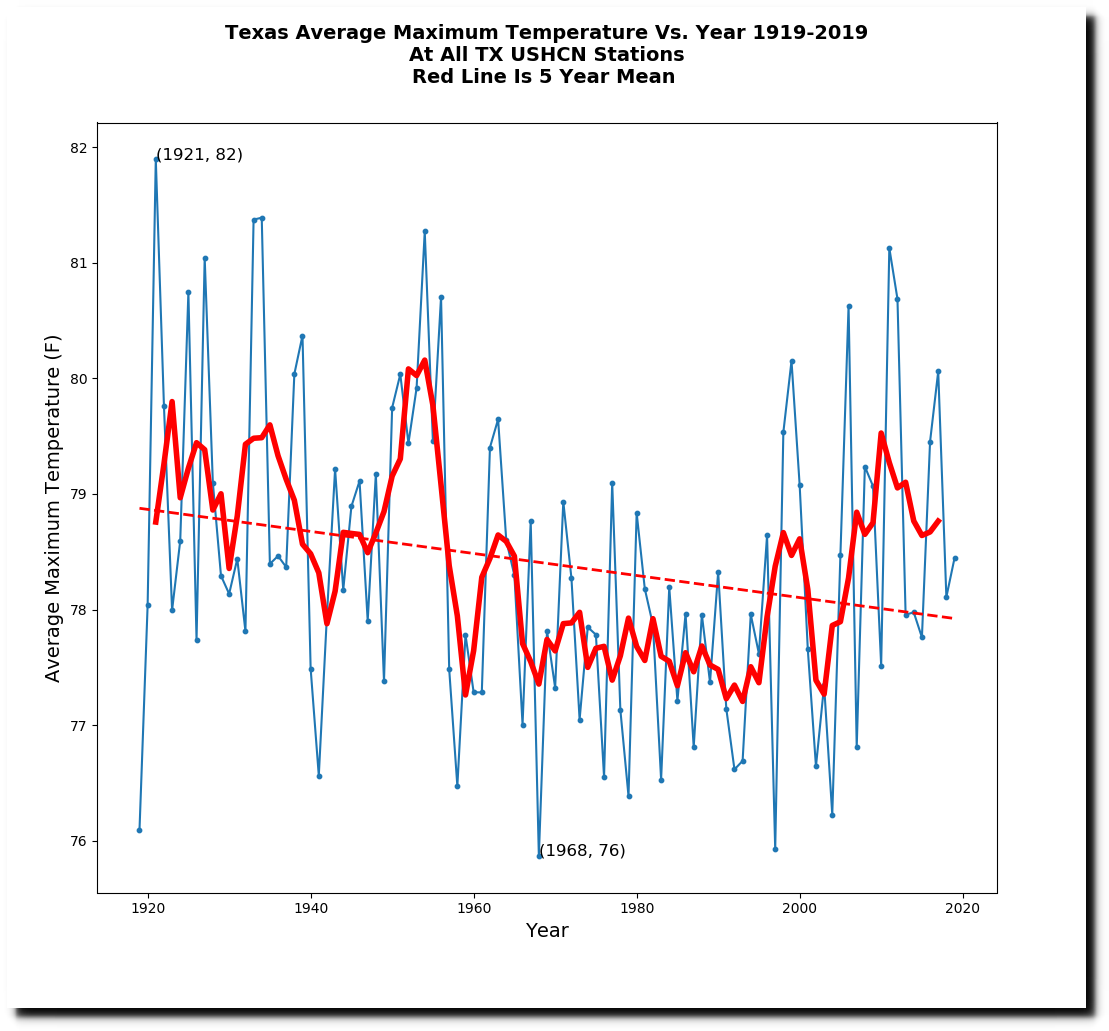
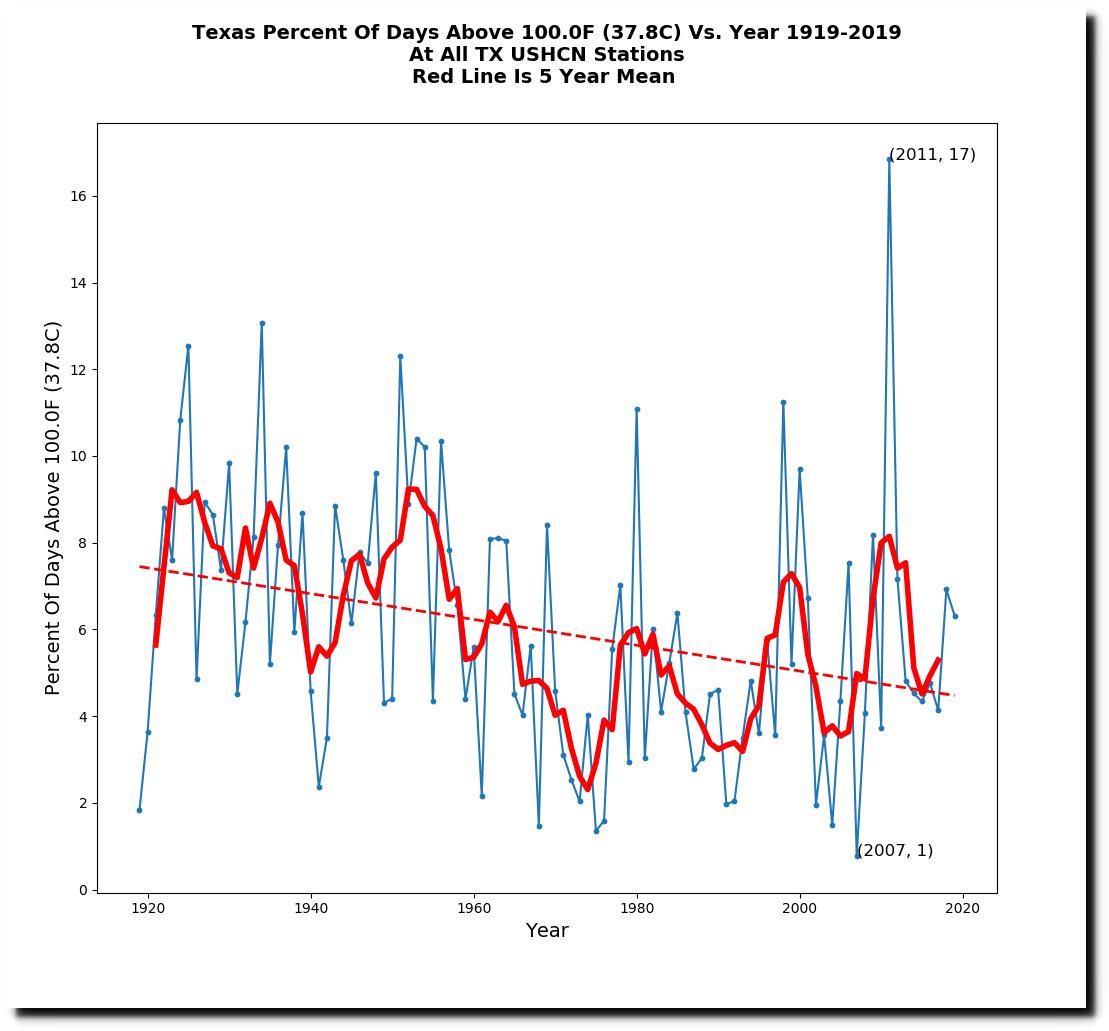
Texas is getting wetter and cooler.
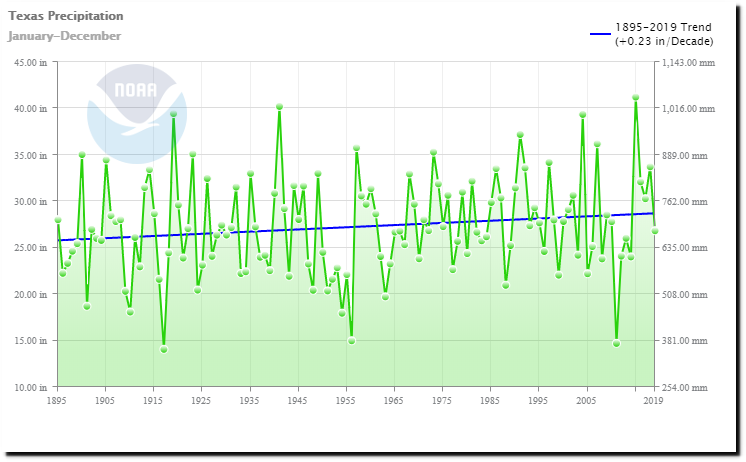
Climate at a Glance | National Centers for Environmental Information (NCEI)
The Maldives are still there.
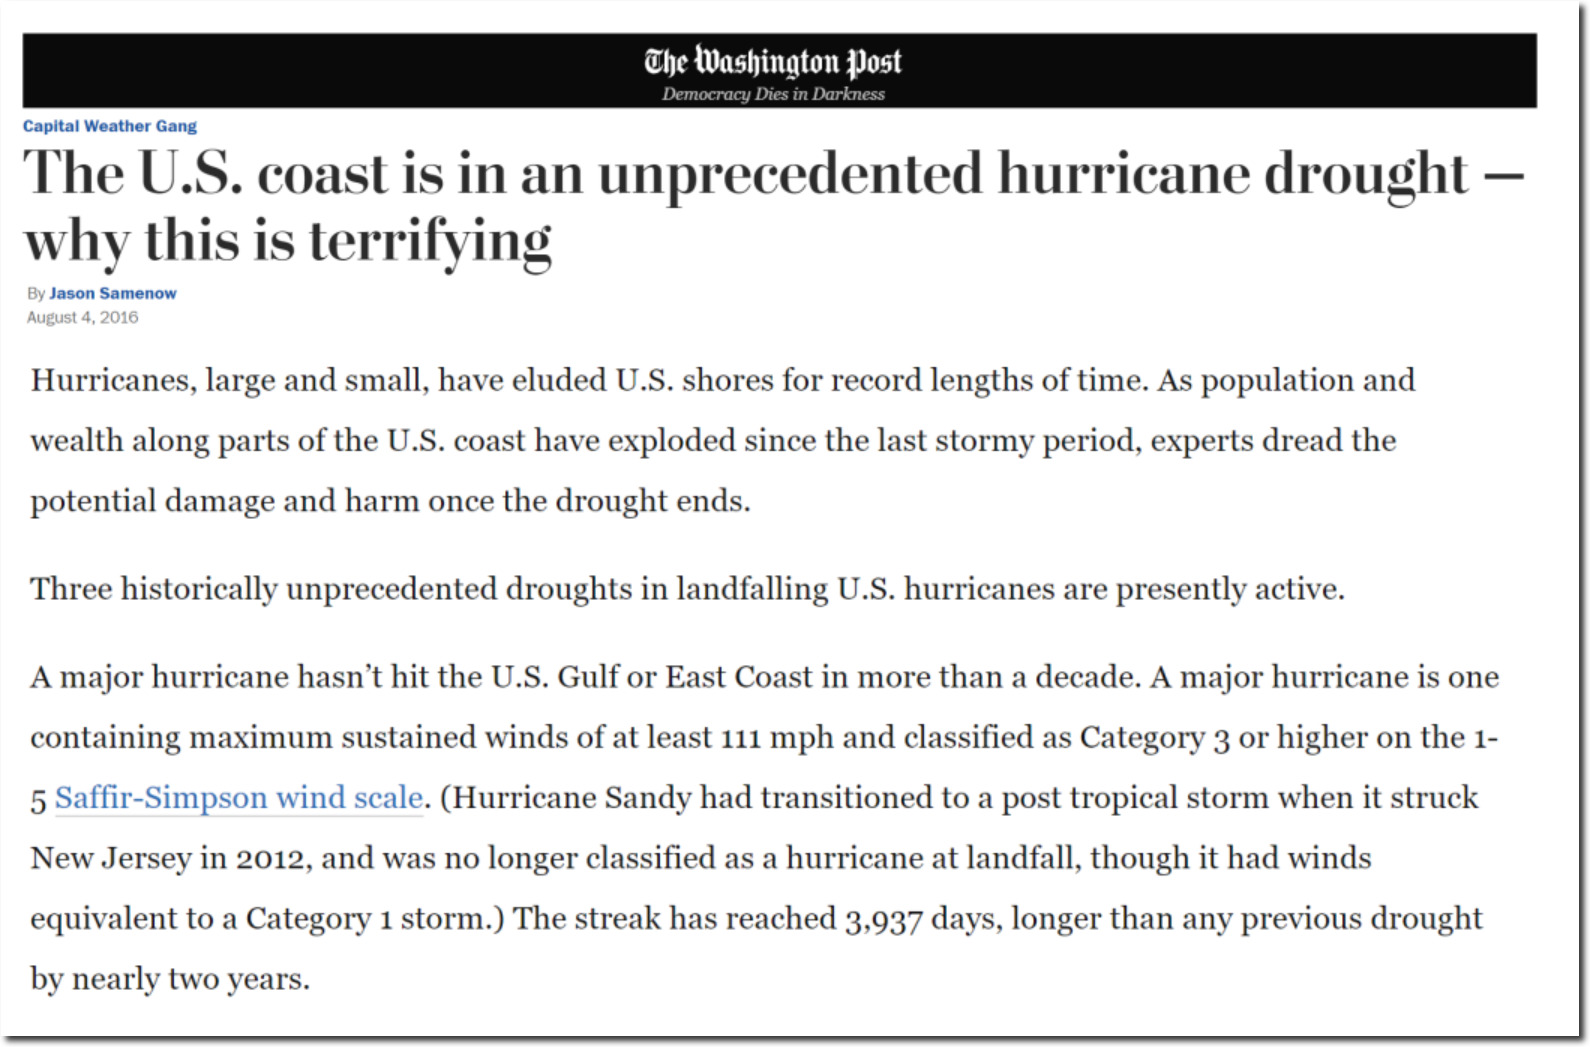
A few years ago, the Washington Post was terrified by the record low number of hurricanes.
And 2018 was the first year with no violent tornadoes in the US.
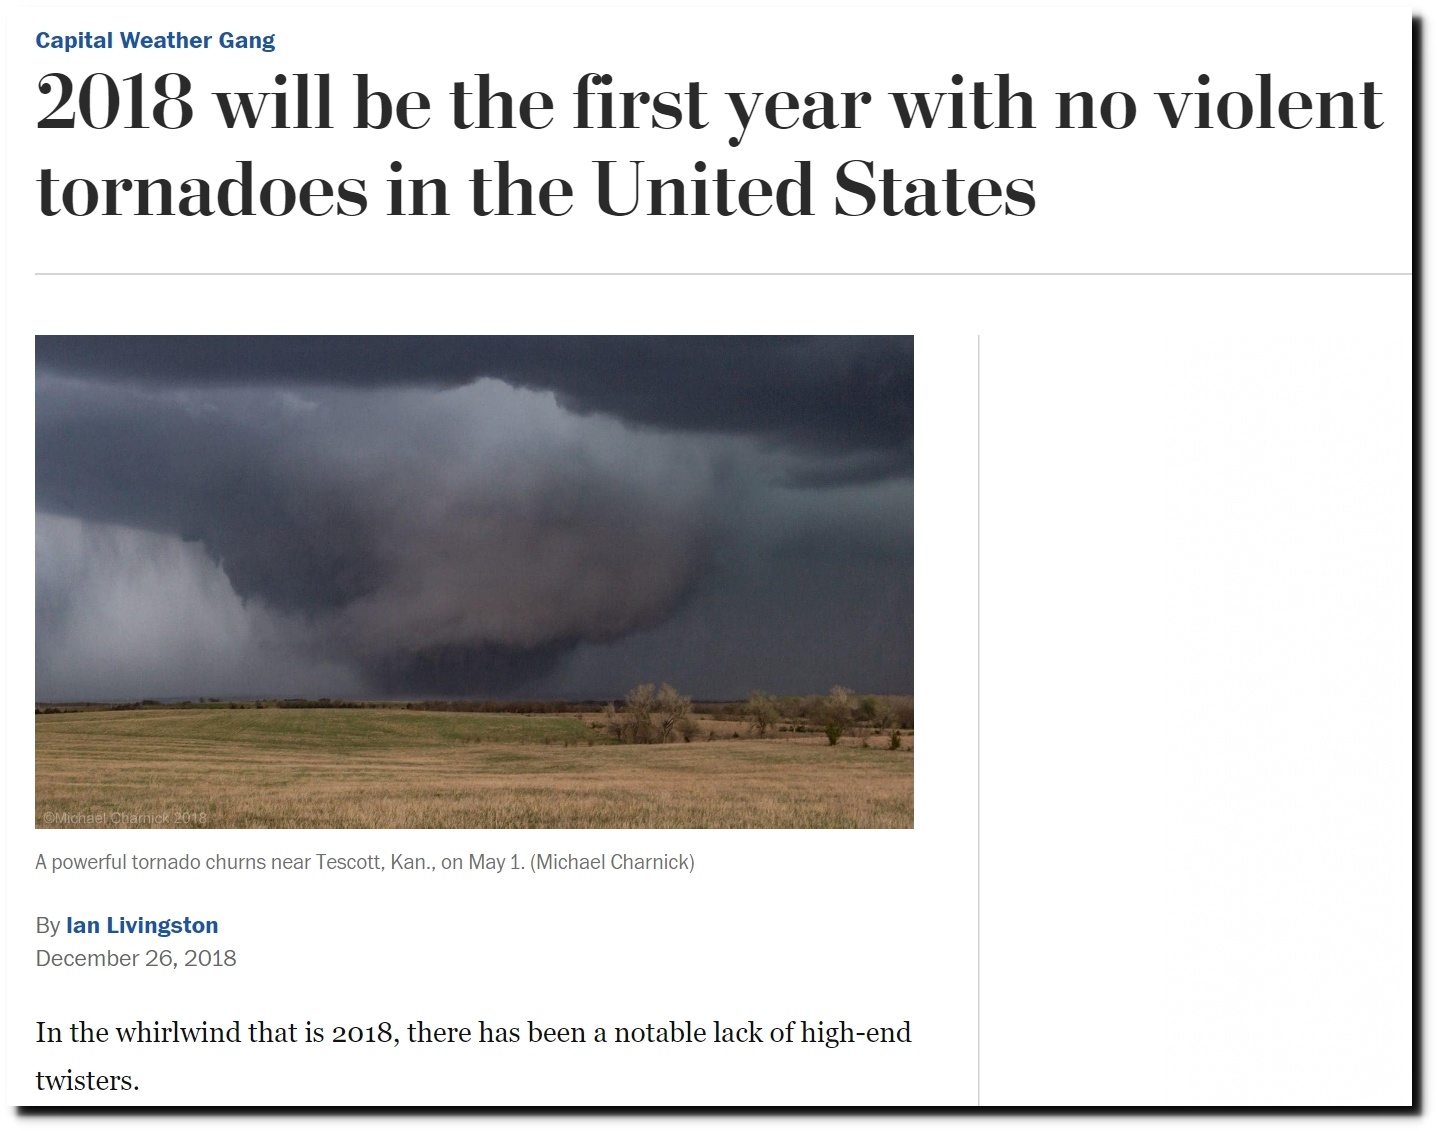
2018 will be the first year with no violent tornadoes in the United States – The Washington Post
Another climate deadline is tomorrow. Congressional Democrats have given YouTube until tomorrow to come with a plan to censor anyone who tells the truth about climate.
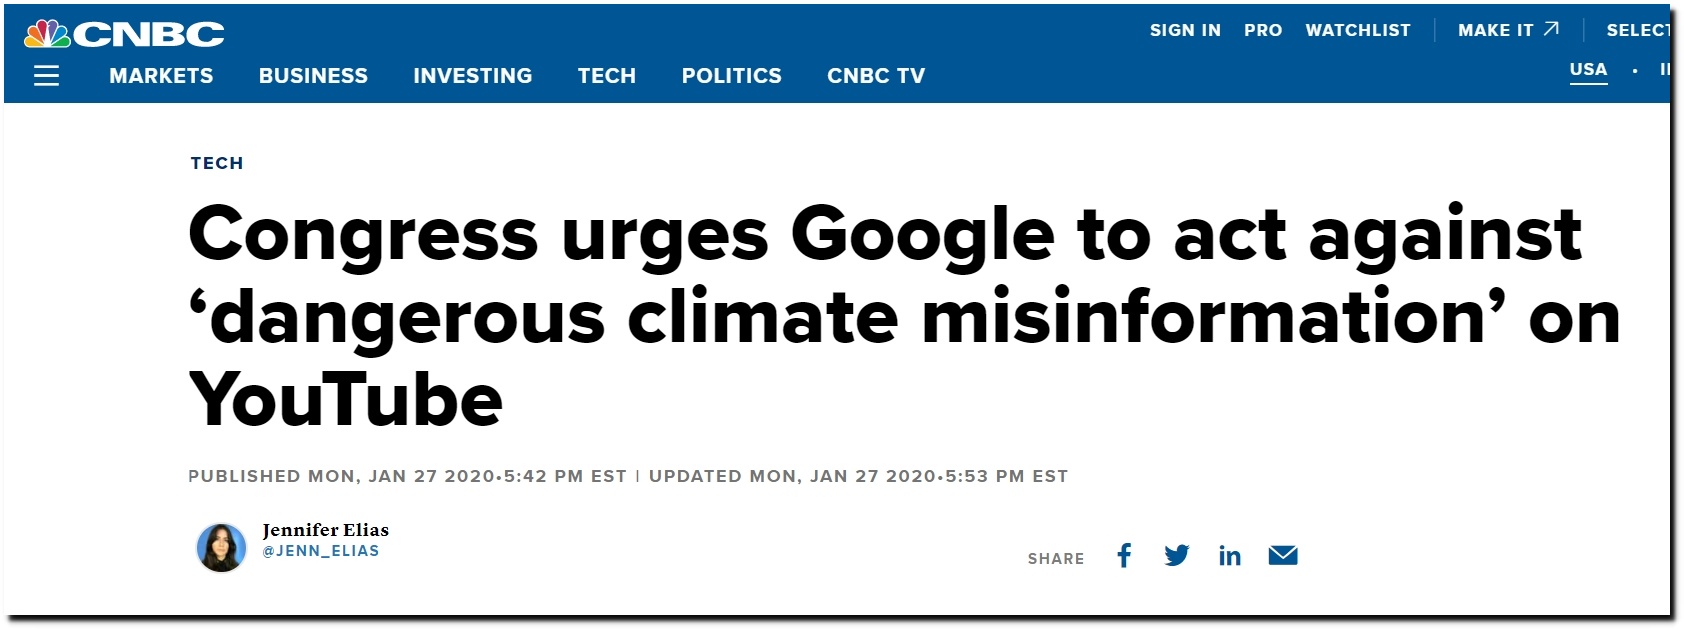
Congress urges Google to act against climate misinformation on YouTube
Nancy wants to tear up my State of The Climate Address.

Pelosi Suffers Multiple Strains, Fractures While Ripping Up Trump’s Speech | The Babylon Bee


