1977 : Drought Blamed On Global Cooling And Expanding Ice Caps

09 Jun 1977, Page 1 – The Daily Inter Lake at Newspapers.com

California Governor Jerry Brown warned of immeasurable disaster.

LOS ANGELES, March 7—Gov. Edmund G. Brown Jr., warned here today that drought?stricken California was “facing a disaster of immeasurable magnitude.” “The specter of drought has been gathering momentum, not only in California, but across the country,” the Democratic Governor declared, adding that people must learn that “this is an era of limits and there are very hard choices to make.”

Brown Warns of Drought Disaster; Says ‘Hard Choices’ Face California – The New York Times

Forty years later, he blamed drought on global warming.

California Braces for Unending Drought – The New York Times

Thanks El Niño, But California’s Drought Is Probably Forever | WIRED

The permanent drought appears to have been short lived, however.

In Mammoth, the snow is so deep residents must tunnel out. There’s a history to that – Los Angeles Times

Posted in Uncategorized | Leave a comment

Parkas And Wool Caps To Protect Themselves From The Heat

Then back inside to warm up in a fossil fuel powered building, and drink a fossil fuel brewed coffee brought over on a fossil fuel powered boat from Brazil – while talking on their fossil fuel powered cell phone.

Posted in Uncategorized | Leave a comment

Climate Experts Gather In London Today

“We are not a cult”

Posted in Uncategorized | Leave a comment

More Record Cold In Boulder

Thursday will be the second October 10th in a row with record cold here in Boulder, Colorado. We have about five inches of snow in the forecast. It will also be a record for earliest day to not get above freezing – the previous record being October 11, 2009.

And the trend has been sharply downwards since CO2 hit 350 PPM.

But for climate scientists at NCAR, it will be just another day of looking at climate models – instead of out their window.

This is how I spent the first day of summer this year in the mountains above Boulder.

Posted in Uncategorized | Leave a comment

New Video : Winter : The White Elephant In The Room

Posted in Uncategorized | Leave a comment

New Video : Smoking Gun Of Temperature Fraud

Posted in Uncategorized | Leave a comment

New Video : Debunking The Debunker

Posted in Uncategorized | Leave a comment

Python3 Script For Getting USHCN Monthly Temperatures

This script gives easy access to USHCN monthly raw, TOBS and Final adjusted temperatures.

Getting the data:
wget ftp://ftp.ncdc.noaa.gov/pub/data/ushcn/v2.5/ushcn.tavg.latest.FLs.52j.tar.gz
wget ftp://ftp.ncdc.noaa.gov/pub/data/ushcn/v2.5/ushcn.tavg.latest.tob.tar.gz
wget ftp://ftp.ncdc.noaa.gov/pub/data/ushcn/v2.5/ushcn.tavg.latest.raw.tar.gz
tar xzvf ushcn.tavg.latest.FLs.52j.tar.gz
tar xzvf ushcn.tavg.latest.tob.tar.gz
tar xzvf ushcn.tavg.latest.raw.tar.gz

wget ftp://ftp.ncdc.noaa.gov/pub/data/ushcn/v2.5/ushcn.tmax.latest.FLs.52j.tar.gz
wget ftp://ftp.ncdc.noaa.gov/pub/data/ushcn/v2.5/ushcn.tmax.latest.tob.tar.gz
wget ftp://ftp.ncdc.noaa.gov/pub/data/ushcn/v2.5/ushcn.tmax.latest.raw.tar.gz
wget http://cdiac.ornl.gov/ftp/ushcn_daily/ushcn-stations.txt
tar xzvf ushcn.tmax.latest.FLs.52j.tar.gz
tar xzvf ushcn.tmax.latest.tob.tar.gz
tar xzvf ushcn.tmax.latest.raw.tar.gz

wget ftp://ftp.ncdc.noaa.gov/pub/data/ushcn/v2.5/ushcn.tmin.latest.FLs.52j.tar.gz
wget ftp://ftp.ncdc.noaa.gov/pub/data/ushcn/v2.5/ushcn.tmin.latest.tob.tar.gz
wget ftp://ftp.ncdc.noaa.gov/pub/data/ushcn/v2.5/ushcn.tmin.latest.raw.tar.gz
tar xzvf ushcn.tmin.latest.FLs.52j.tar.gz
tar xzvf ushcn.tmin.latest.tob.tar.gz
tar xzvf ushcn.tmin.latest.raw.tar.gz

Then cd into the new directory, which will have a new name every day. It will be something like ushcn.v2.5.5.20191004

Example usage:
python3 date.py USH00412679 7 1921 “EAGLE PASS”

Data for July, 1921 at Eagle Pass, Texas.

output:
Raw EAGLE PASS USH00412679 7 1921 37.29 99.12
TOBS EAGLE PASS USH00412679 7 1921 37.16 98.89
Final EAGLE PASS USH00412679 7 1921 35.92 96.66

Last two numbers in each line are Degrees C and Degrees F

You will have to know the station ID of the station you are looking for:
ftp://ftp.ncdc.noaa.gov/pub/data/ushcn/v2.5/ushcn-v2.5-stations.txt

Script :
——————————————————————-

import sys

filename = sys.argv[1]
#print(filename)
#filename = filename.replace("USC", "USH")
#print(filename)
month = int(sys.argv[2])
year = sys.argv[3]
comment = sys.argv[4]

fd = open(filename + ".raw.tmax")

for line in fd :
    #print(line[12:16])
    if (line[12:16] == year) :
        #print(line)
        offset = 18 + (9 * (month - 1))
        #print(line[offset:offset+4])
        temperature_c = float(line[offset:offset+4]) / 100.0
        temperature_f = (temperature_c * 1.8) + 32.0
        print("Raw", comment, filename, month, year, "%.2f" % temperature_c, "%.2f" % temperature_f)

fd = open(filename + ".tob.tmax")

for line in fd :
#print(line[12:16])
    if (line[12:16] == year) :
        #print(line)
        offset = 18 + (9 * (month - 1))
        #print(line[offset:offset+4])
        temperature_c = float(line[offset:offset+4]) / 100.0
        temperature_f = (temperature_c * 1.8) + 32.0
        print("TOBS", comment, filename, month, year, "%.2f" % temperature_c, "%.2f" % temperature_f)

fd = open(filename + ".FLs.52j.tmax")

for line in fd :
    #print(line[12:16])
    if (line[12:16] == year) :
        #print(line)
        offset = 18 + (9 * (month - 1))
        #print(line[offset:offset+4])
        temperature_c = float(line[offset:offset+4]) / 100.0
        temperature_f = (temperature_c * 1.8) + 32.0
        print("Final", comment, filename, month, year, "%.2f" % temperature_c, "%.2f" % temperature_f)

Posted in Uncategorized | Leave a comment

Another Fast Start To Winter

Winter is coming early again this year.  We are expecting five inches of snow here in Boulder on Thursday. Montana had record snow last week. This is the eighth year in a row with above average October snow cover in the Northern Hemisphere.

Rutgers University Climate Lab :: Global Snow Lab

Posted in Uncategorized | Leave a comment

Smoking Gun Of Fraud In USHCN Adjustments

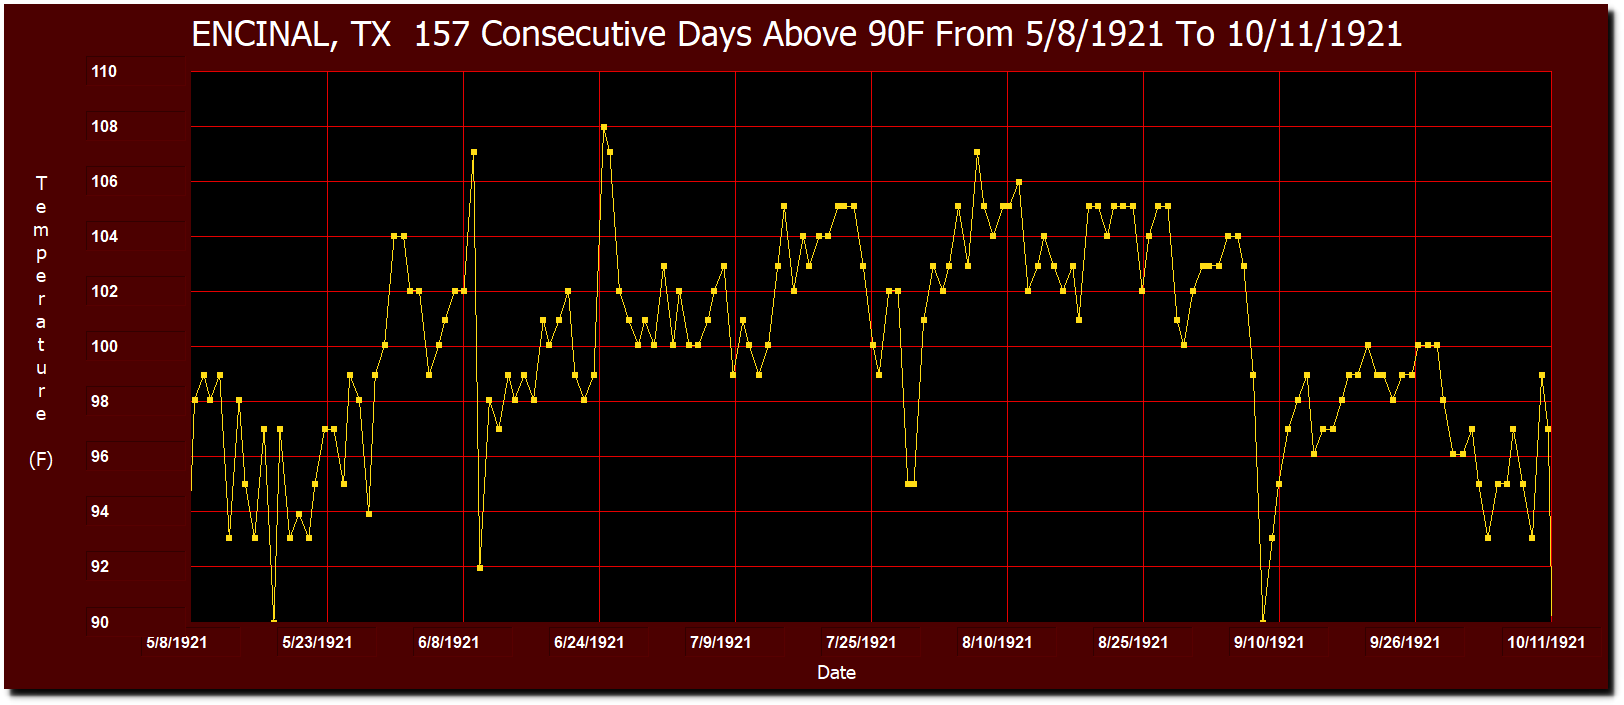
Texas had their longest heatwave at Encinal in 1921, with 157 consecutive days above 90F from May 8 to October 11, 1921.

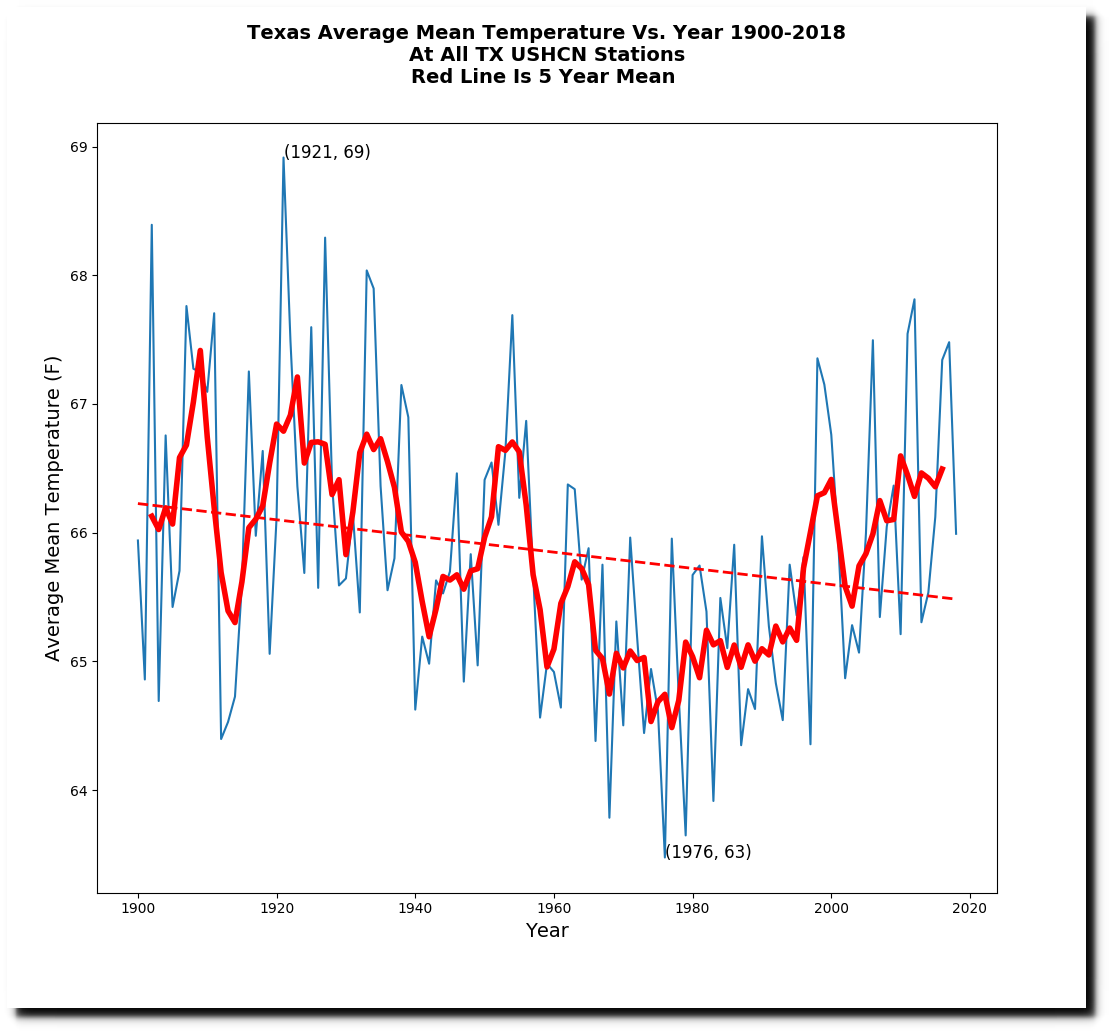
The NOAA USHCN thermometer data for Texas shows 1921 as the hottest year, with Texas cooling since 1895.

Yet the NOAA NCEI graph for Texas shows Texas warming, and 1921 as not being a particularly hot year.

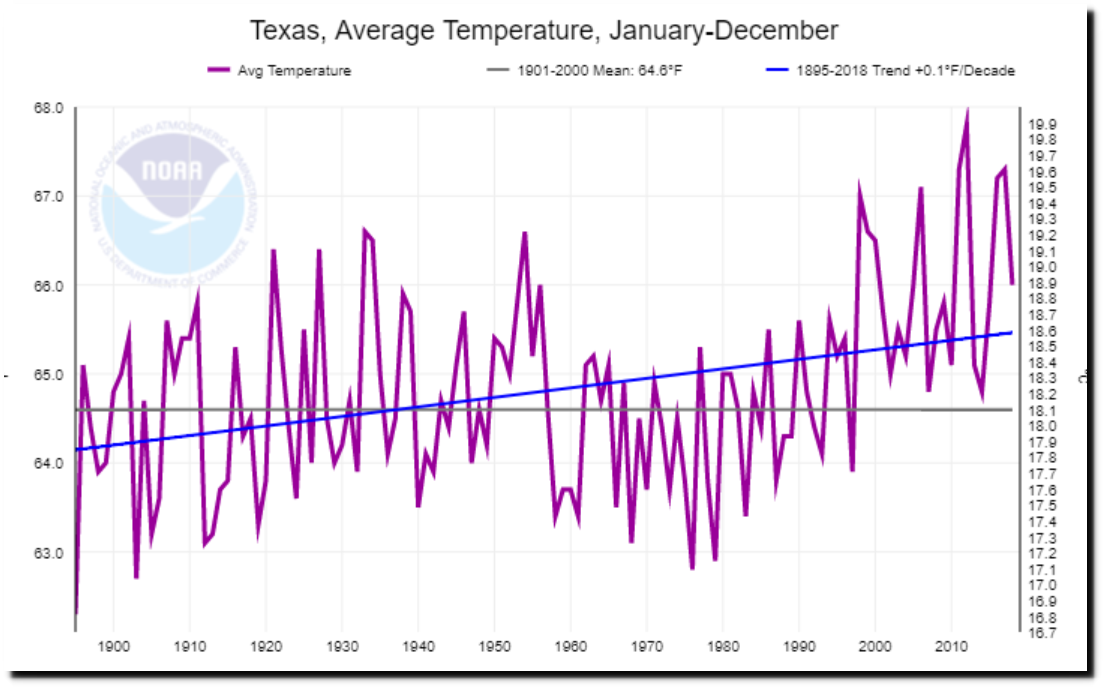
Climate at a Glance | National Centers for Environmental Information (NCEI)

This is very different from their 2012 version of the same graph, which showed 1921 as the hottest year, and no warming.

Climate scientists who have been claiming Texas is warming are totally wrong. | Watts Up With That?

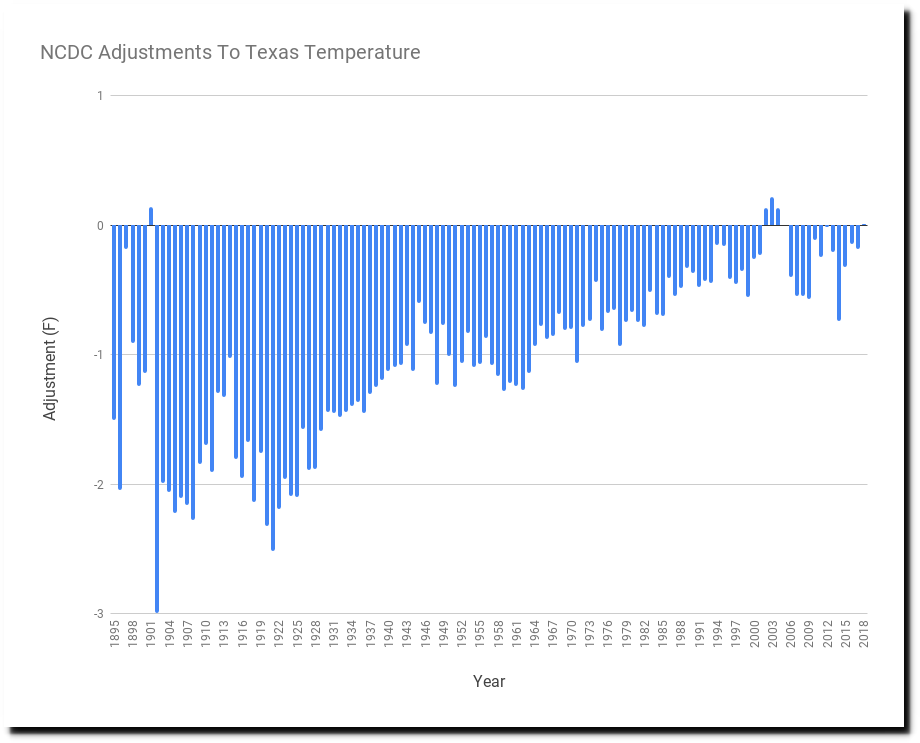
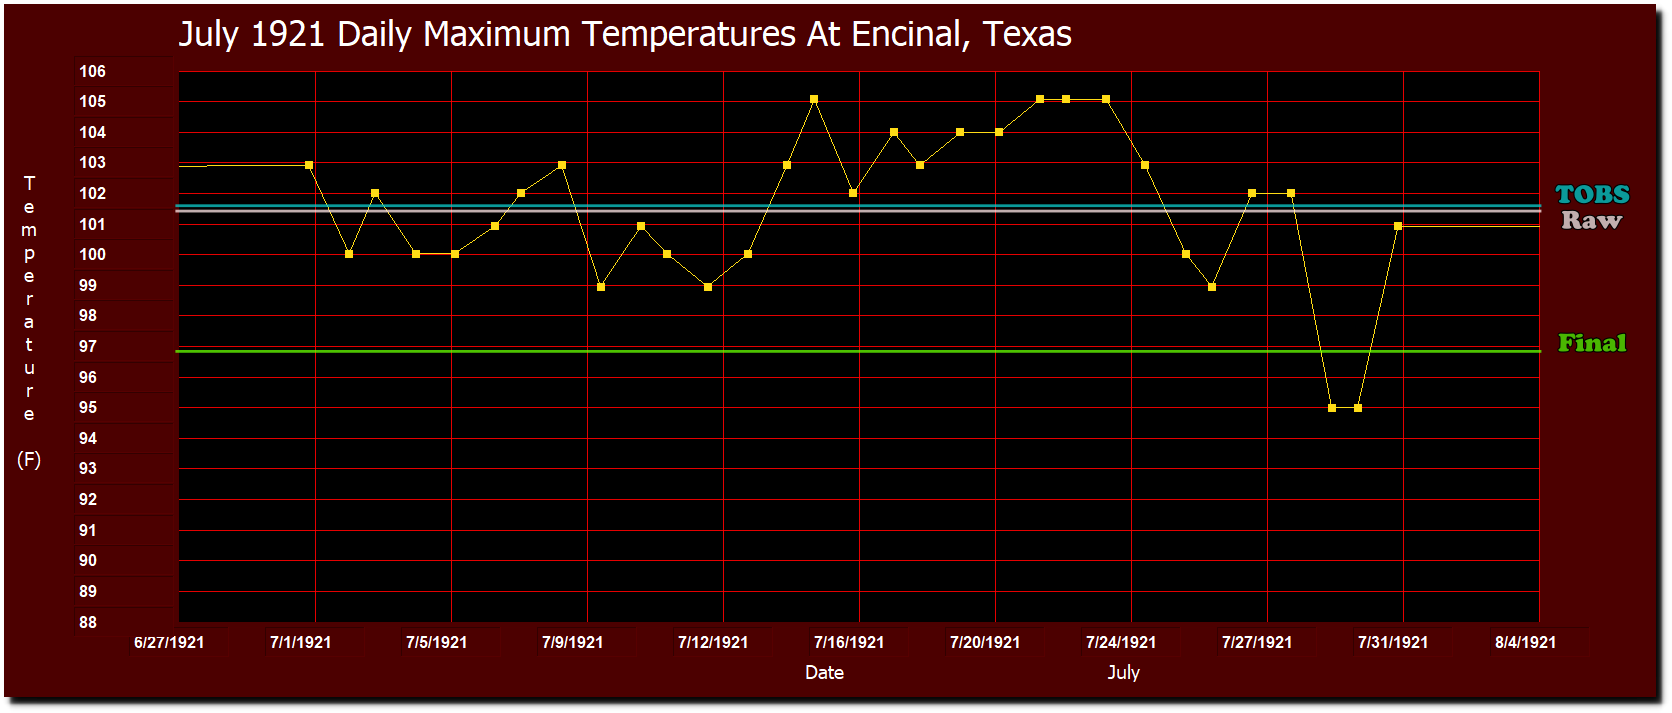
This got me wondering – how did NOAA recently erase the record heat of 1921 in Texas? So I looked at the Raw, TOBS (Time of Observation Bias Adjusted) and Final Adjusted monthly maximum temperatures for Encinal, Texas in July, 1921.

During that month, temperatures at Encinal were recorded at 7am, and the TOBS adjusted data has the highest monthly average at 101.6F.  The Raw temperature average is 101.5F, but the Final Adjusted average is 4.6F cooler at 96.9 degrees. Note that nothing in the graph below is calculated – all of the data being plotted is taken directly from the NOAA USHCN daily and monthly data sets.

The Final adjusted monthly maximum average of 96.9F is cooler than 29 out of 31 daily maximum temperatures at Encinal.

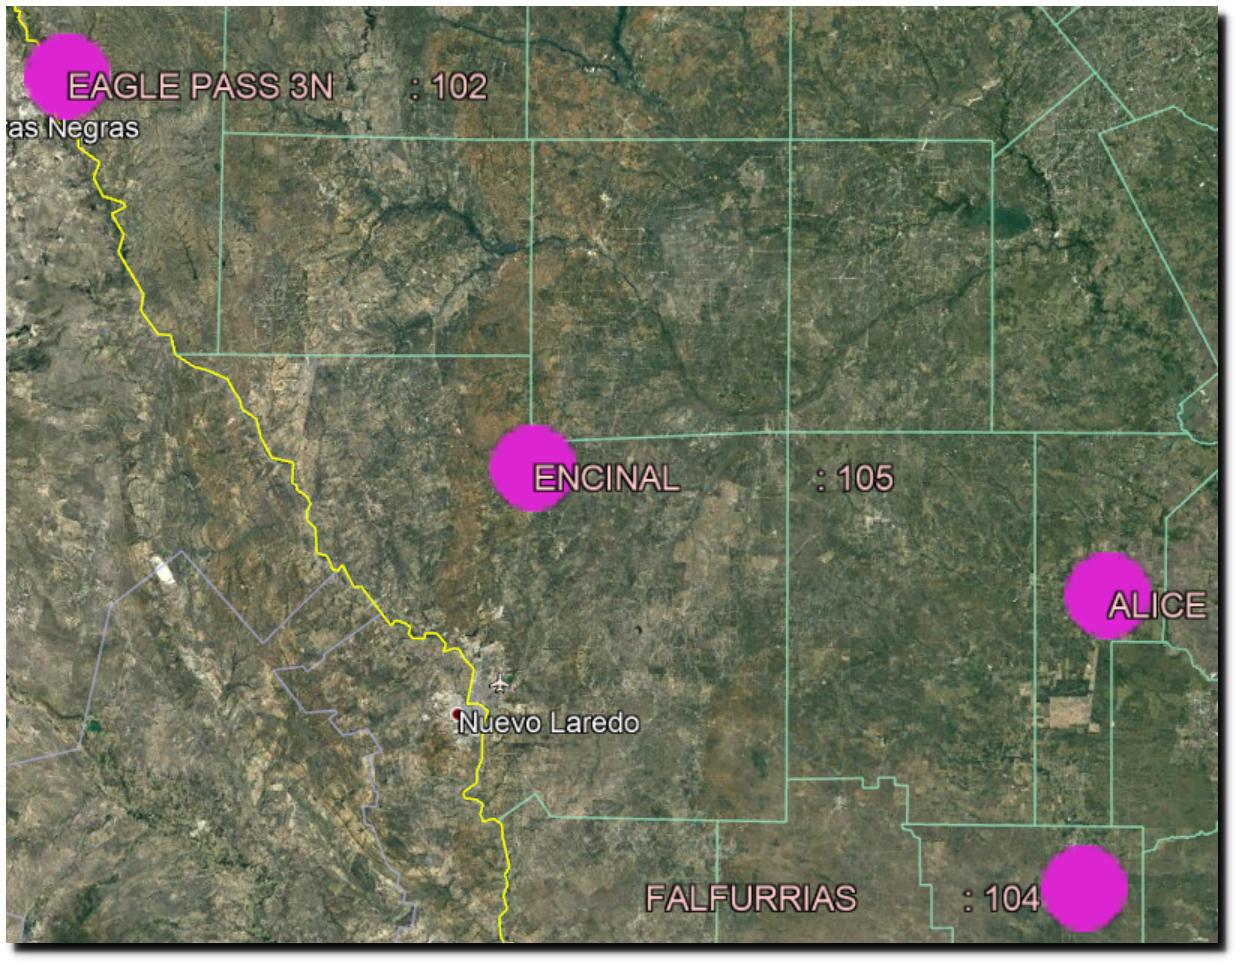
Encinal’s neighboring USHCN stations which reported for the full month of July, 1921 are Falfurrias, Eagle Pass, and Alice, Texas.

Falfurrias is a similar story. All but two of the days were above the final adjusted temperature, which was 5.8 degrees cooler than the measured temperature and 5.5 degrees cooler than the TOBS adjusted temperature.

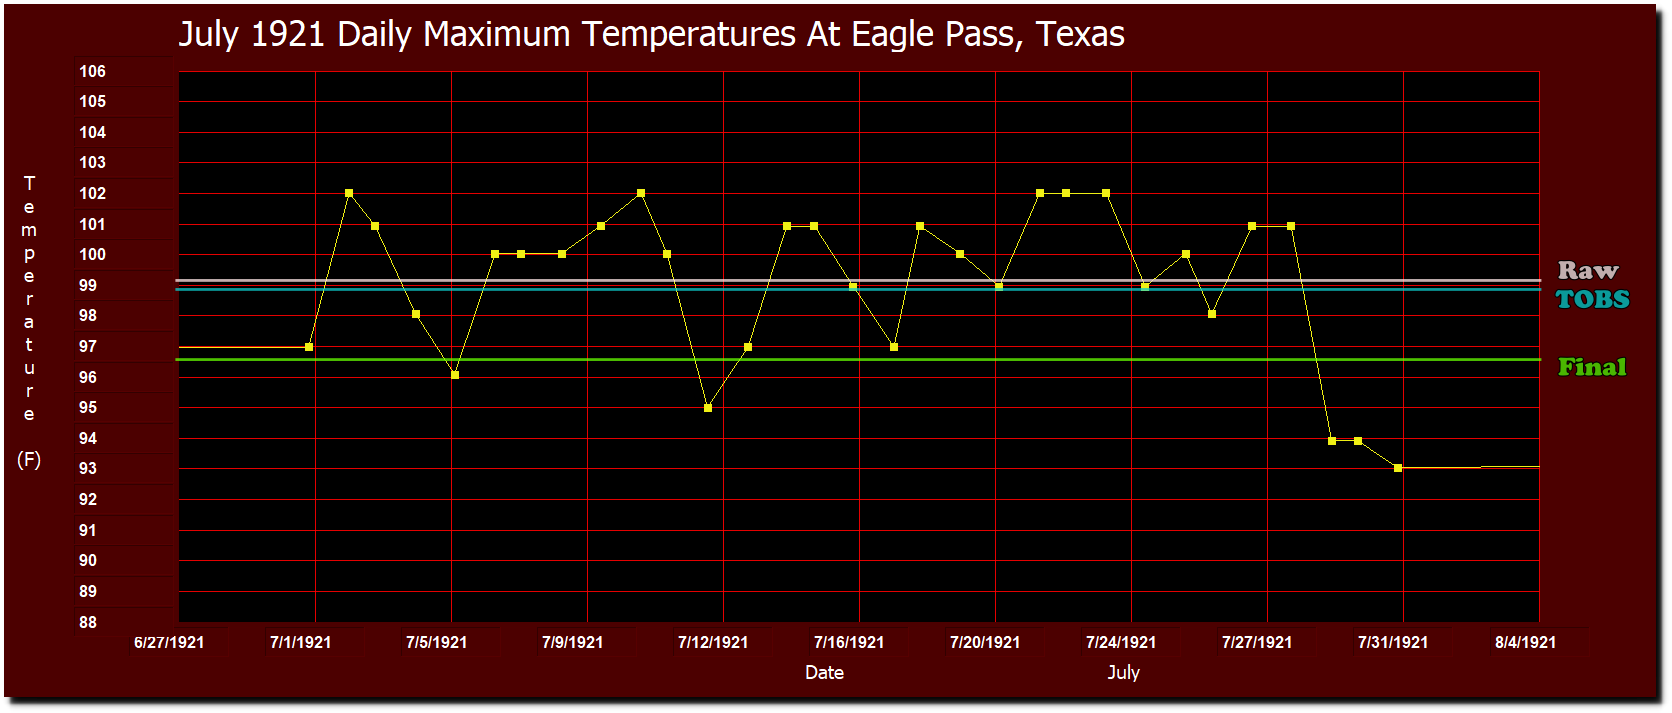
At Eagle Pass, all but five of the days were above the final adjusted temperature, which was 2.4 degrees cooler than the measured temperature and 2.2 degrees cooler than the TOBS adjusted temperature.

At Alice, all but eight of the days were above the final adjusted temperature, which was 2.3 degrees cooler than the measured temperature and 2.4 degrees cooler than the TOBS adjusted temperature.

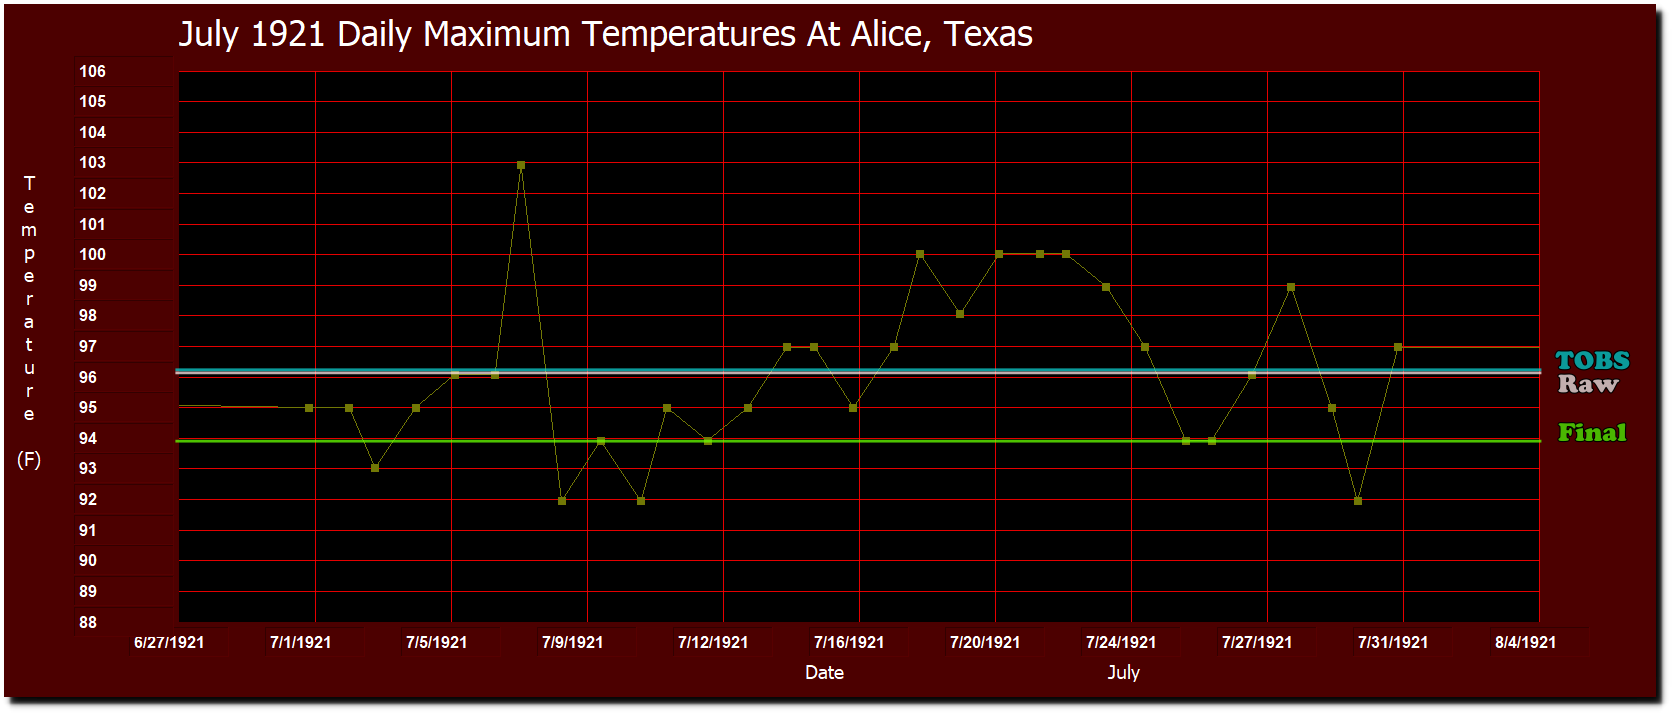
So you can’t explain the adjustments by Time of Observation bias adjustments, and you can’t explain them by homogenization either – because all of the neighbors show the same pathological symptoms.

This is science and mathematics at its absolute worst. NOAA is making a farce out of climate science with this sort of mathematical nonsense.

The only legitimate explanation for this is that the Final adjusted data is fraudulent.  And it is clear from the changes to NOAA Texas graphs that this is occurring all over Texas. Across the entire state of Texas, 1921 temperatures are adjusted downwards by an average of 2.5 degrees. There is no plausible explanation for why this is being done.

Posted in Uncategorized | Leave a comment