

Disrupting the Borg is expensive and time consuming!

Google Search
-
Recent Posts
- One Atomic Bomb Per Hour
- New Video : Analyzing Oil And Gas
- Is Antarctica Melting?
- High Speed Analysis And Visualization
- El Nino To The Rescue?
- Fake News Update
- Growth Of Antarctic Sea Ice
- 65 Years Of Progress!
- El Nino To The Rescue?
- Worst March Drought On Record
- ChartGL Process Control Demo
- The Biggest Money Laundering Scam
- Drought In The Headwaters Of Lake Powell
- Unrealistic Expectations Of Water Availability
- Did Bill Gates Do This?
- Worst March Drought On Record In The US
- The Real Hockey Stick Graph
- Analyzing The Western Water Crisis
- Gaslighting 1924
- “Why Do You Resist?”
- Climate Attribution Model
- Fact Checking NASA
- Fact Checking Grok
- Fact Checking The New York Times
- New Visitech Features
Recent Comments
- Bob G on One Atomic Bomb Per Hour
- Robertvd on One Atomic Bomb Per Hour
- czechlist on One Atomic Bomb Per Hour
- conrad ziefle on One Atomic Bomb Per Hour
- conrad ziefle on One Atomic Bomb Per Hour
- D. Boss on One Atomic Bomb Per Hour
- D. Boss on One Atomic Bomb Per Hour
- Gordon Vigurs on One Atomic Bomb Per Hour
- Gordon Vigurs on One Atomic Bomb Per Hour
- Gordon Vigurs on One Atomic Bomb Per Hour
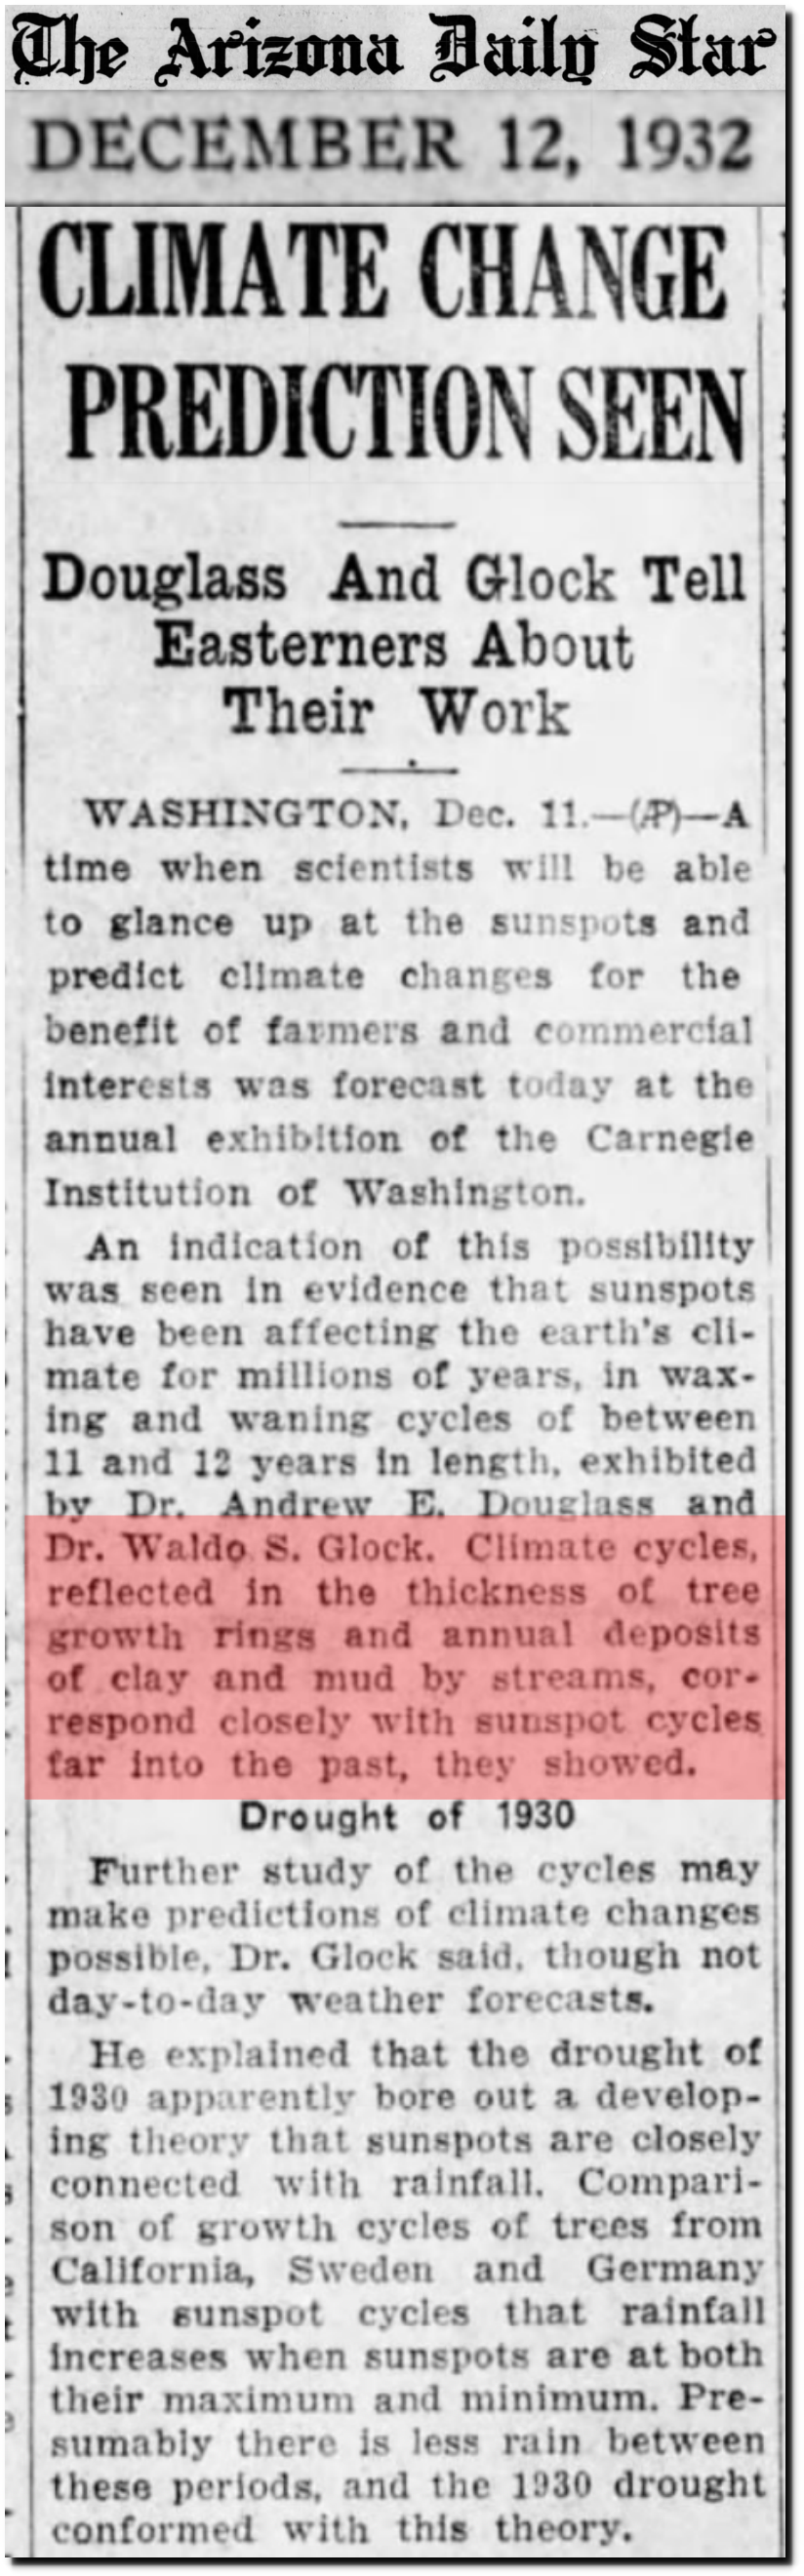
1930 : Climate Cycles Correspond Closely With Sunspot Cycles
Posted in Uncategorized
Leave a comment
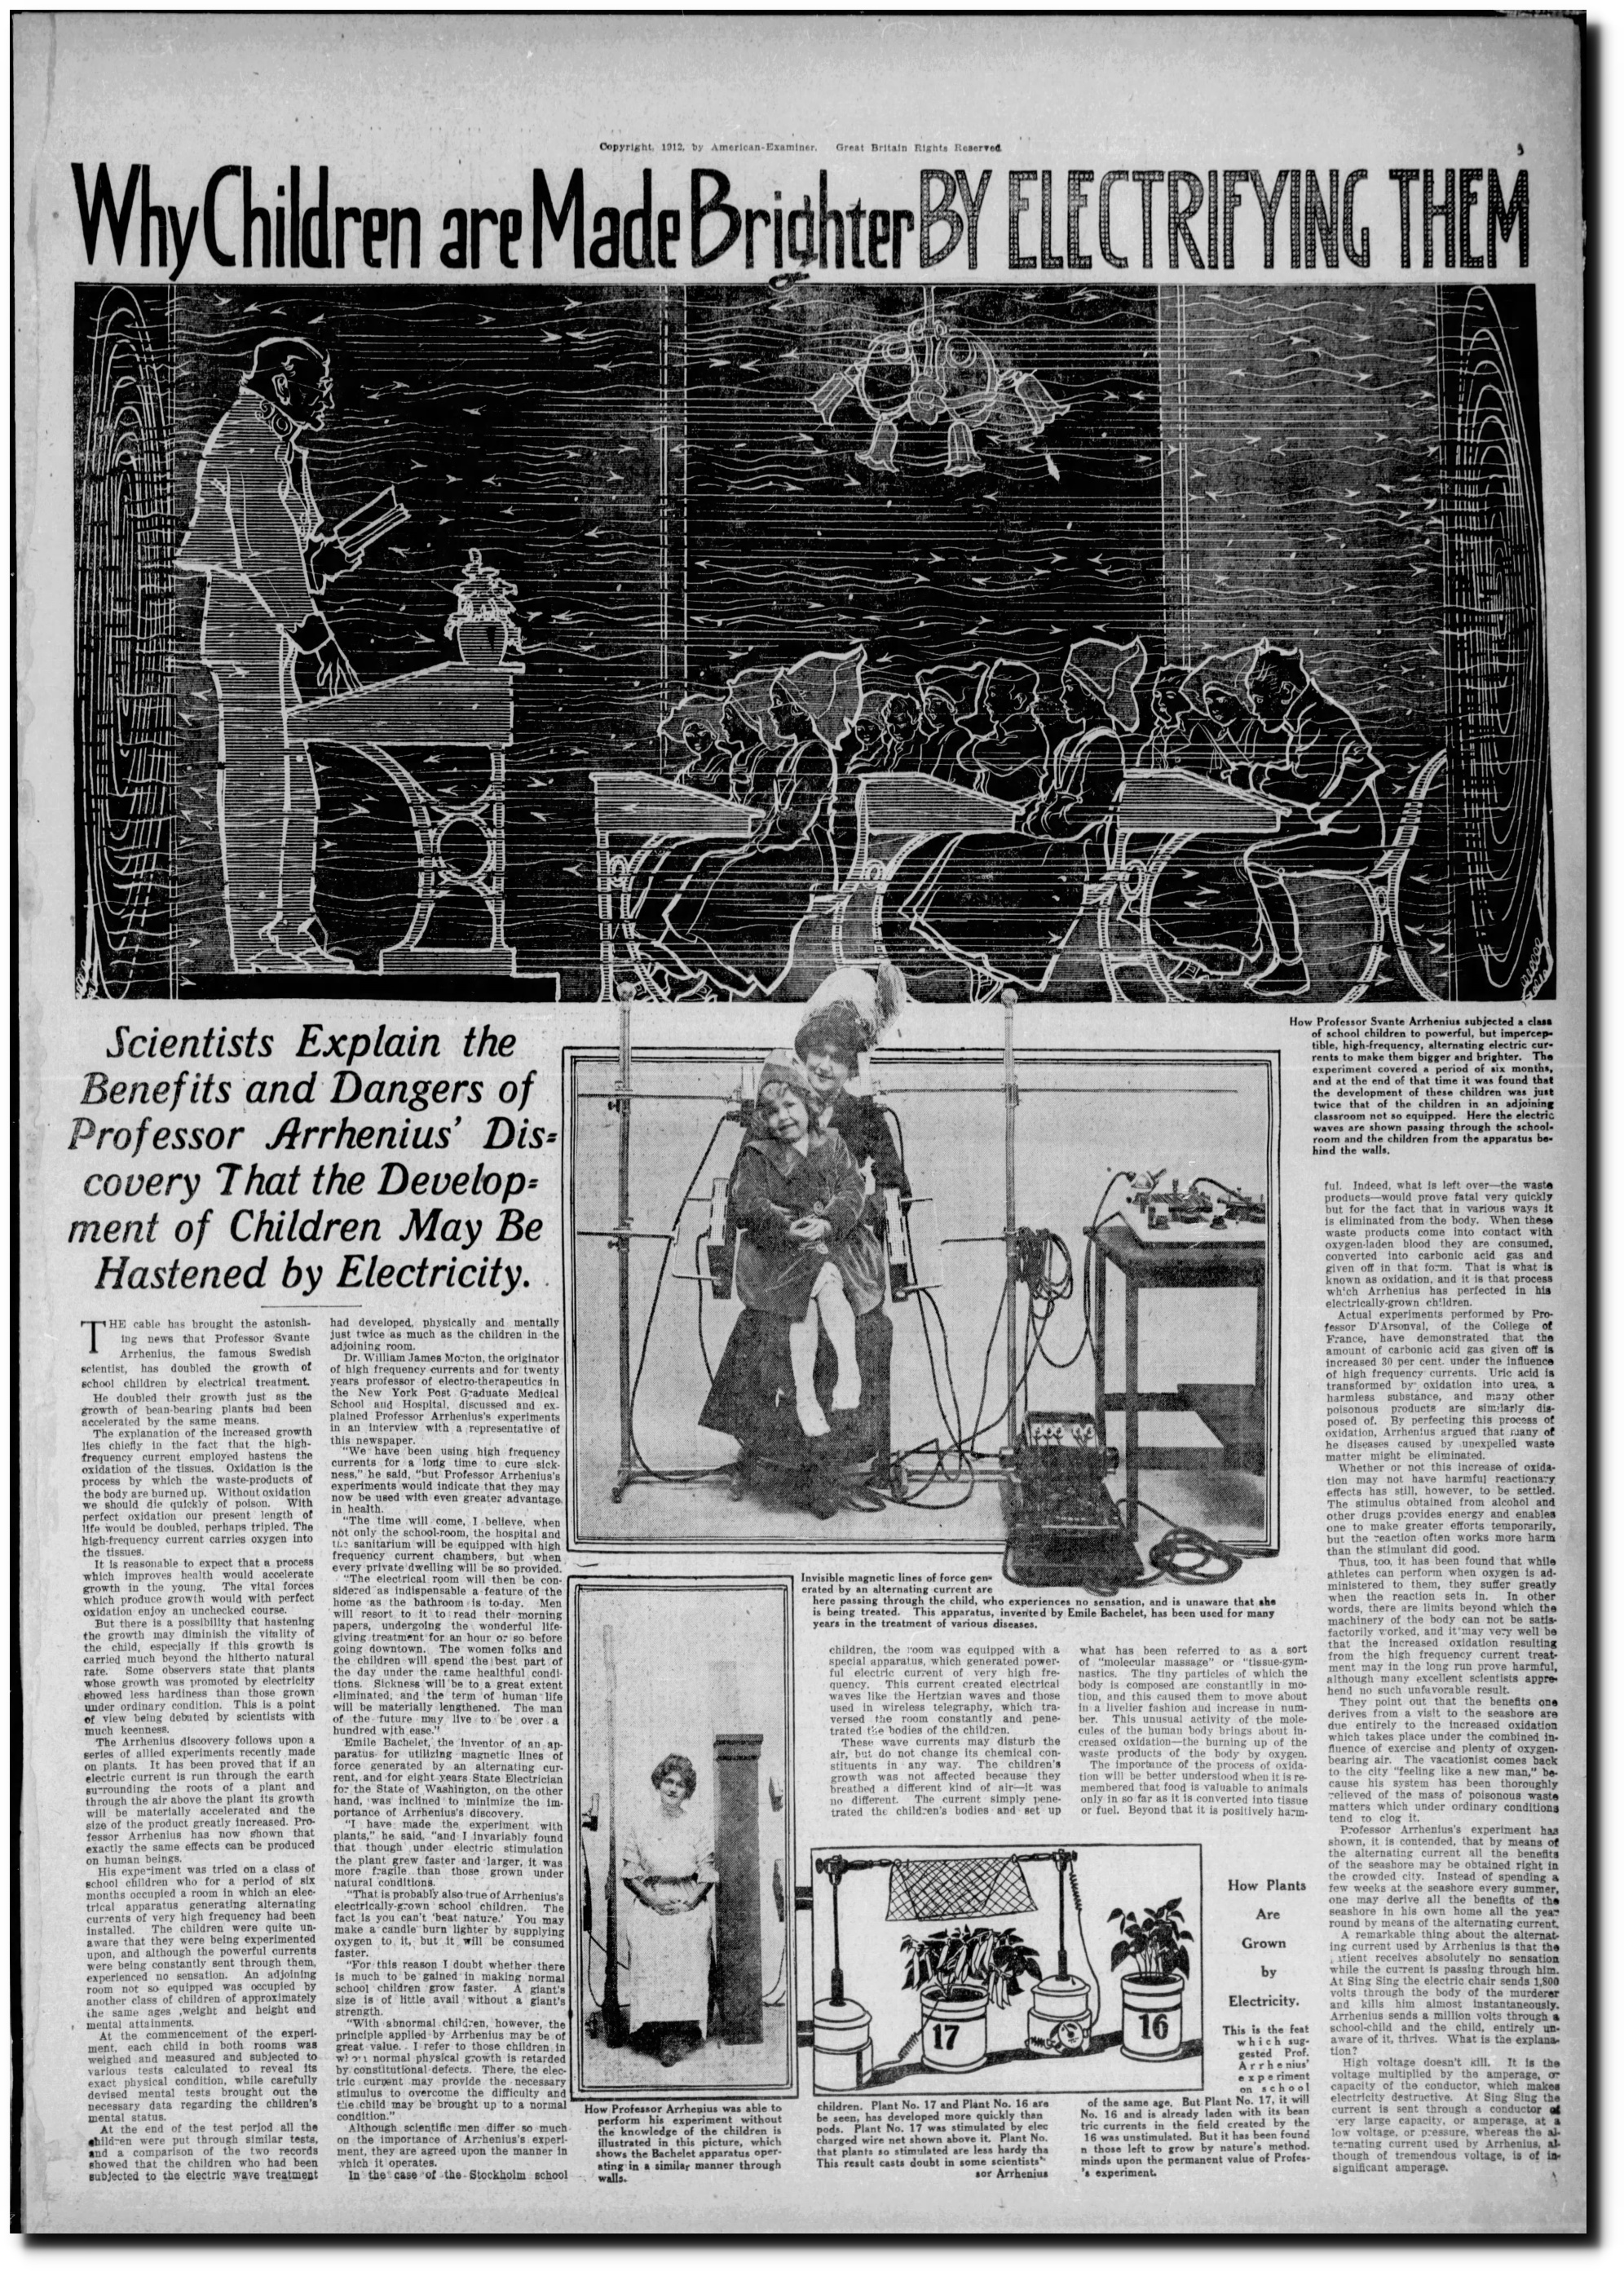
Greta’s Relative Believed That Electrocuting Children Made Them Smarter
Greta Thunberg is a distant relative of Svante Arrhenius, father of the global warming delusion. And her father (Svante) was named after him.
Arrhenius believed that electrocuting children made them smarter.
28 Apr 1912, 19 – The San Francisco Examiner at Newspapers.com
He predicted Siberia would become the greatest farming country on earth.
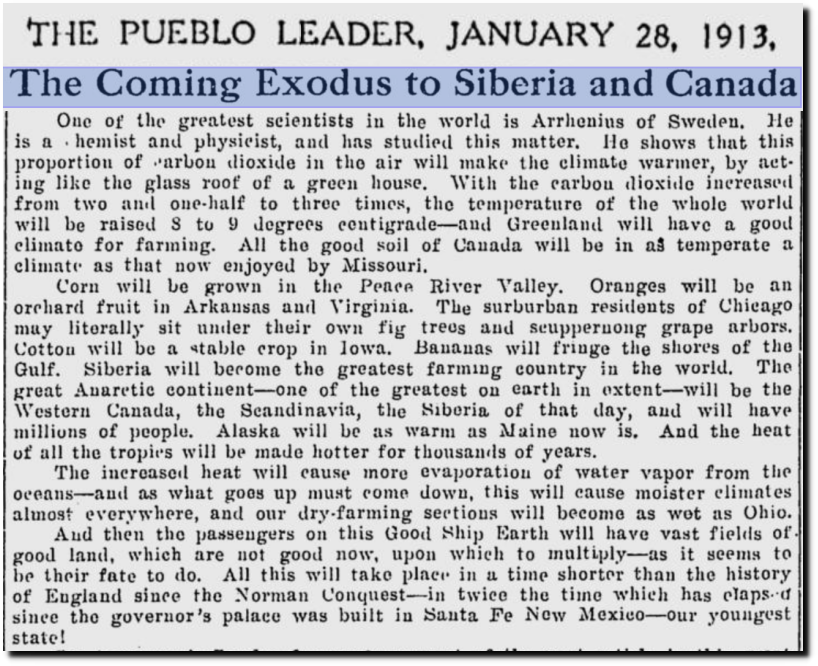
The Pueblo Leader – Google News Archive Search
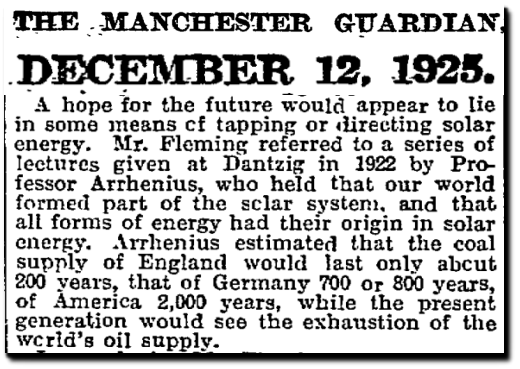
And he said the world would run out of oil in the middle of the last century, so we would have to use solar.
Posted in Uncategorized
Leave a comment
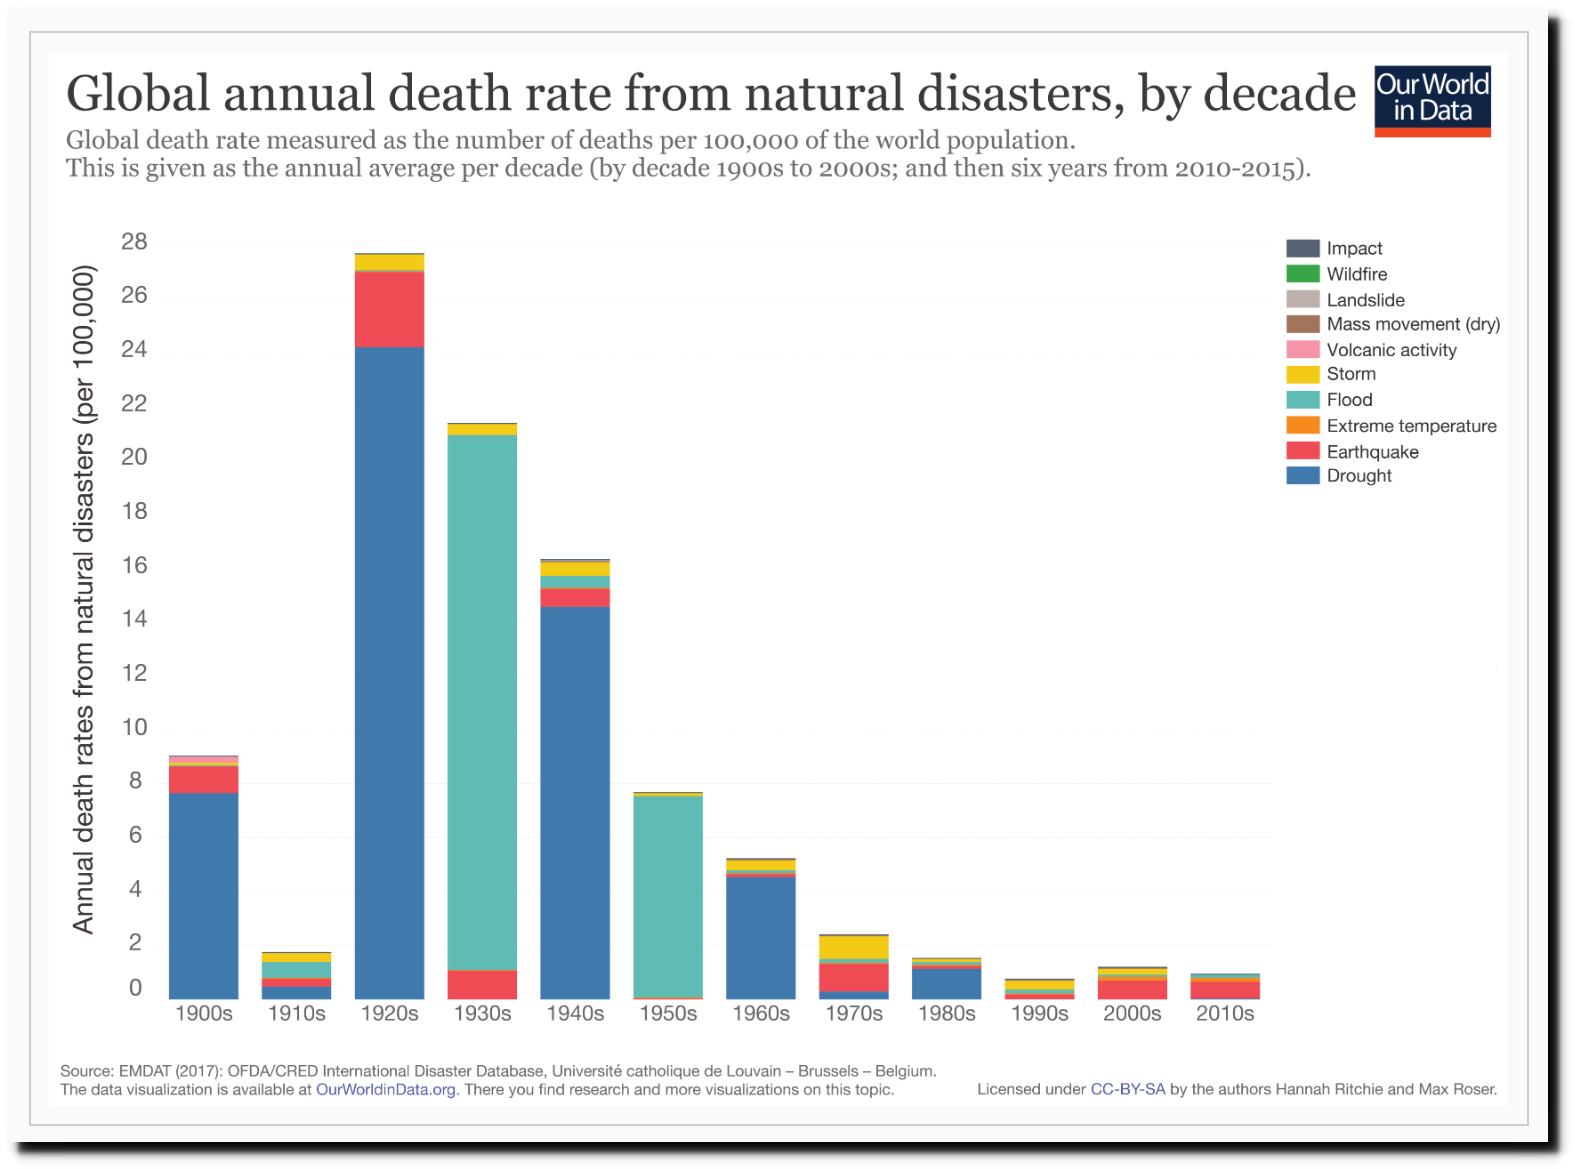
Our World In Fake Data
Oxford University shows a huge increase in reported natural disasters since 1900, including twelve in 1927.

Natural Disasters – Our World in Data
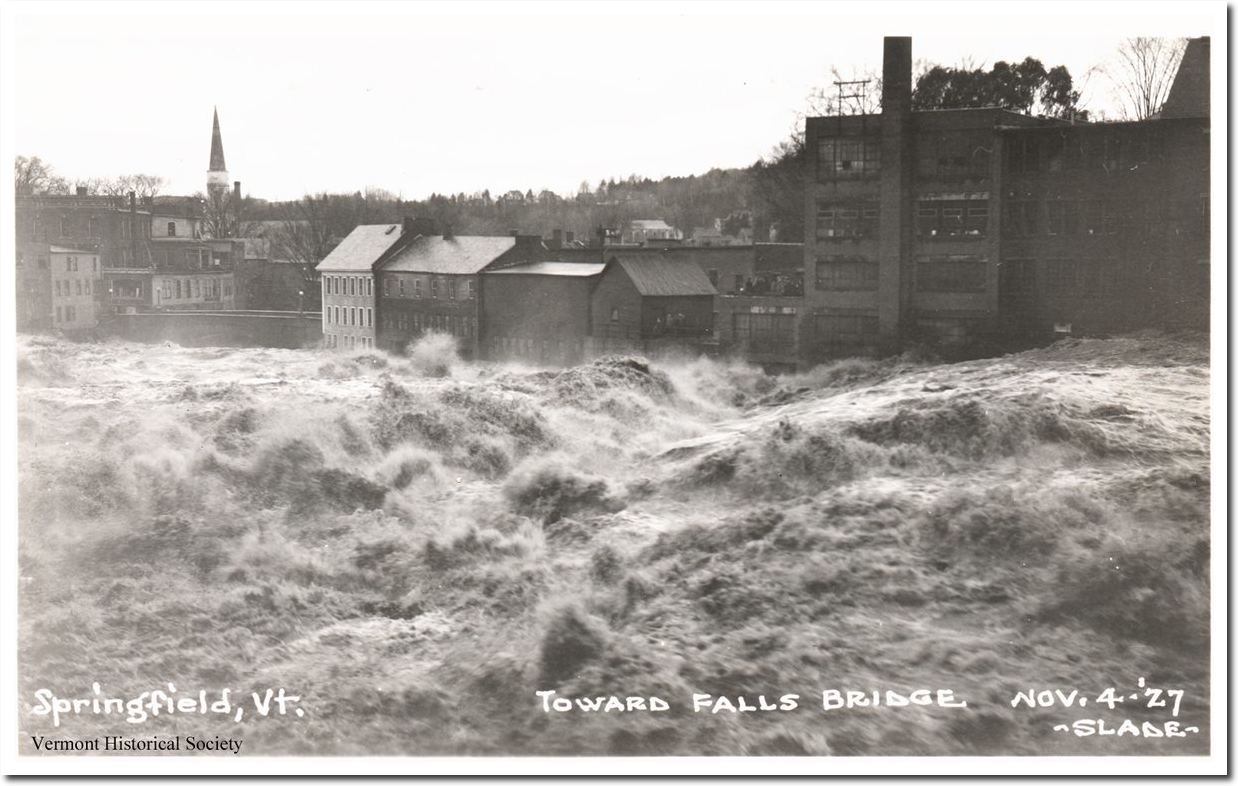
It took me about thirty seconds to research the accuracy of the graph. The Red Cross described 1927 as the worst year in history, reporting 111 disasters – including 29 tornadoes, 24 floods, 9 hurricanes and 23 fires. The worst floods in US history occurred that year. The Mississippi River was flooded for more than six months, forcing hundreds of thousands of people to abandon their homes permanently. Vermont’s worst flood also occurred in November, 1927.

25 Nov 1927, Page 7 – The News-Review at Newspapers.com

St. Louis was destroyed by a tornado.
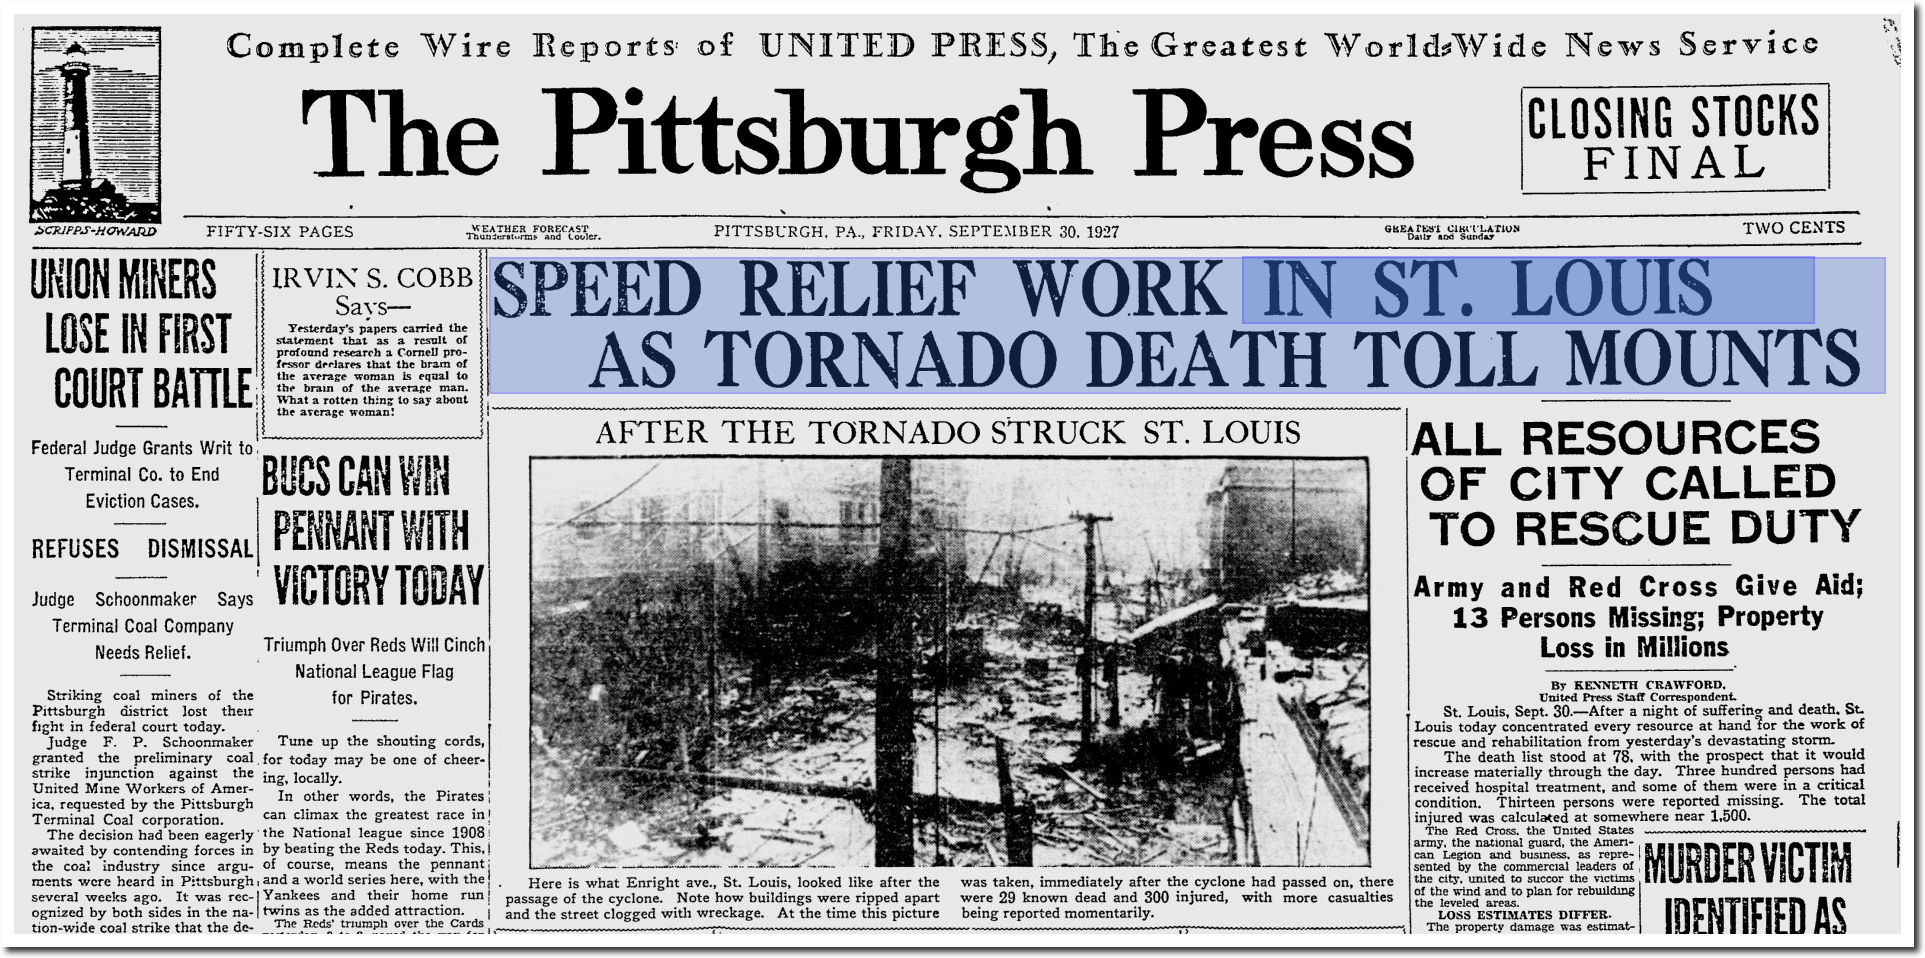
The Pittsburgh Press – Google News Archive Search
November flooding wiped out more than 1,000 bridges in Vermont, and drowned the Lieutenant Governor.
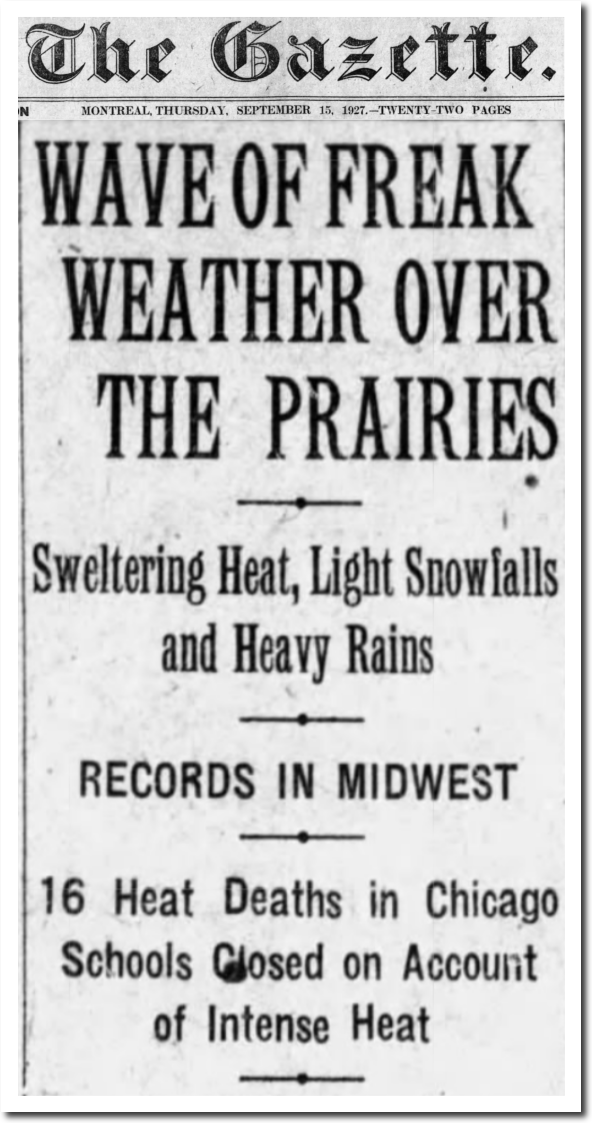
A number of record heatwaves occurred in 1927, including a protracted one in September and October, which killed scores of people.
15 Sep 1927, 1 – The Gazette at Newspapers.com
Warsaw Union – Google News Archive Search
Obviously the person who generated the graph didn’t do any research, and is simply making numbers up. Another graph from the same website shows death rates from natural disasters down 95% since the 1920s.
Posted in Uncategorized
Leave a comment
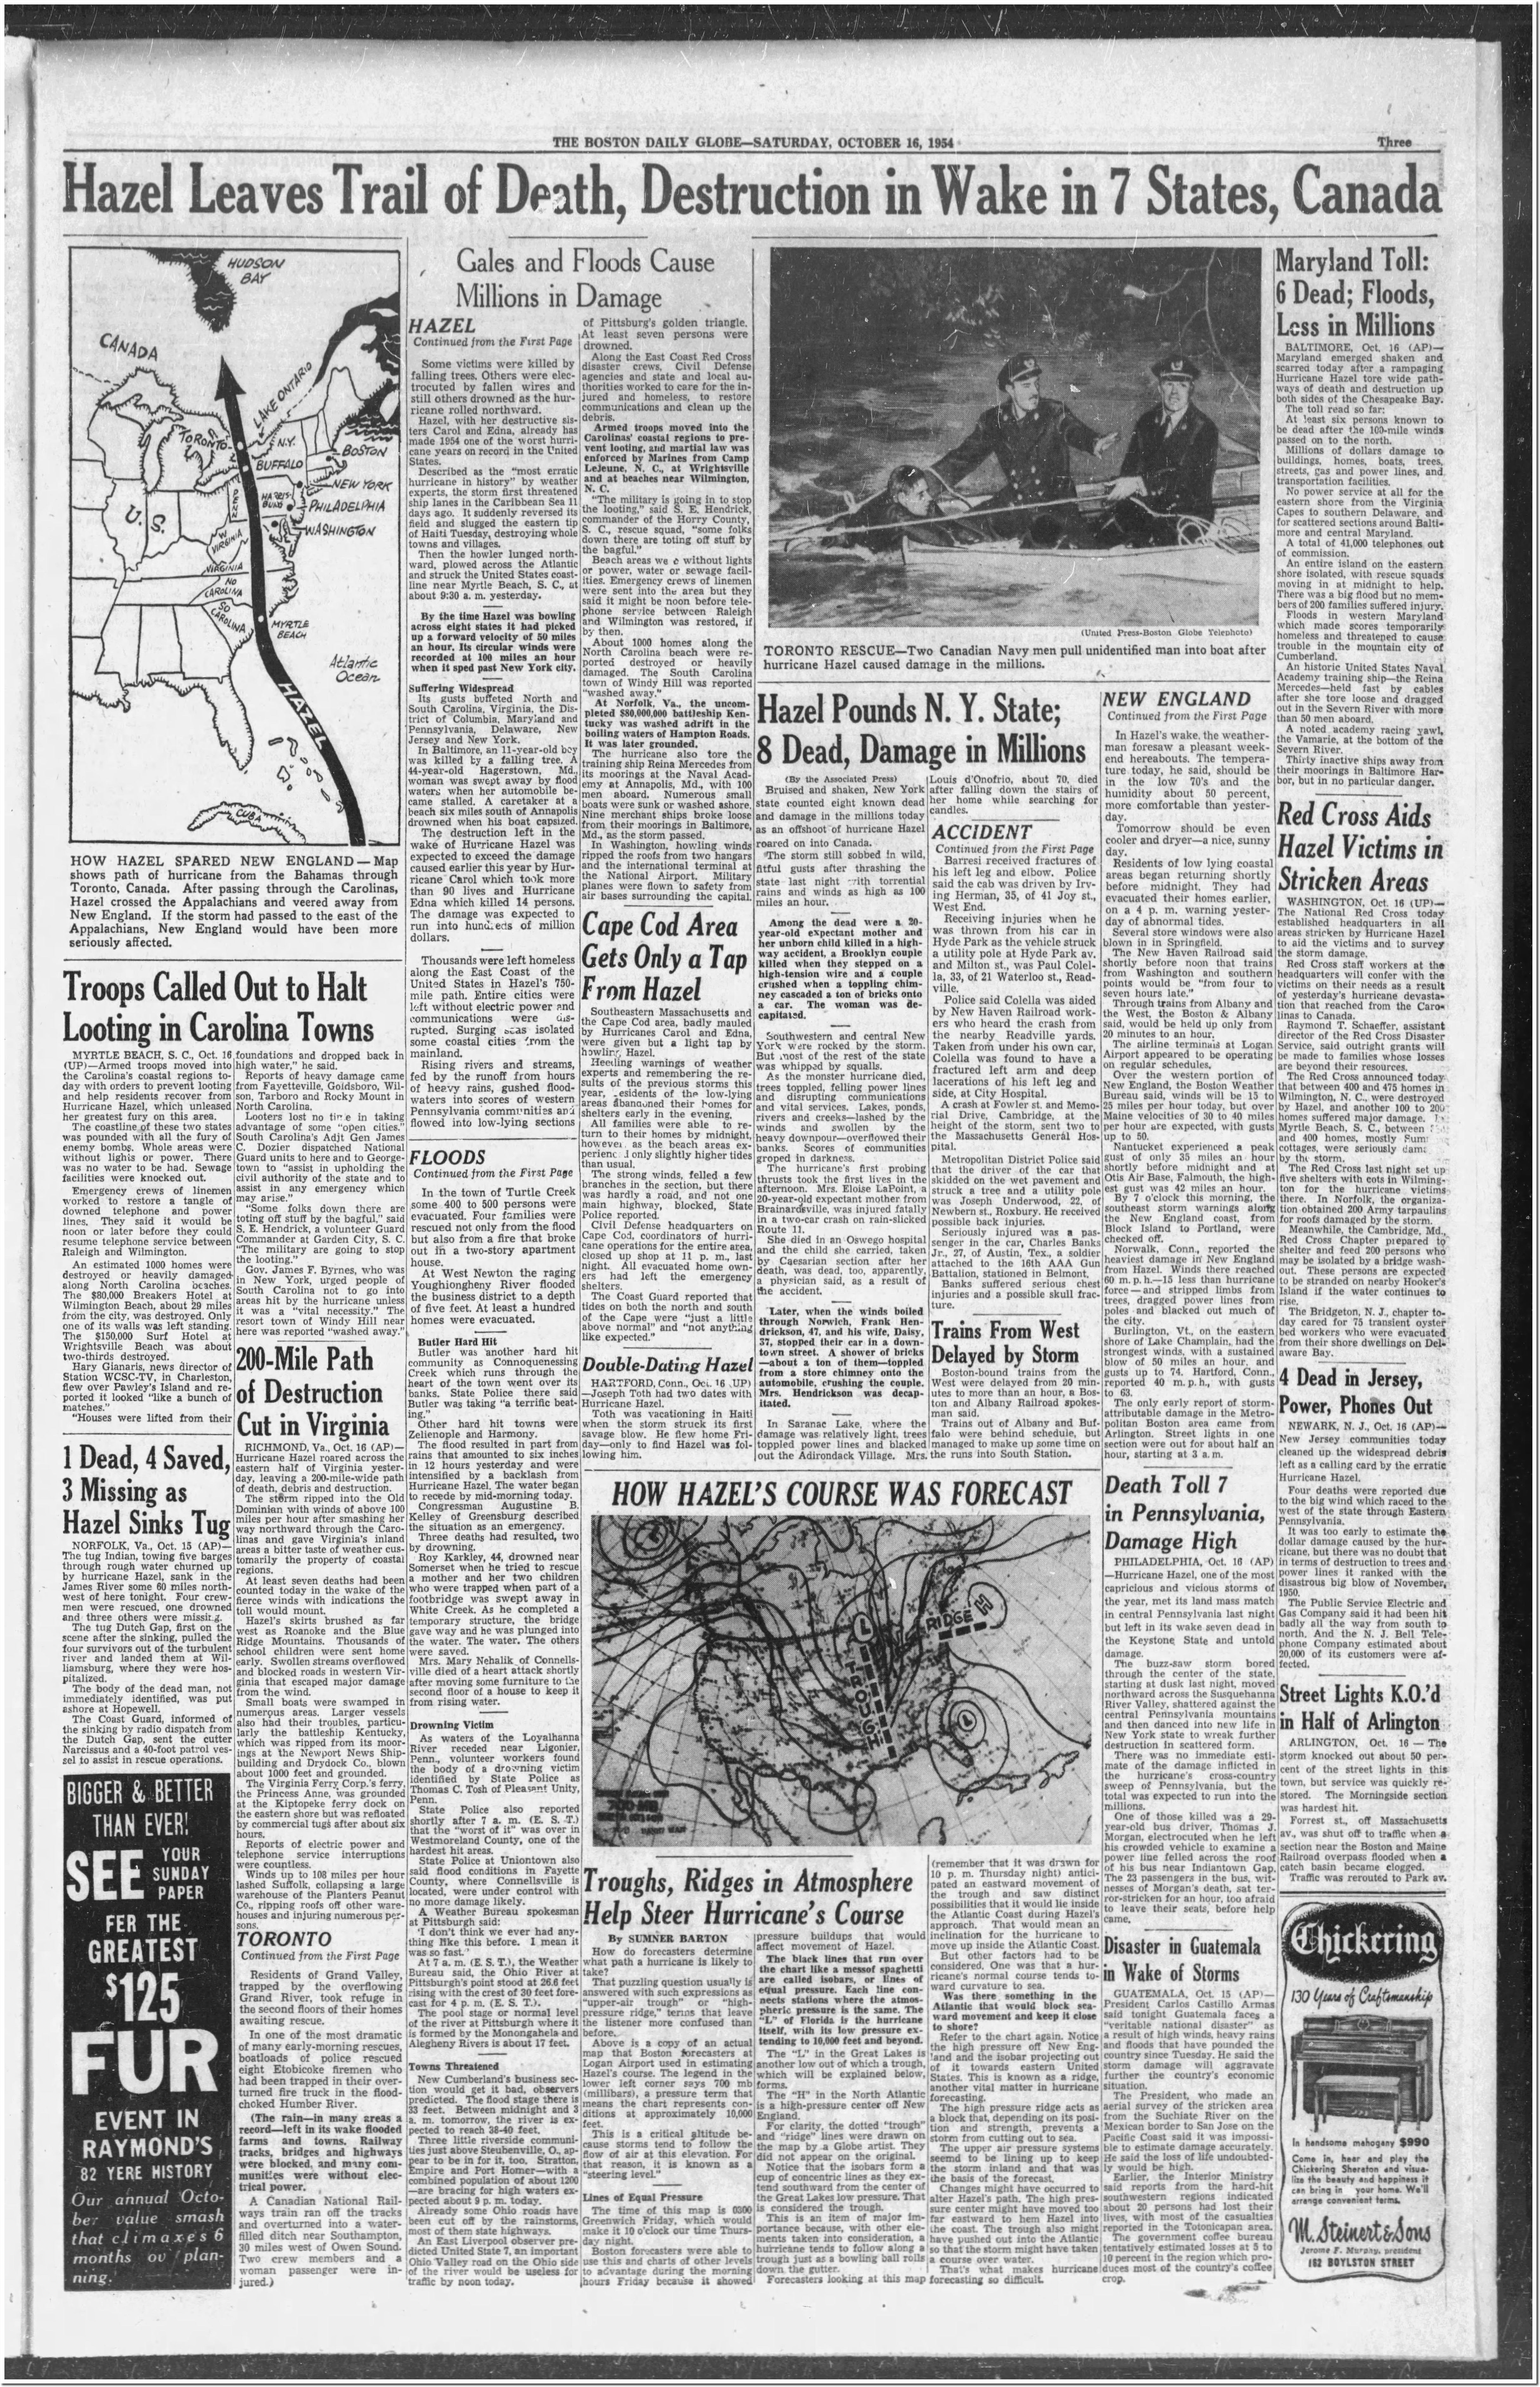
Ahead Of Hazel
During the first week of October, 1954 – the Carolinas had an unprecedented heatwave with temperatures over 100 degrees on October 4-7. The following week they were hit by another heatwave, followed by category 4 Hurricane Hazel – the worst storm on record there.

Posted in Uncategorized
Leave a comment
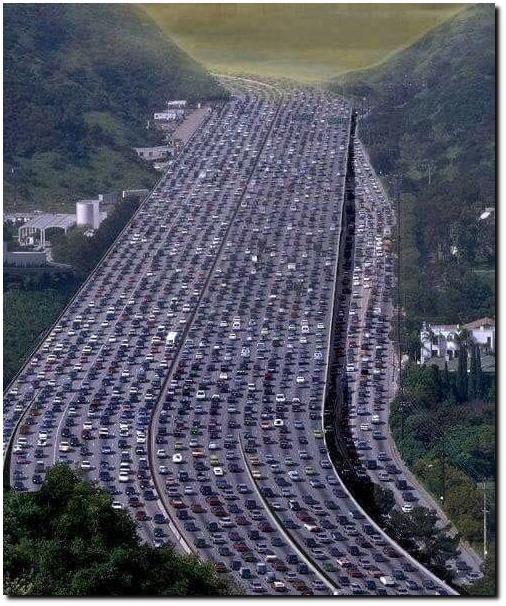
Following Greta’s Speech – Californians To Give Up Their Cars
Greta Thunberg gave an inspiring speech at the UN today (so I hear.) No doubt progressive Californians will give up their cars tomorrow.
Posted in Uncategorized
Leave a comment
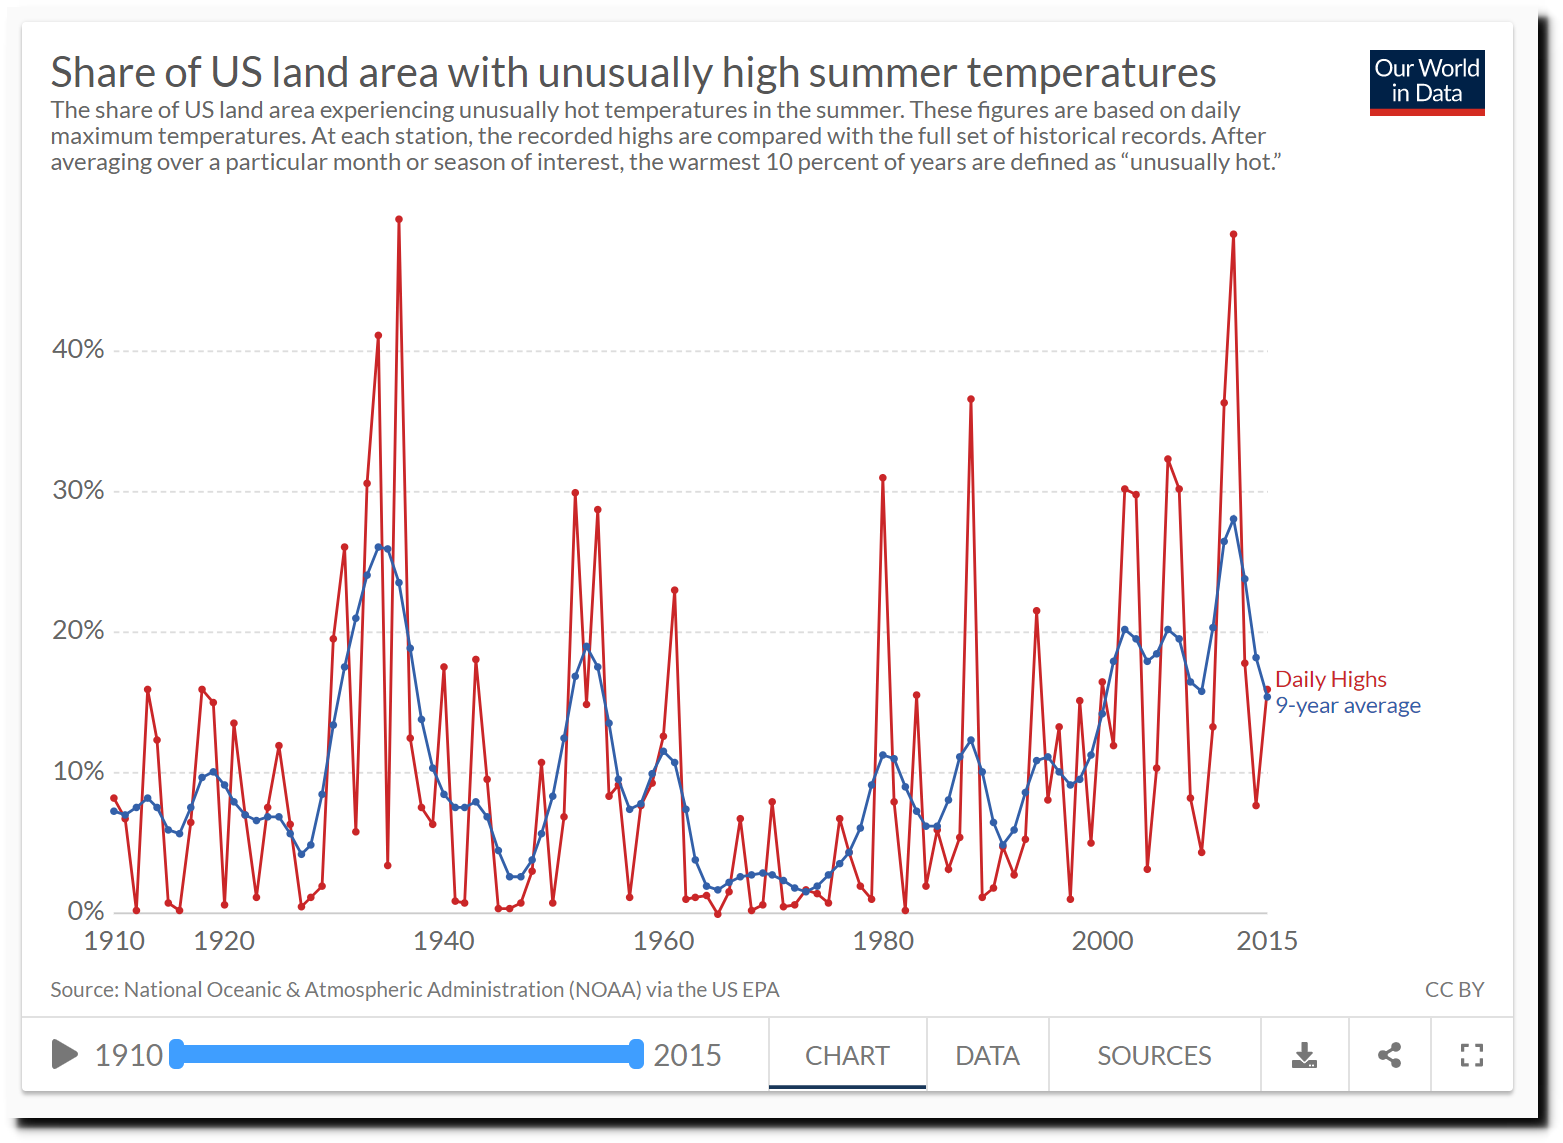
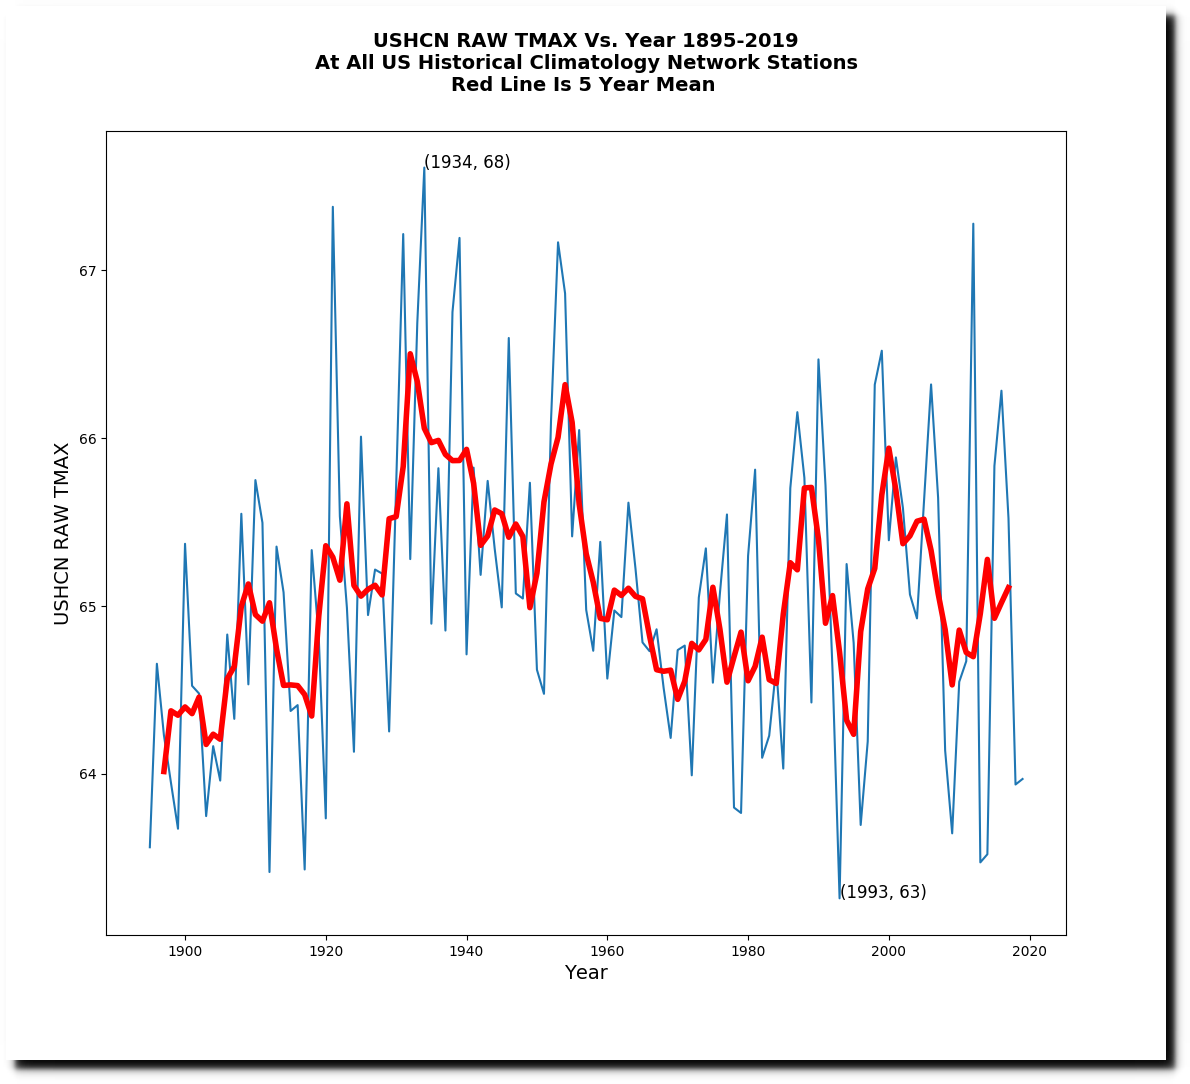
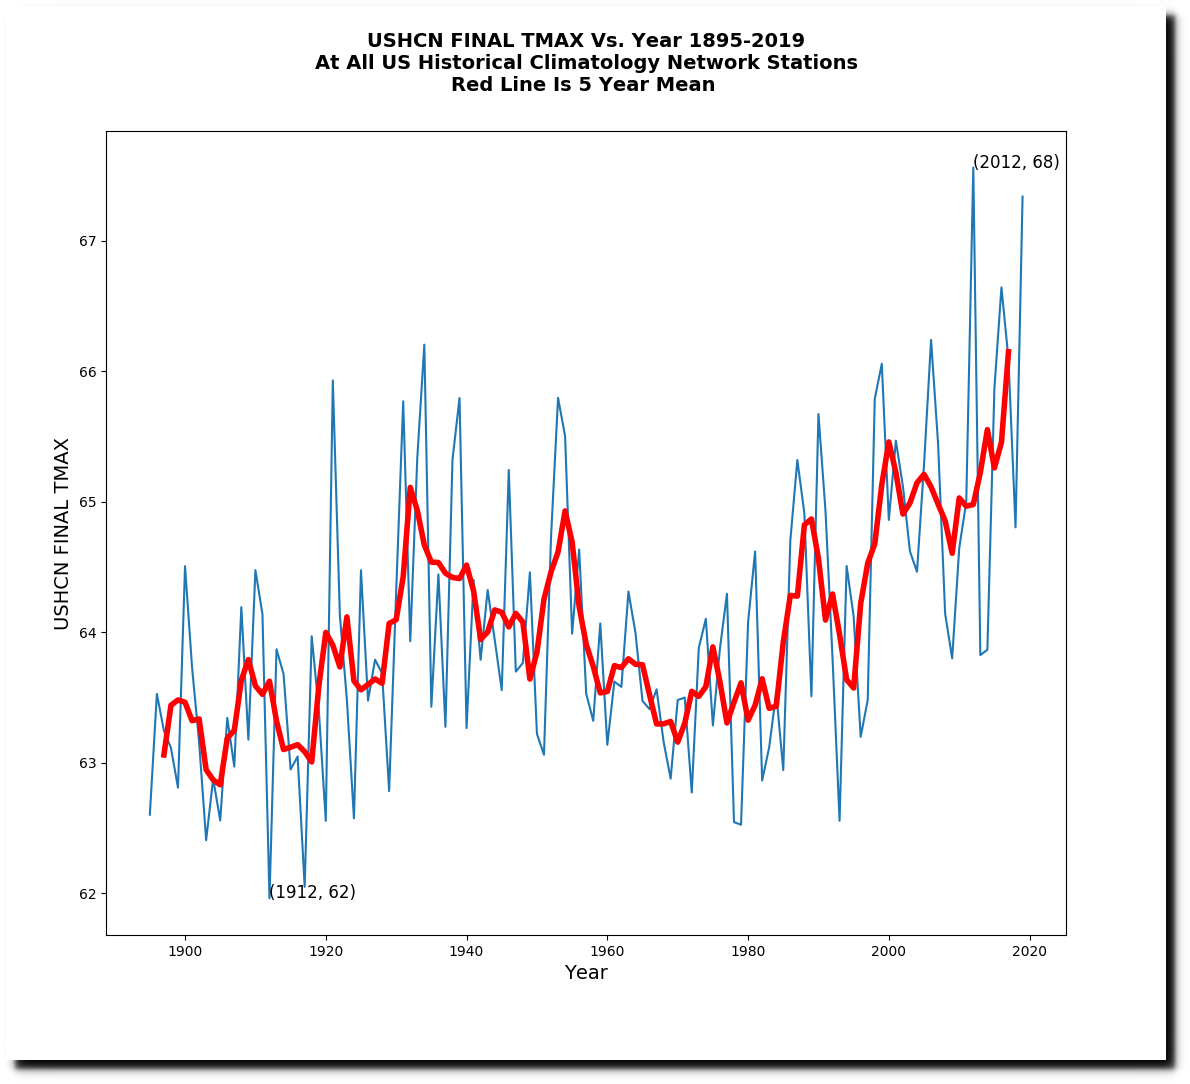
Another Wildly Fraudulent Data Set From NOAA
NOAA claims that the area of the US with unusually hot summer afternoon temperatures is increasing to record highs.
Natural Disasters – Our World in Data
It actually has been decreasing to record lows.
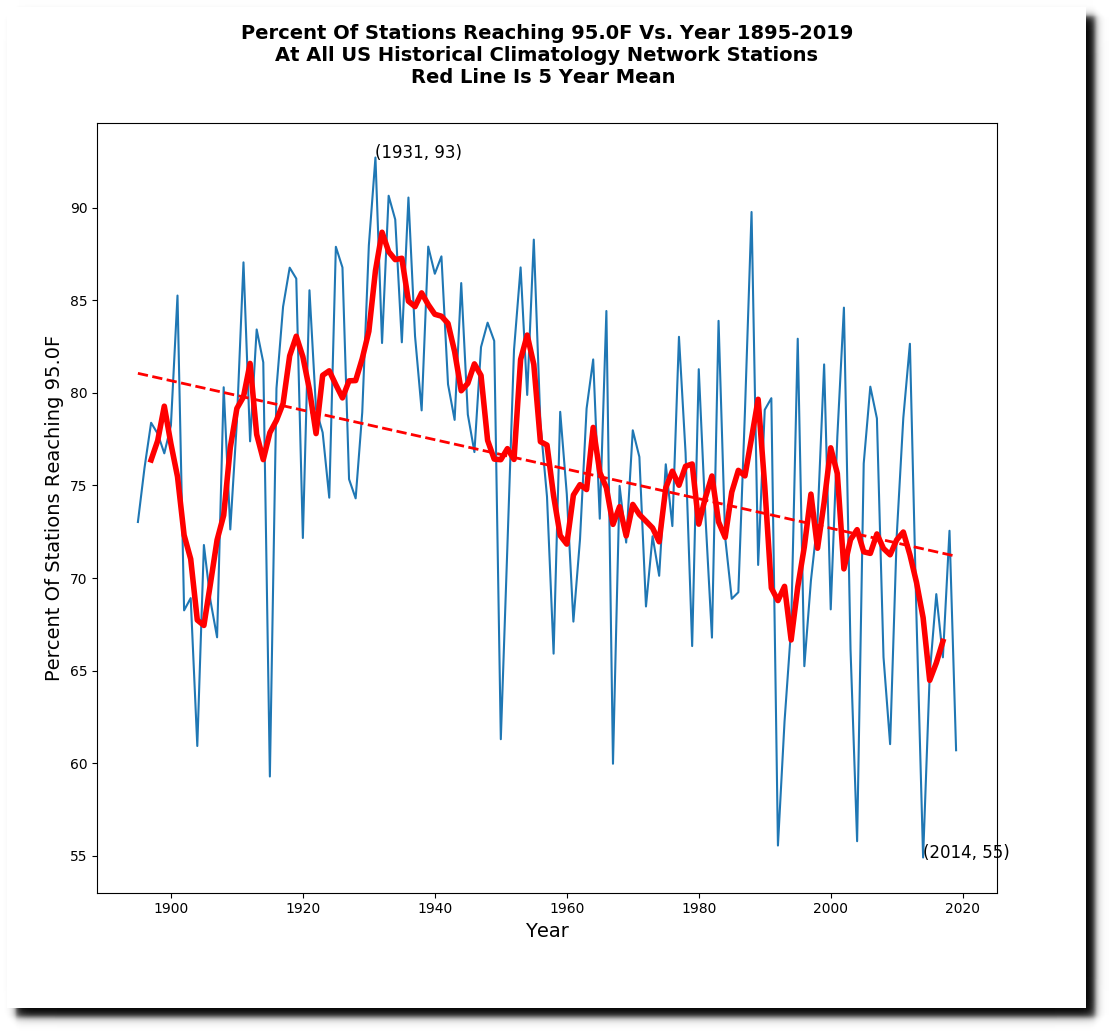
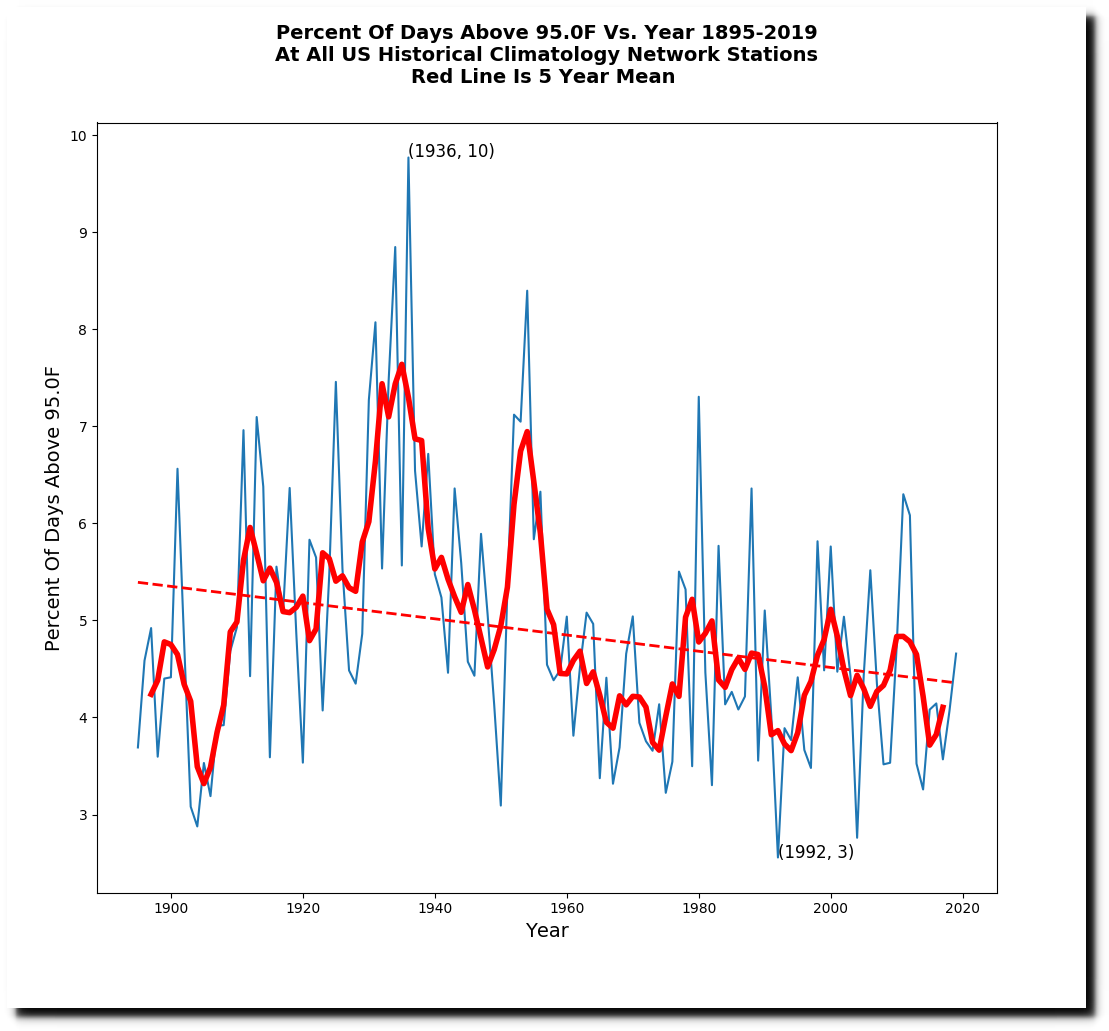
The National Climate Assessment shows the same thing as my graphs Peak summer temperatures in most of the US have declined sharply over the last 60 years.
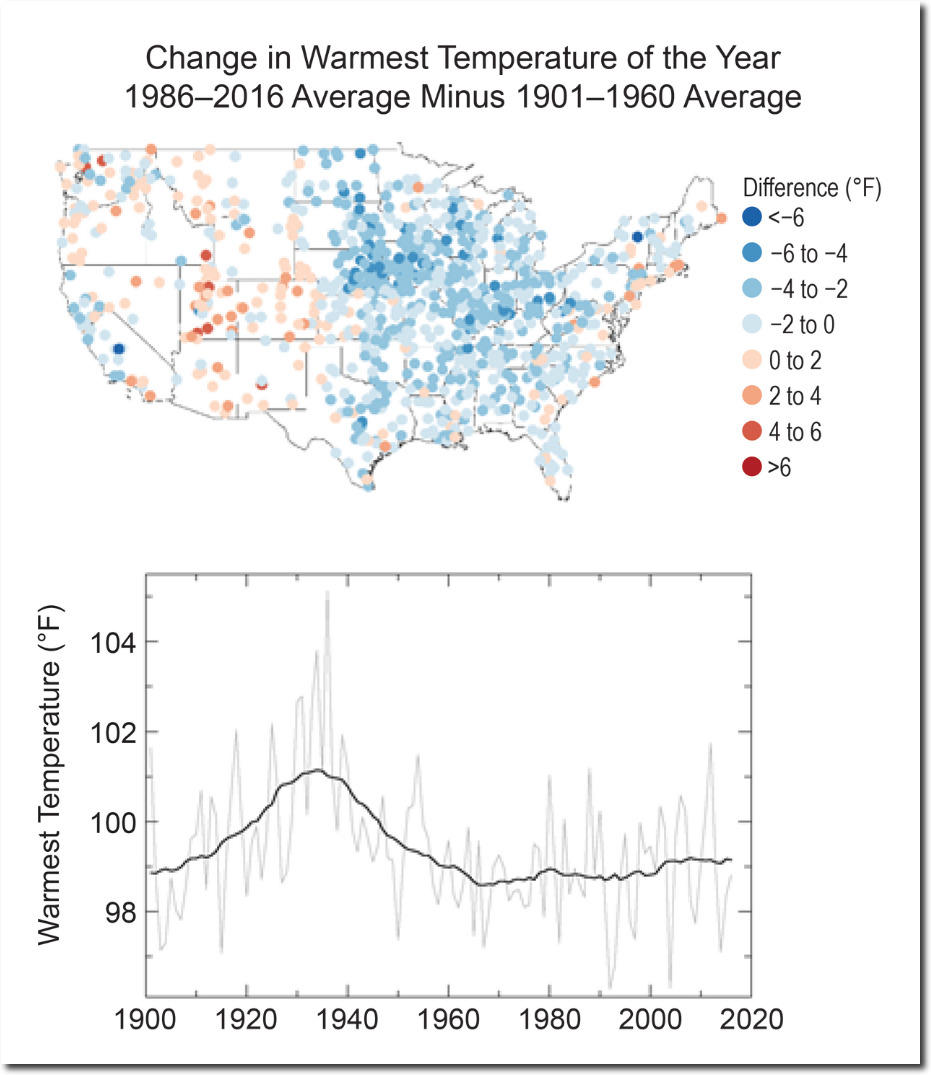
Temperature Changes in the United States – Climate Science Special Report
More than 50% of the NOAA adjusted data is now fabricated. It is all a complete farce.

The adjusted data is no longer even remotely credible. They turn a strong 80 year cooling trend into a warming trend.
Posted in Uncategorized
Leave a comment
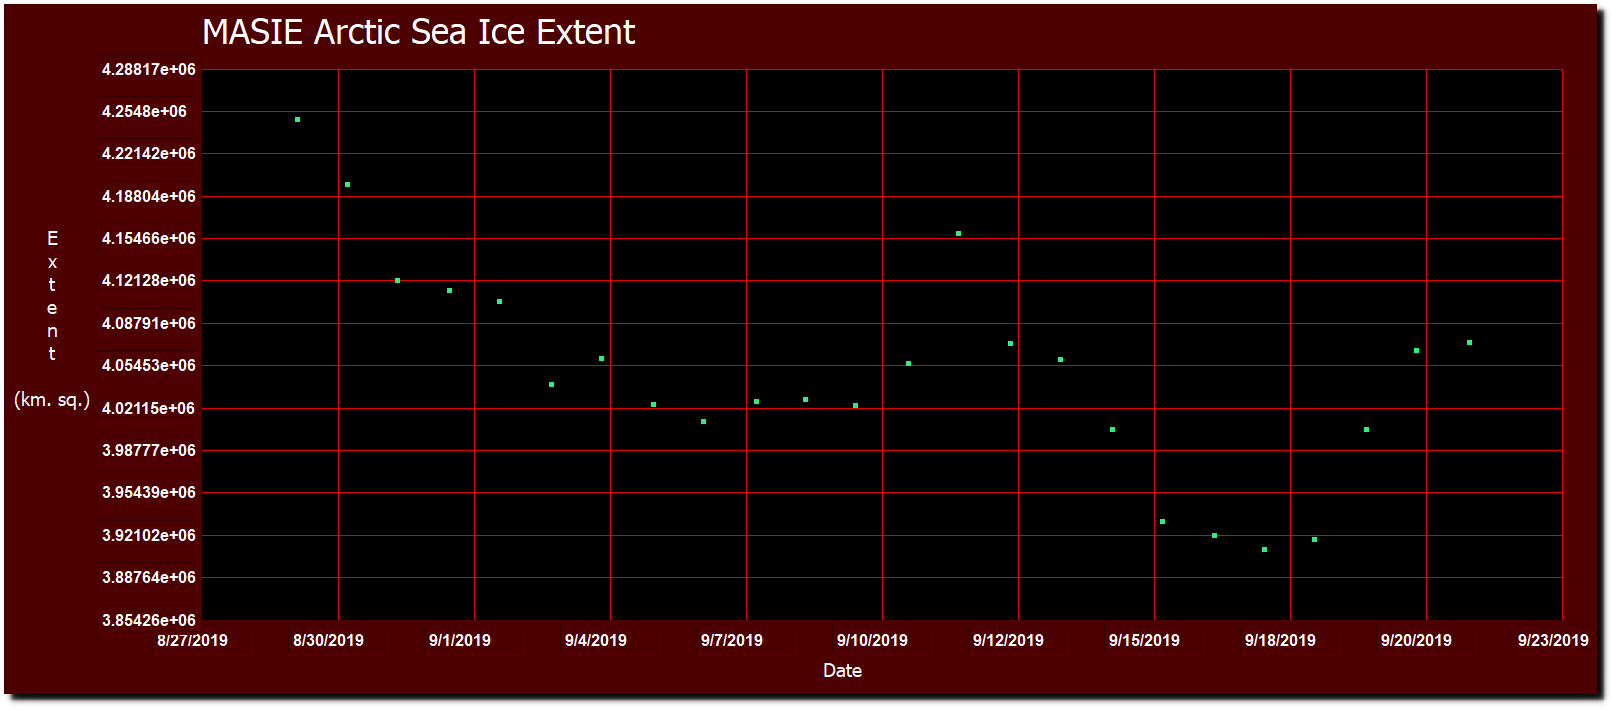
Arctic Sea Ice Update
Arctic sea ice extent initially bottomed out on September 6, and then winds pushed the ice edge back near Svalbard for a few days after September 11.
There has been a slight downwards trend since the 2006 minimum.
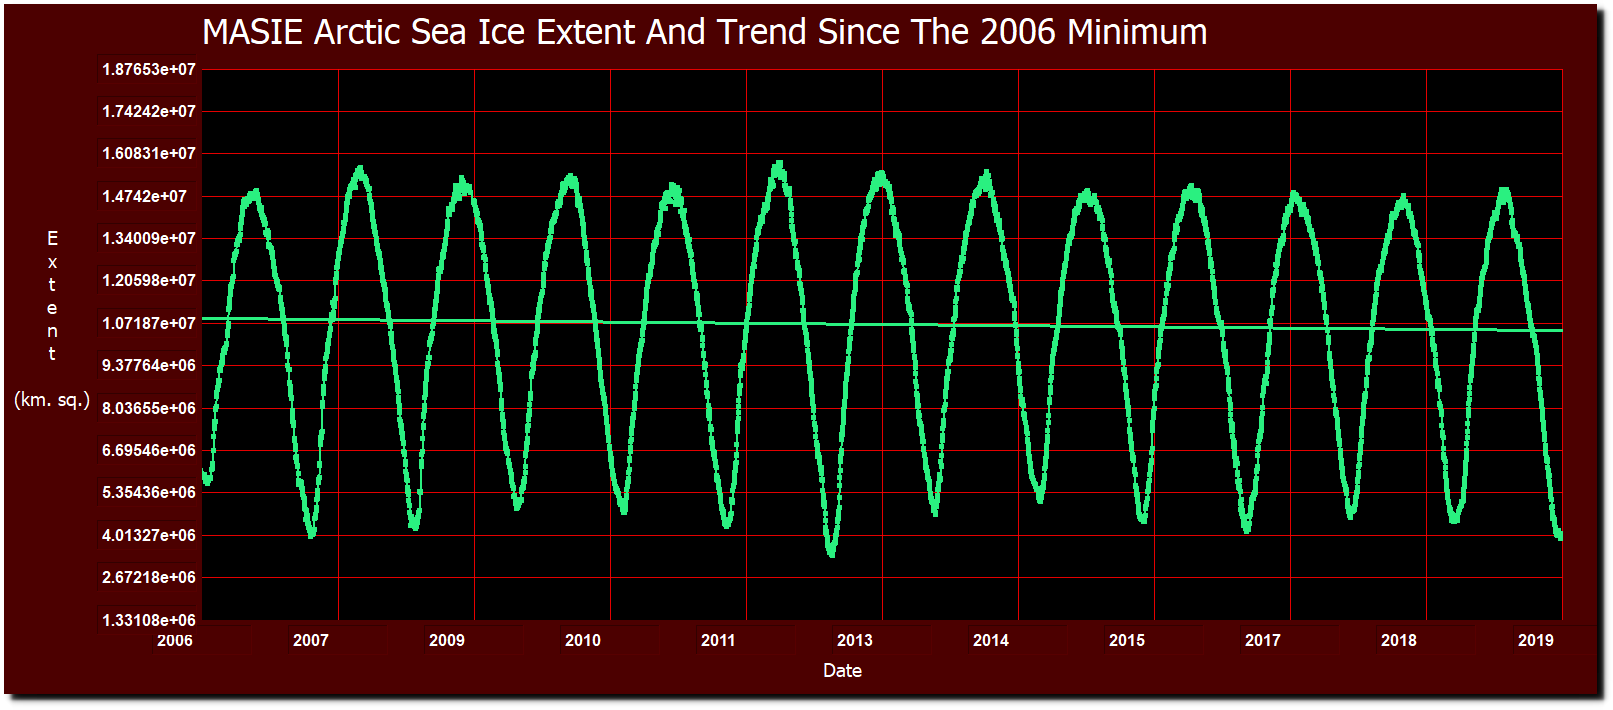
masie_4km_allyears_extent_sqkm.csv
Ice is growing rapidly now in the Arctic Basin.

ftp://sidads.colorado.edu/DATASETS/NOAA/G02135/north/daily/images/2019/09_Sep
There has been a large ice gain since 2012.
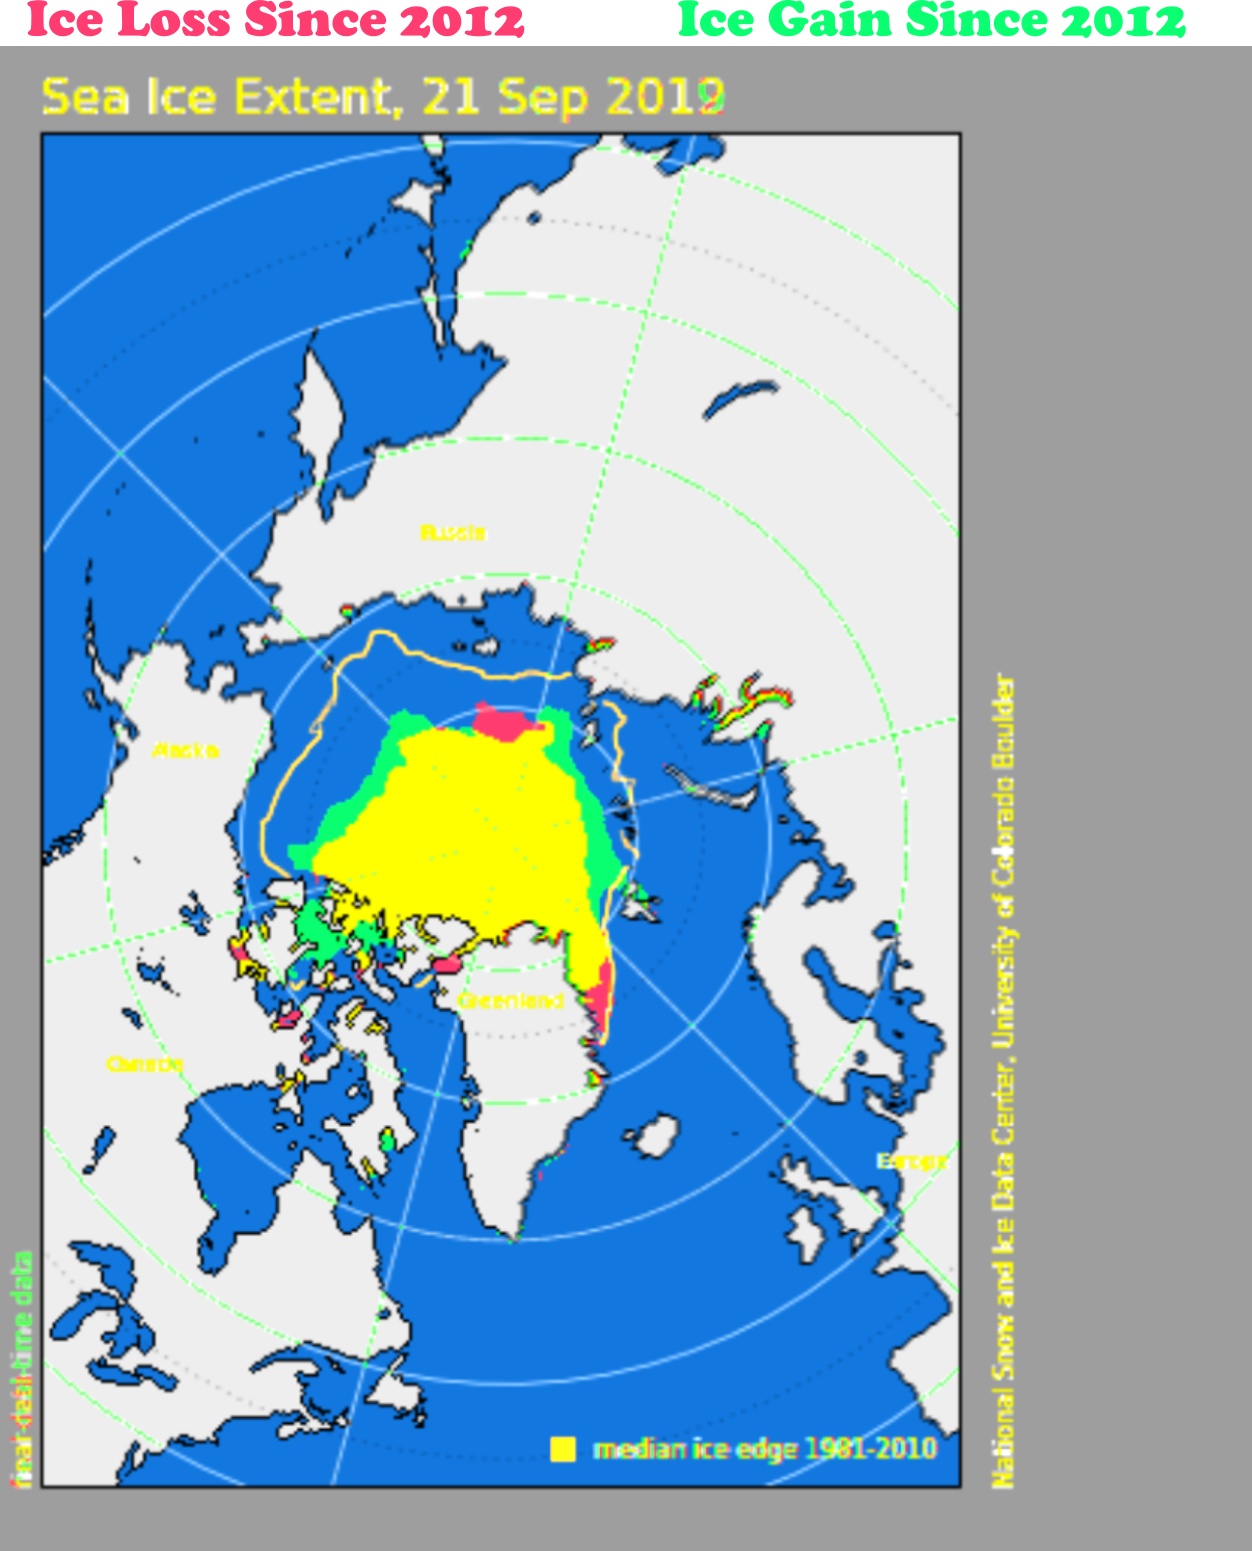
This is being touted by the press as a “climate crisis.”

Posted in Uncategorized
Leave a comment