
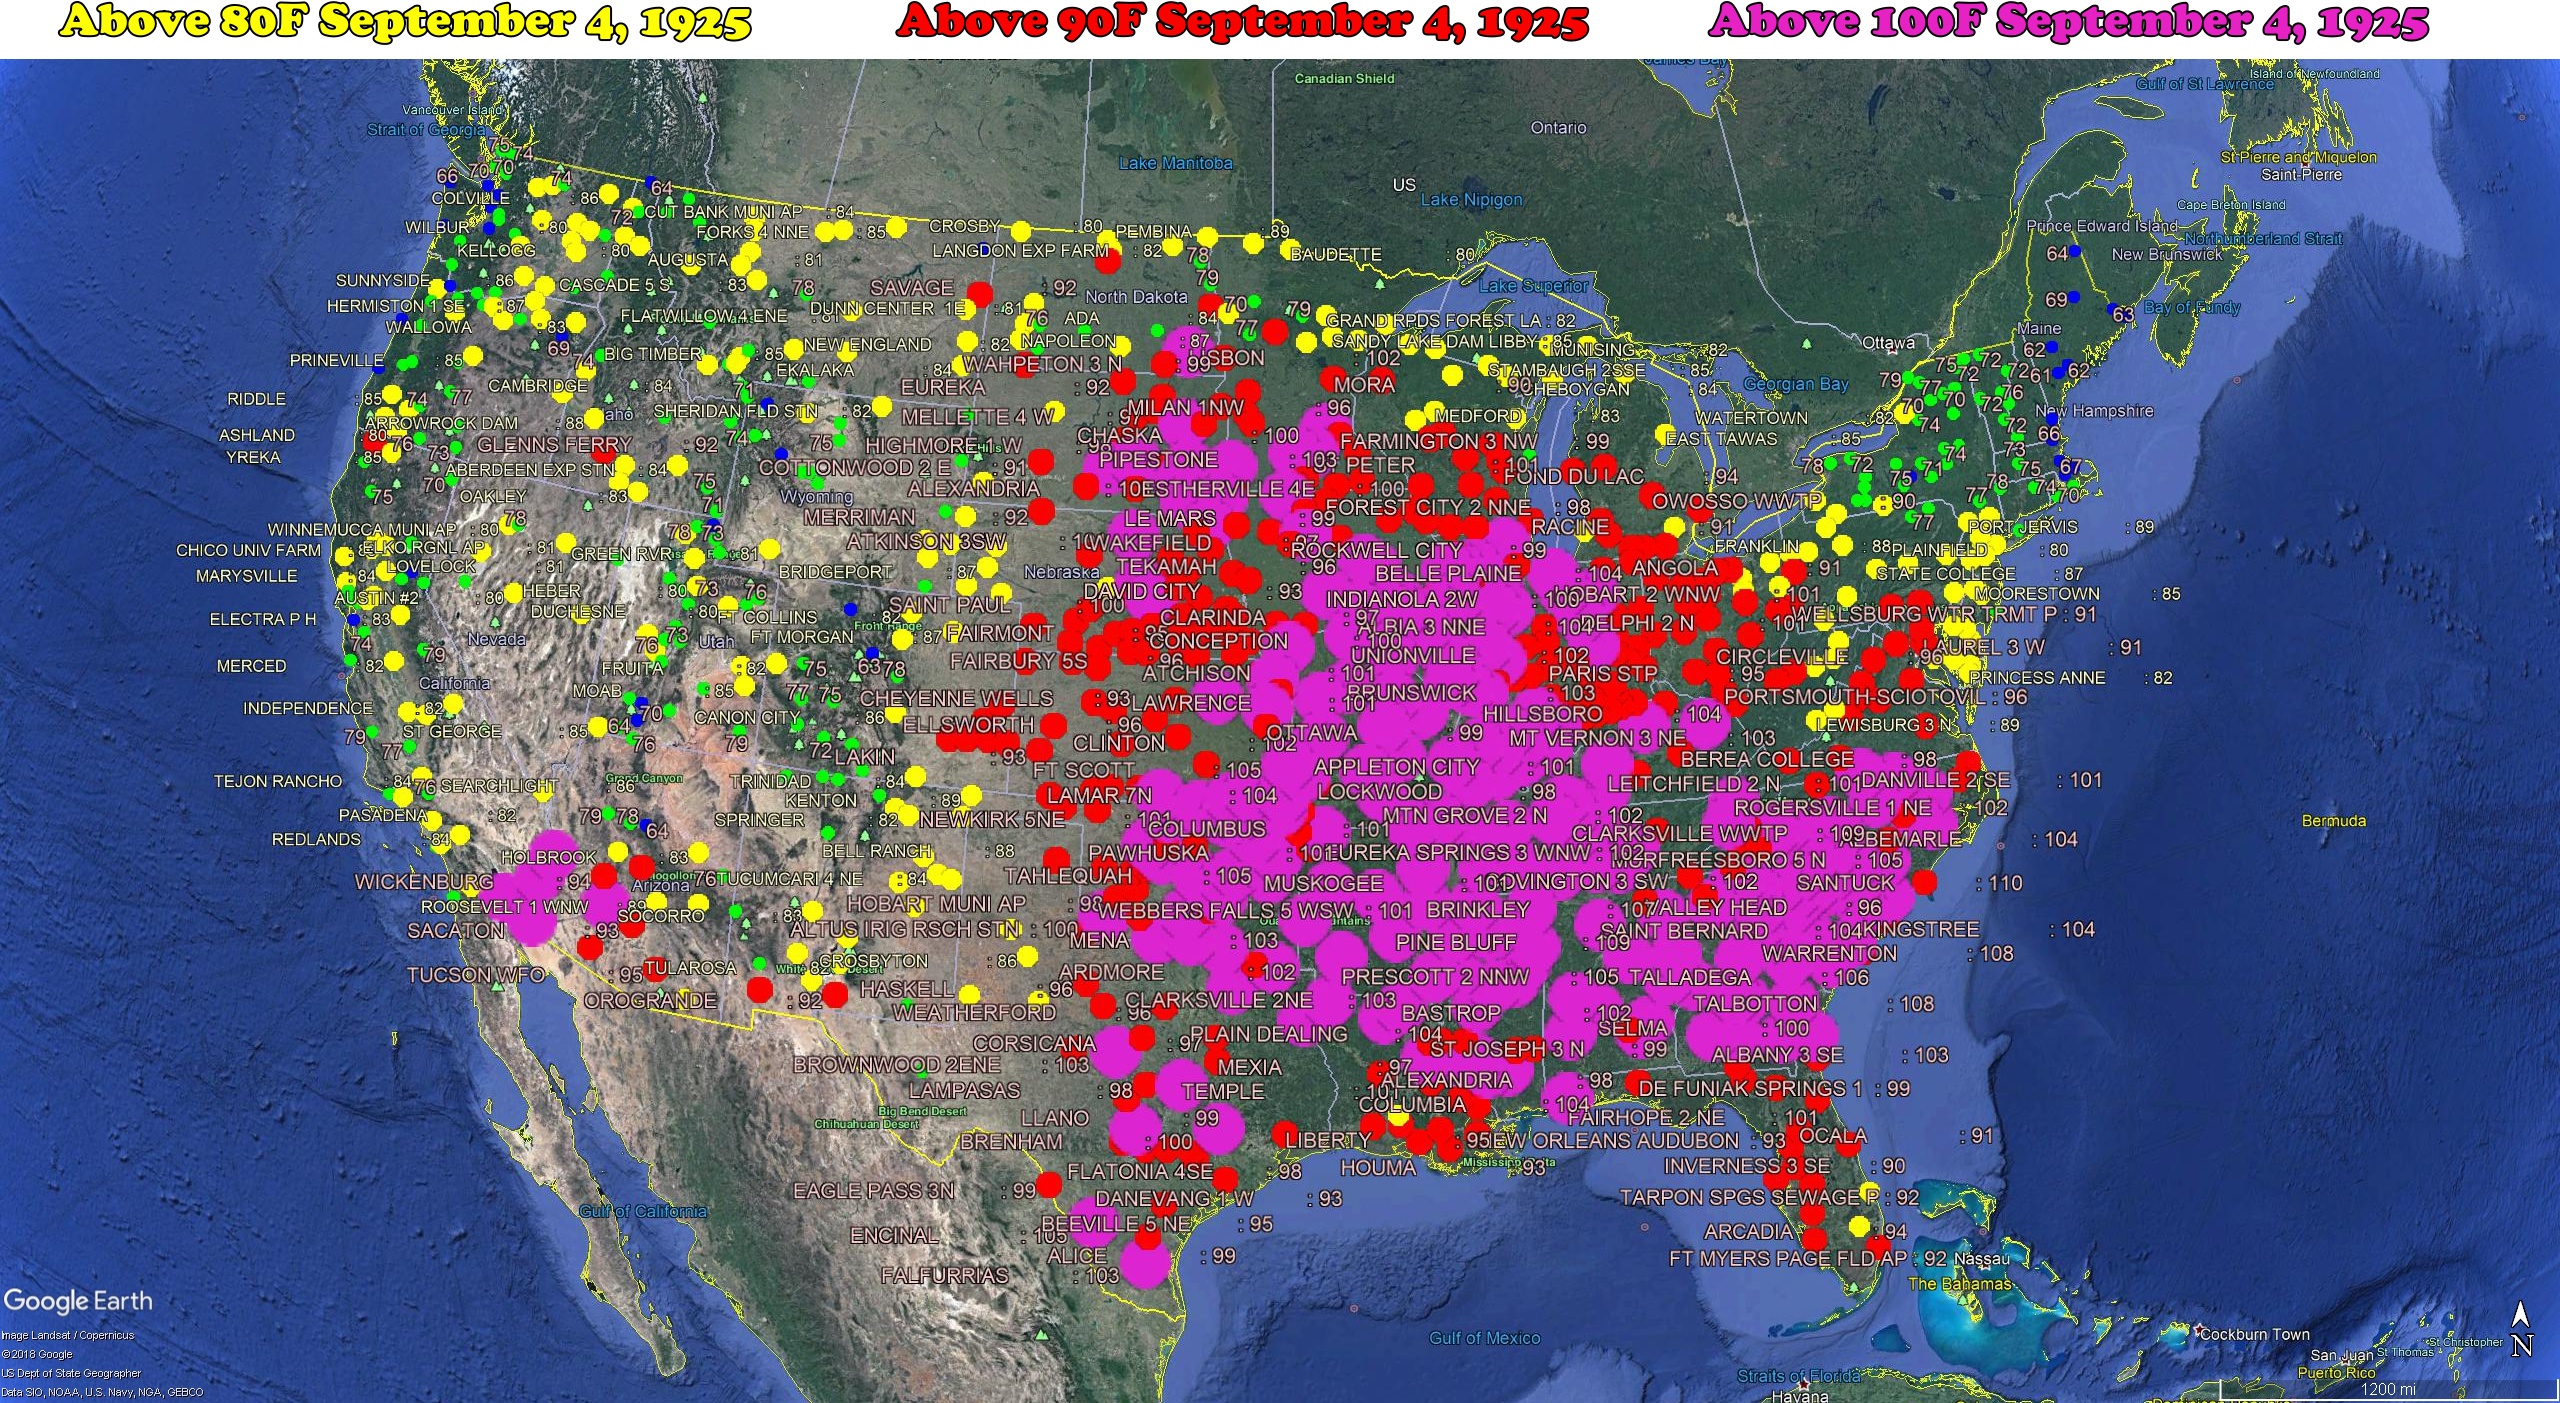
On this date in 1925, most of the Eastern US was over 100 degrees.
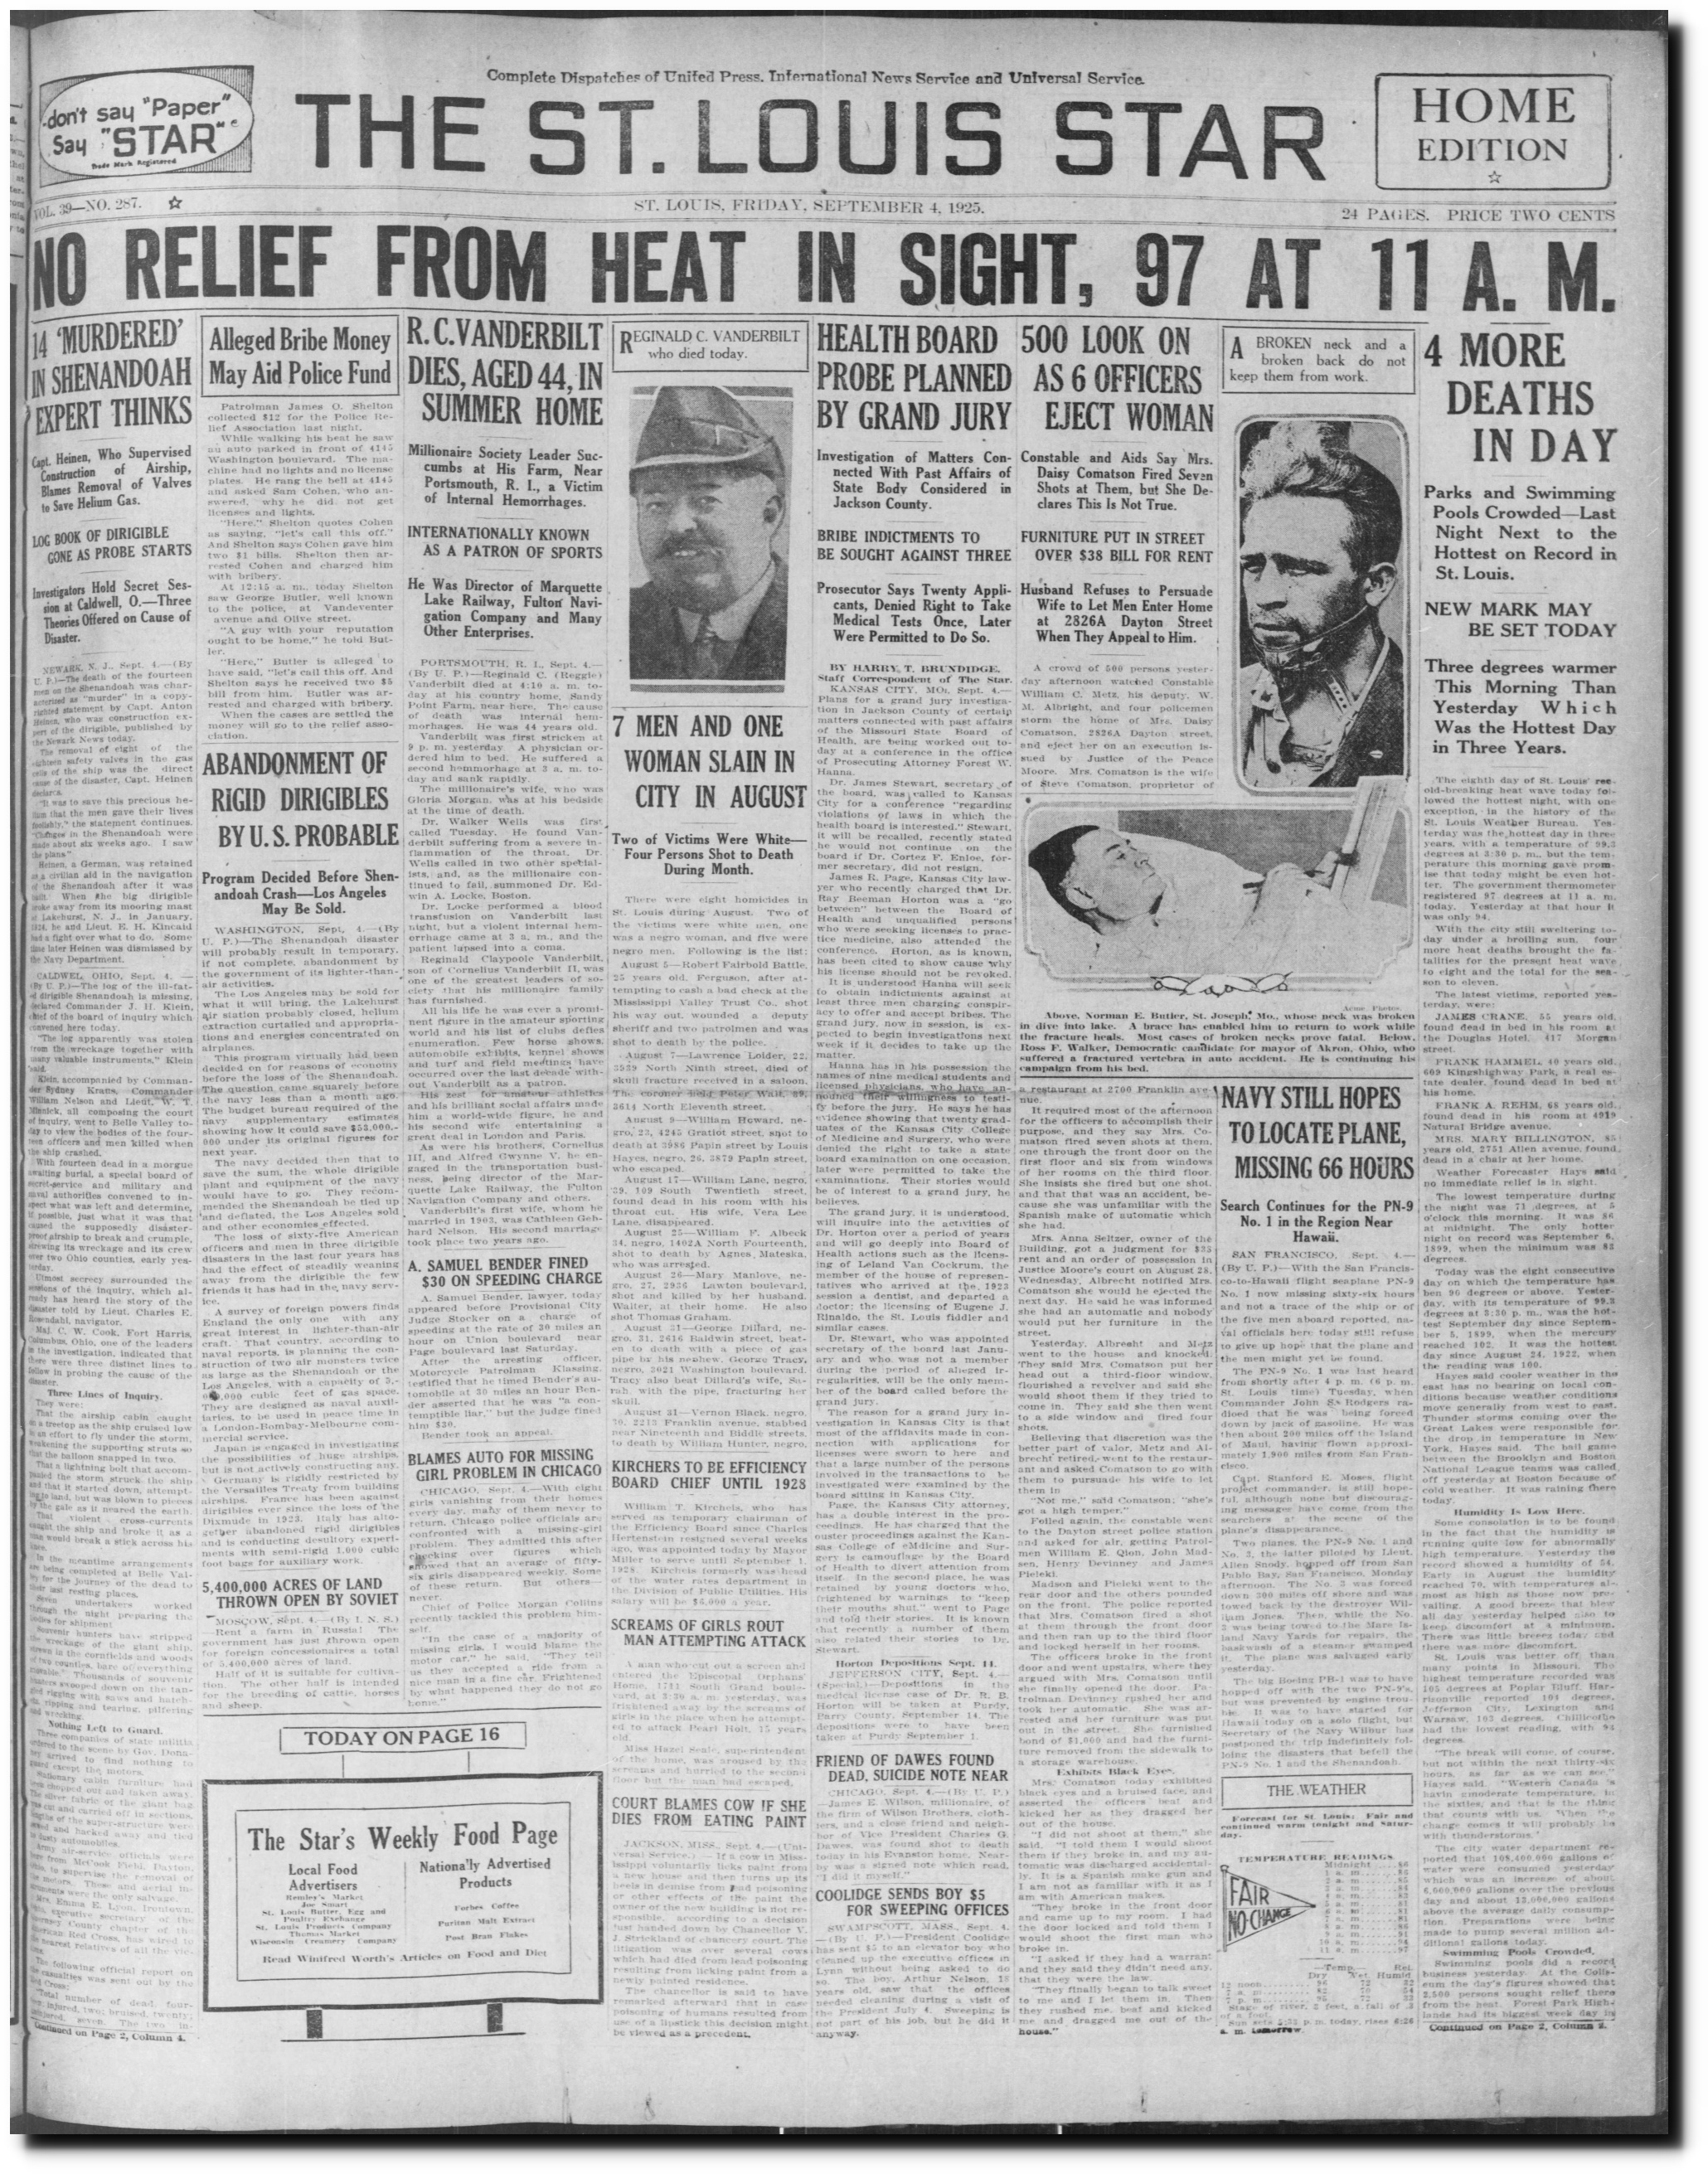
04 Sep 1925, Page 1 – The St. Louis Star and Times at Newspapers.com
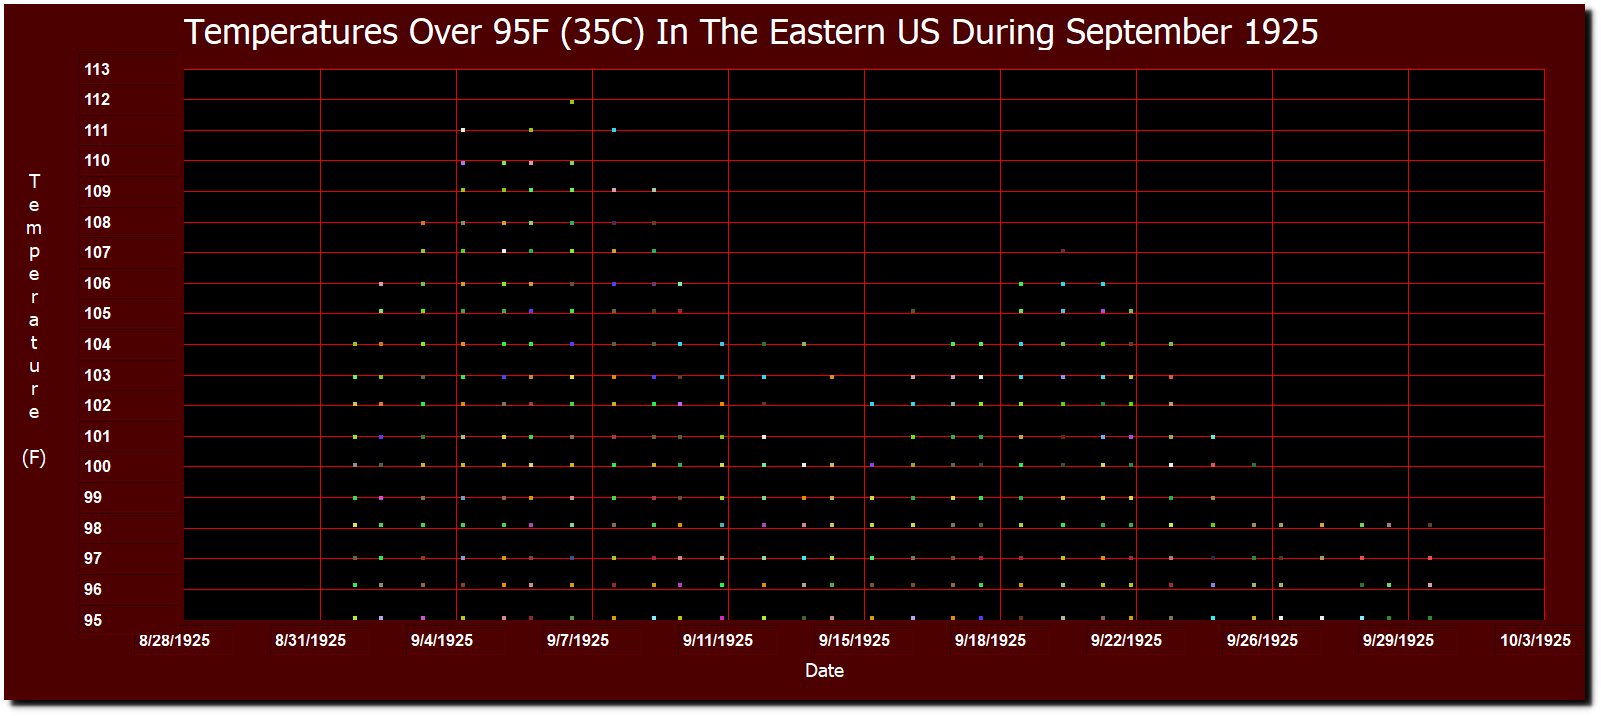
The heatwave peaked on September 7, and lasted for the entire month oi September.
On this date in 1925, most of the Eastern US was over 100 degrees.
04 Sep 1925, Page 1 – The St. Louis Star and Times at Newspapers.com
The heatwave peaked on September 7, and lasted for the entire month oi September.
“At Kingston only four or five houses are left; at West End only four or five out of 80 houses. Every church and chapel in the island has been unroofed ….. the islands have been swept clean”
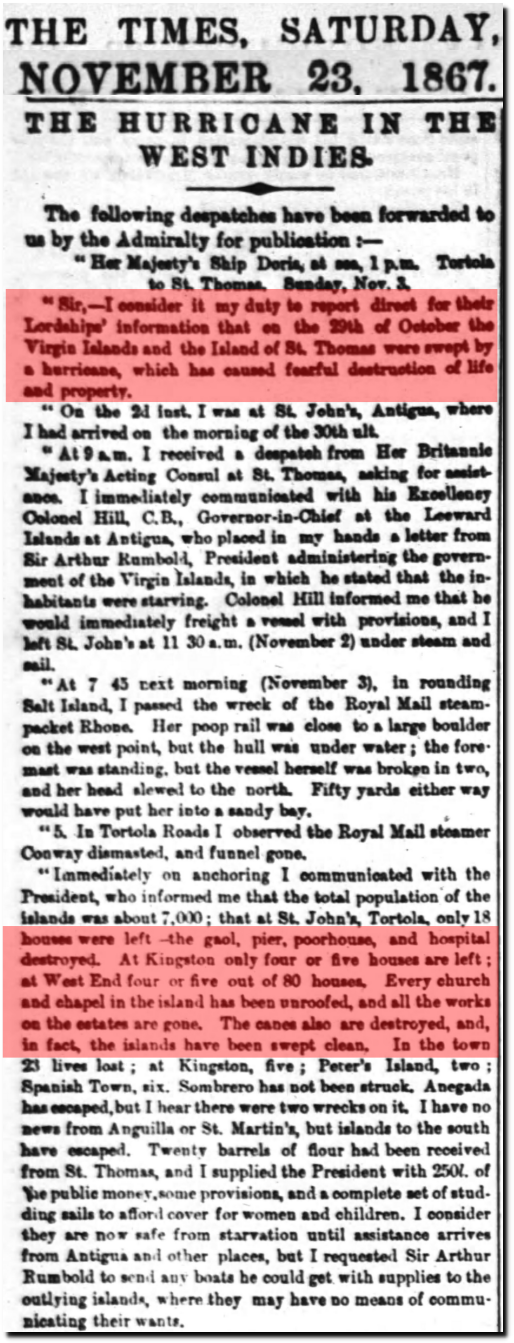
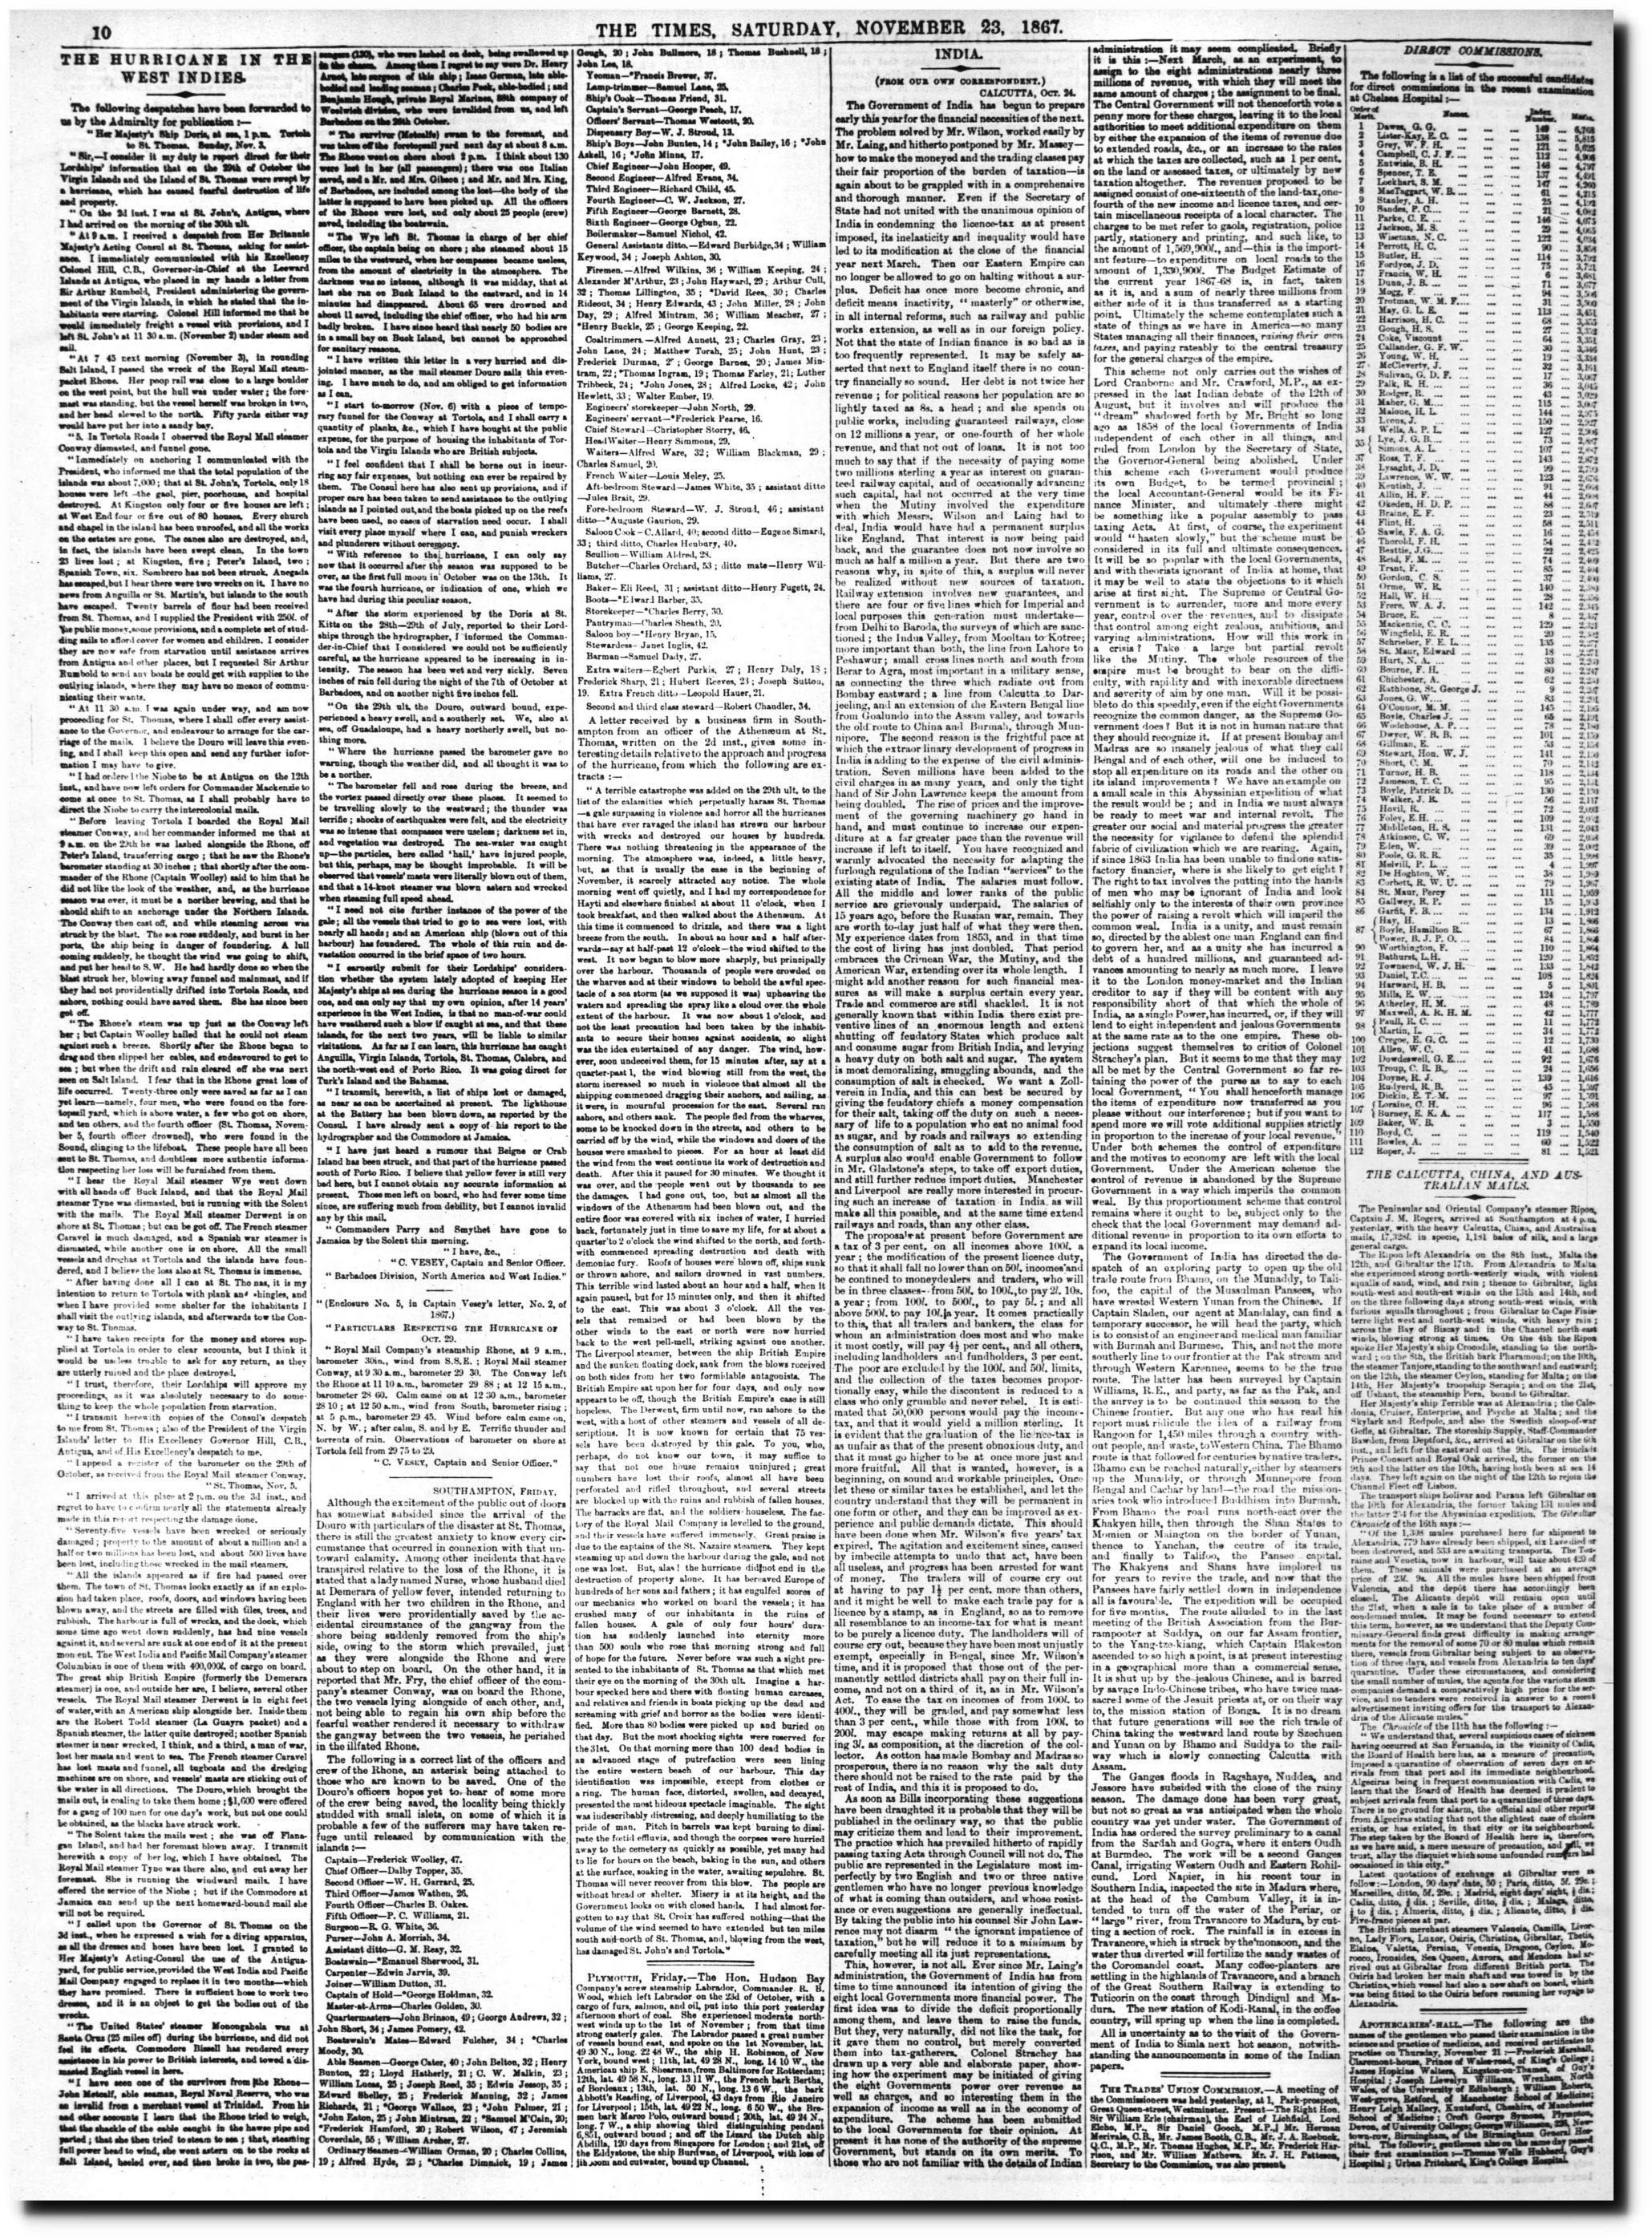
23 Nov 1867, Page 10 – The Times at Newspapers.com
The following year brought an unprecedented flood to Ellicott City, Maryland – where I used to frequent the Assembly of God Church.
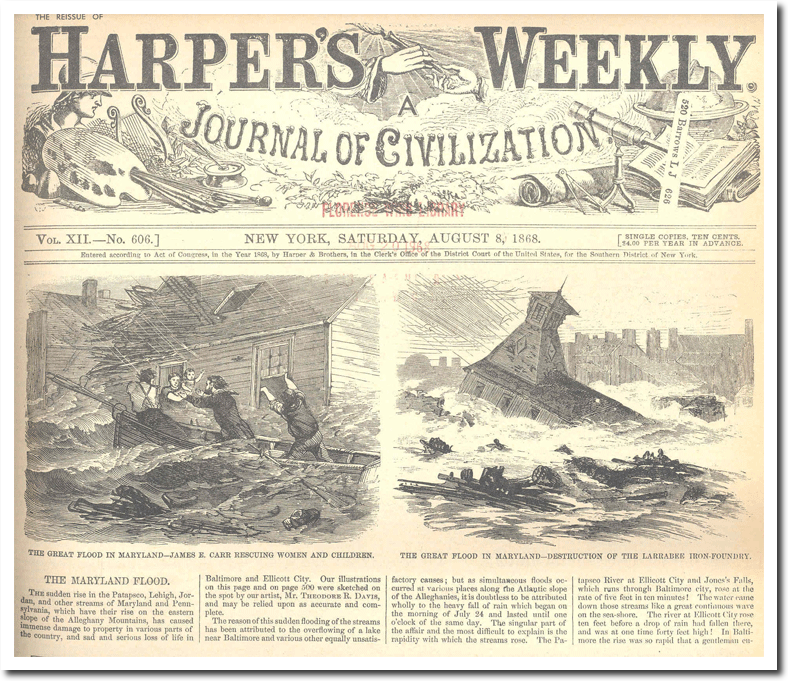
Historic Ellicott City, MD – Floods – Saturday, August 8, 1868
And the Guardian announced that all science was settled.
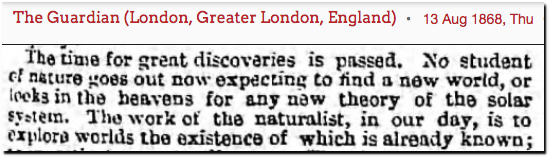
13 Aug 1868, 3 – The Guardian at Newspapers.com
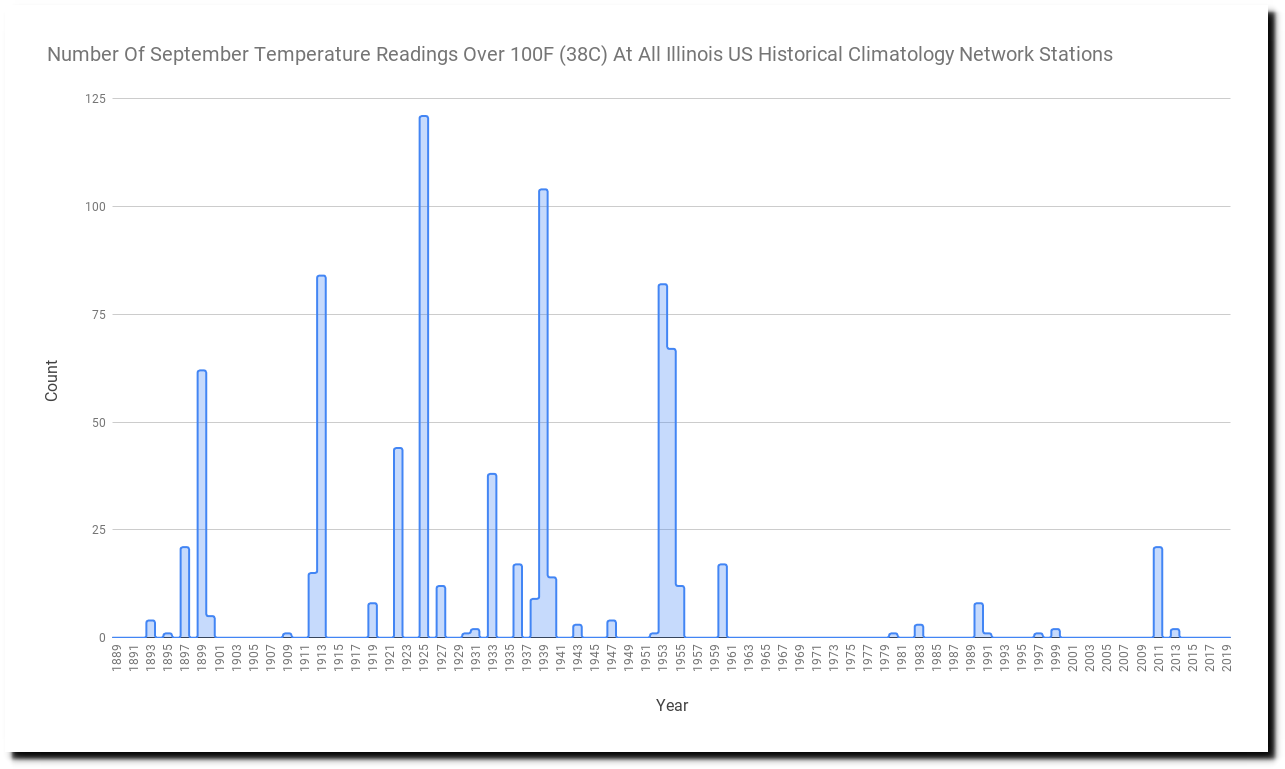
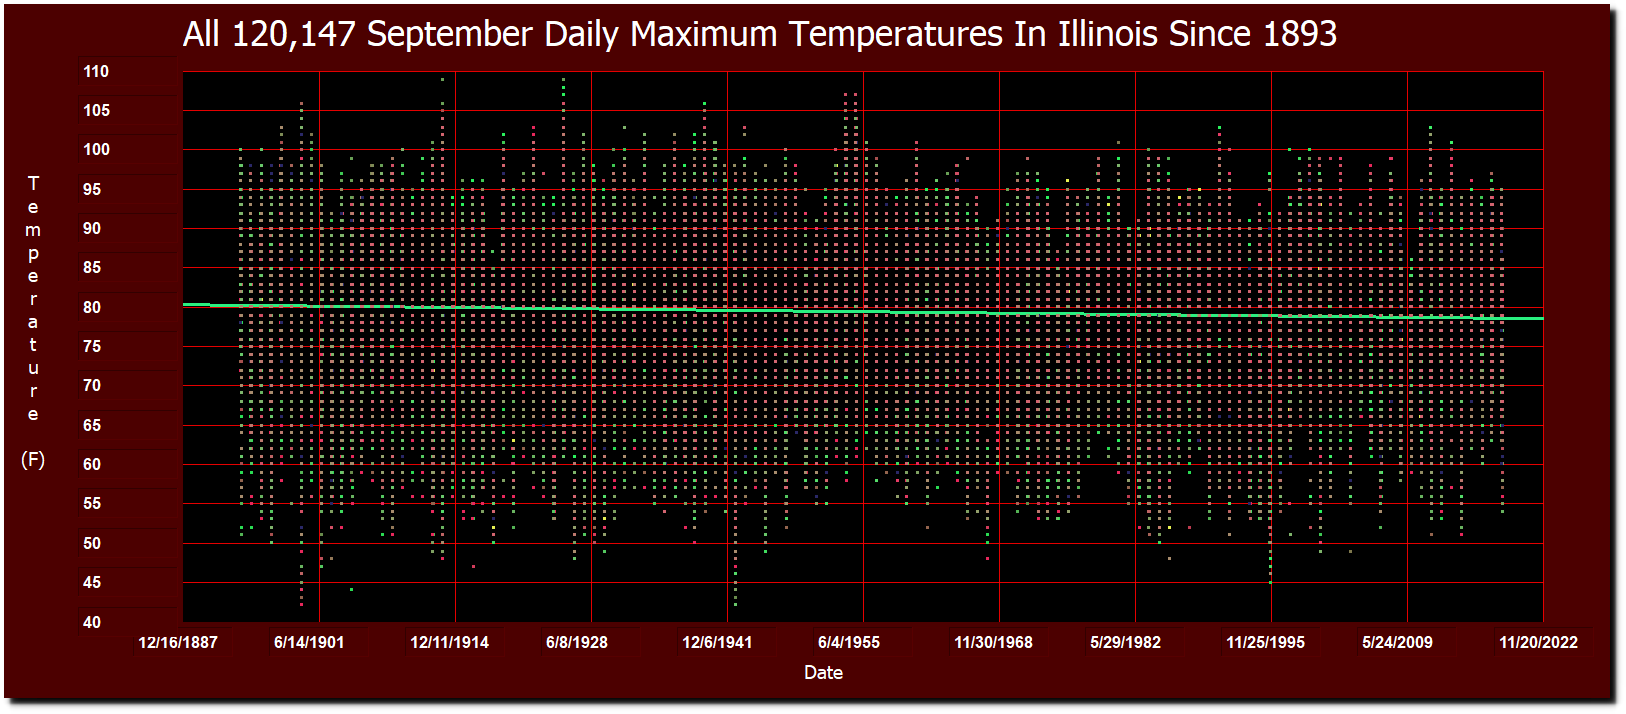
One hundred degree weather was common in Illinois during September until about 60 years ago. Now Illinois almost never gets above 100F during any month. Their hottest September was 1925, and September daily maximum temperatures have been declining 1.3F/century since the 19th century.
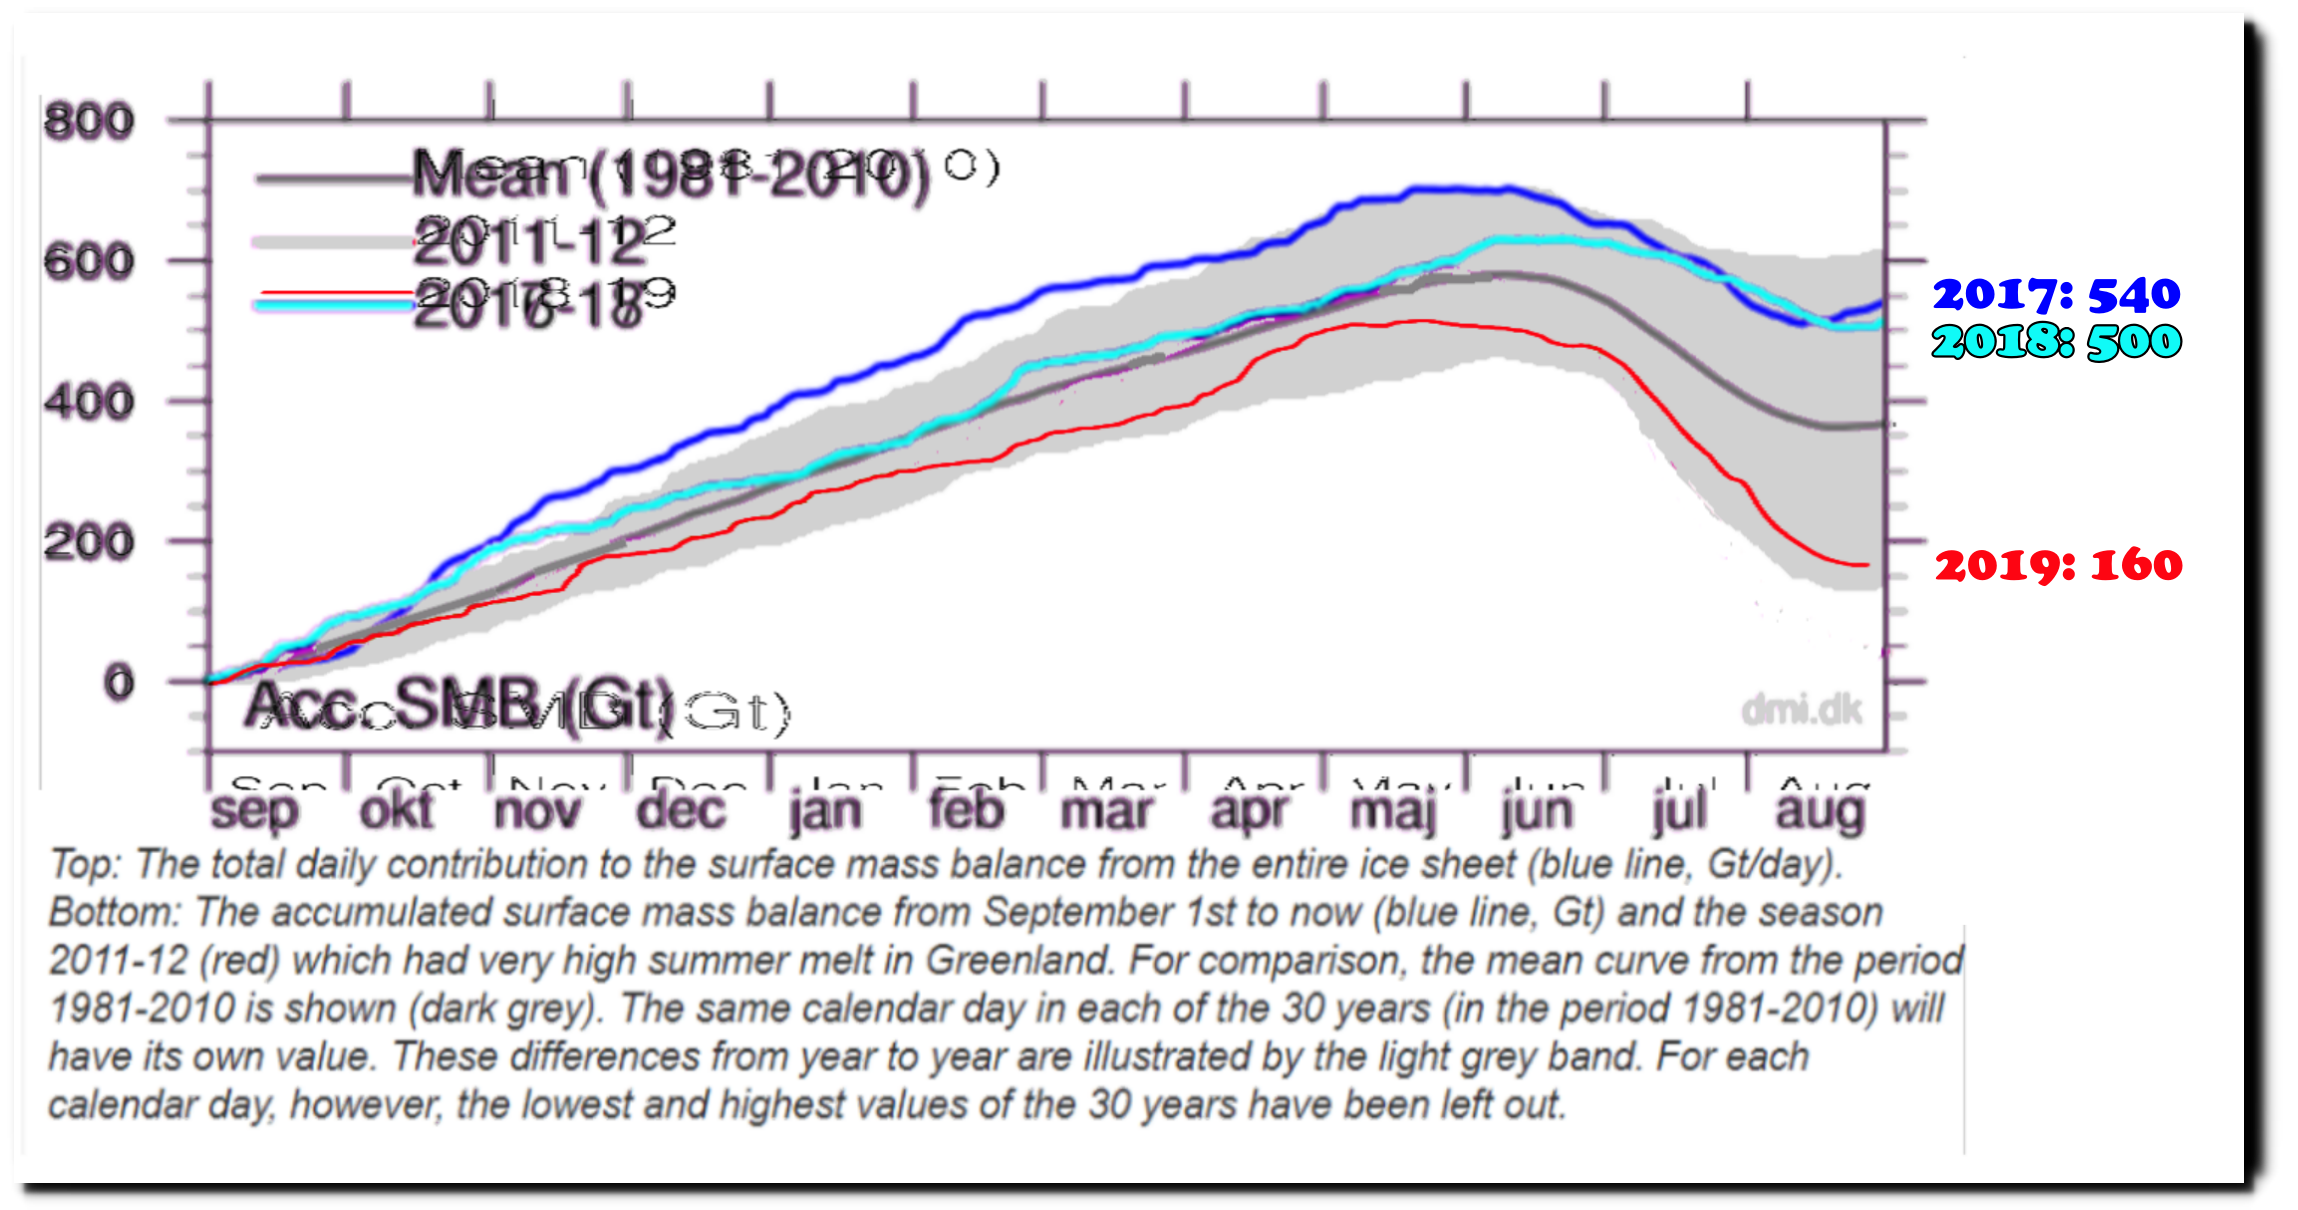
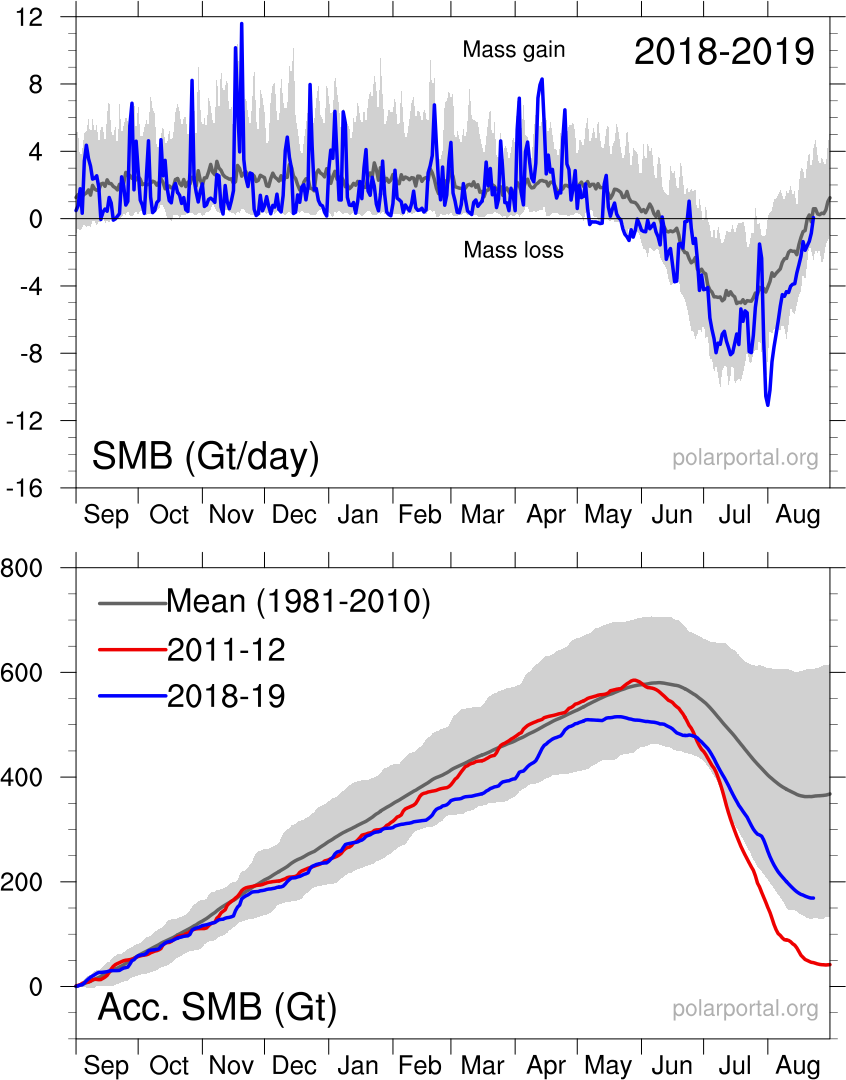
The BBC says Greenland saw record melt this year and we are all going to drown

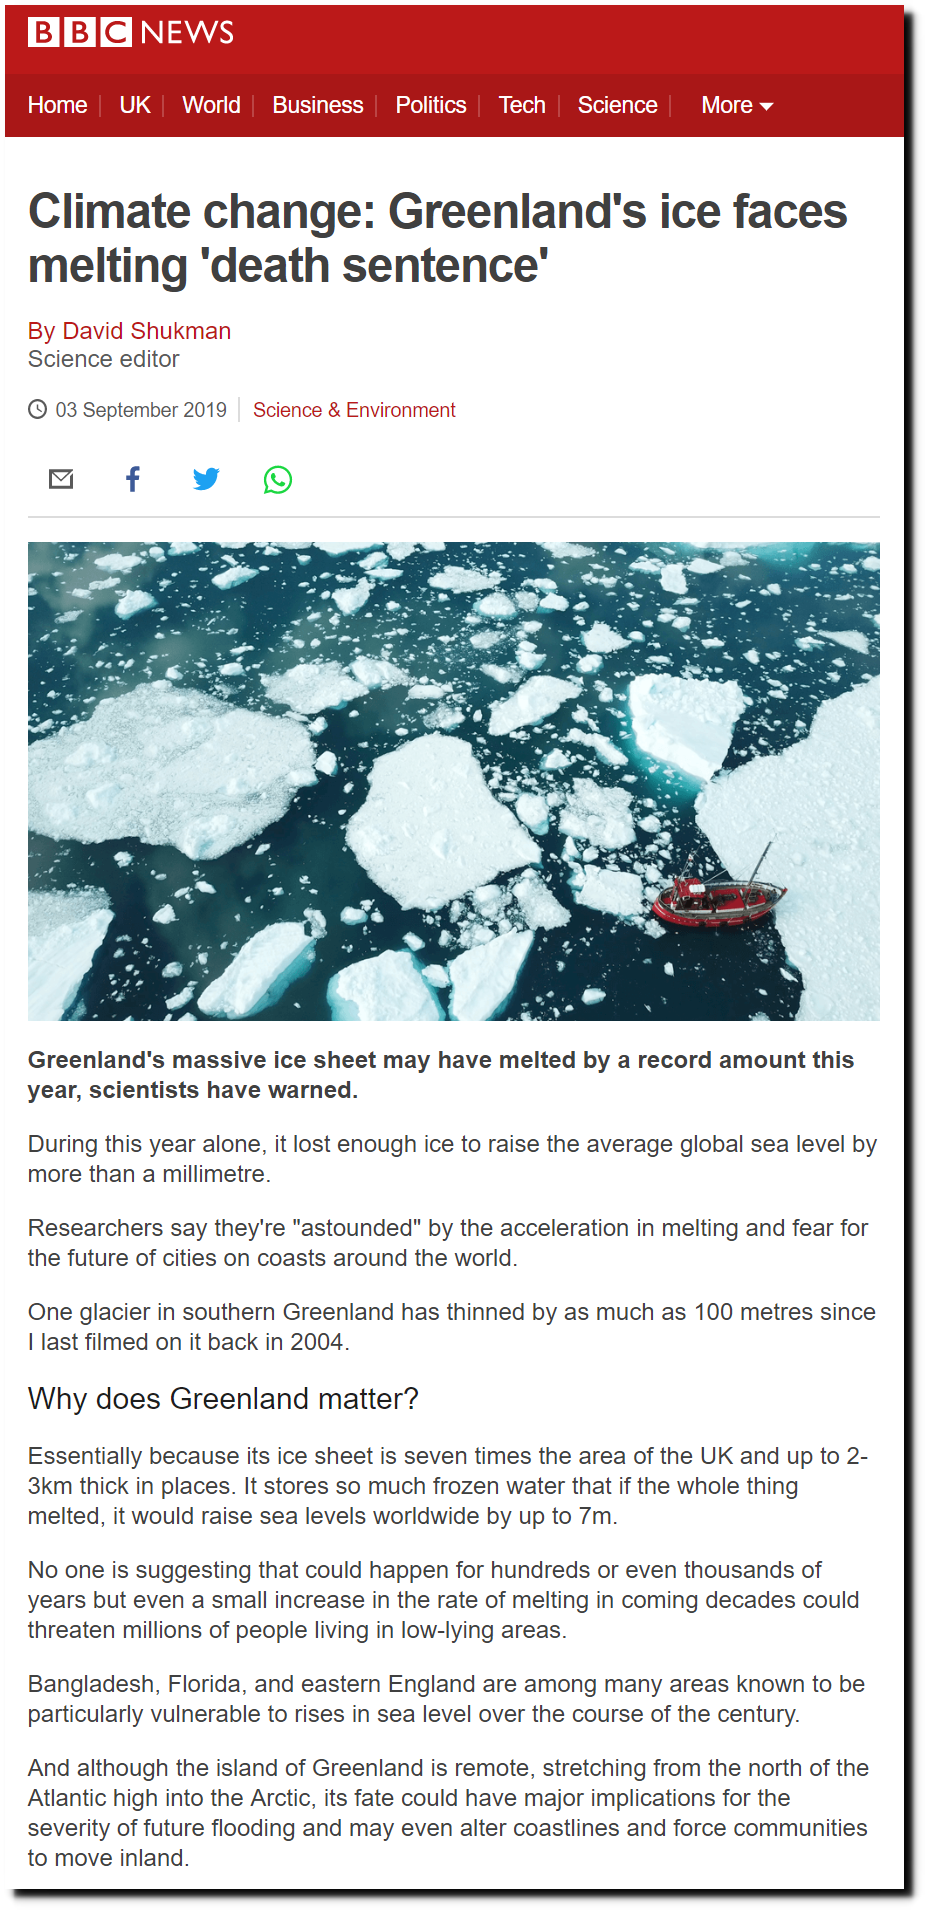
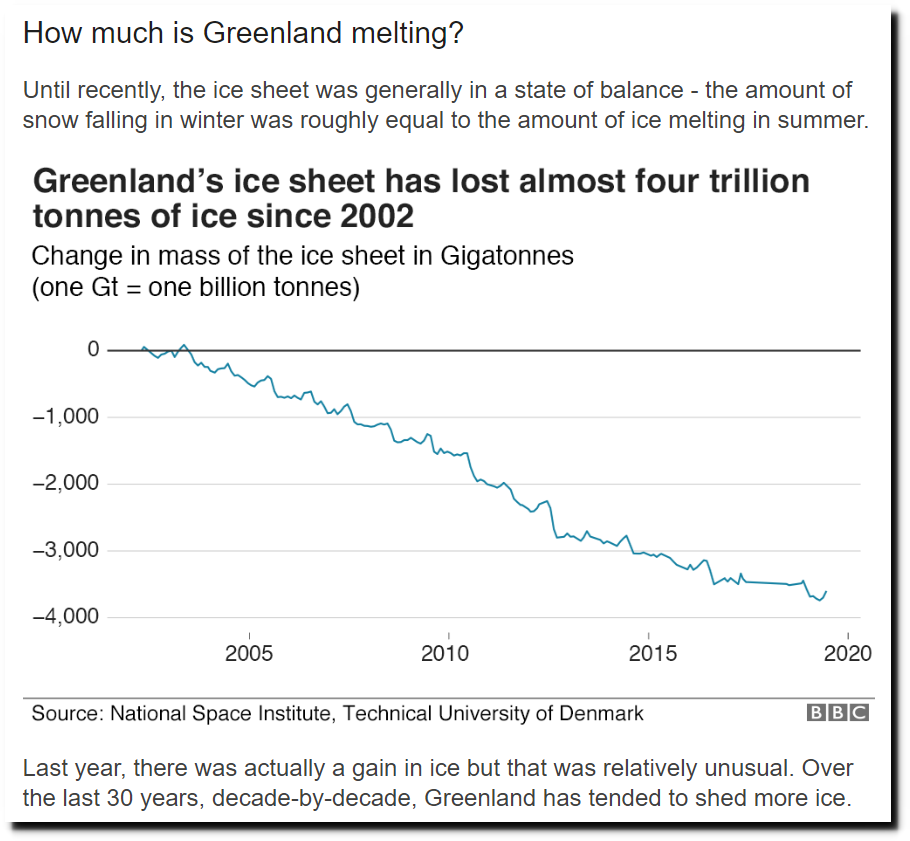
Yet the graph in article shows ice loss decelerating, not accelerating, and they say Greenland gained ice last year. There are many things wrong with this graph, but the point is that it shows other claims in the article to be wrong.
Climate change: Greenland’s ice faces melting ‘death sentence’ – BBC News
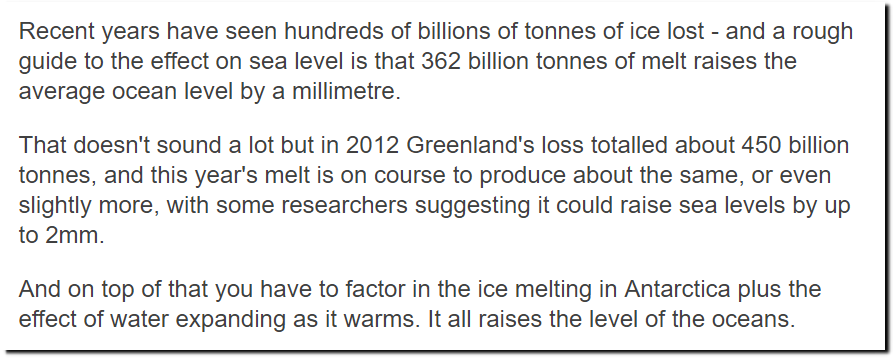
Greenland contains 2,900,000,000,000,000 tons of ice. Even if the graph was correct it would require over 12,000 years for the ice to melt.
This is essentially the same article as 80 years ago, when experts said Greenland glaciers faced “catastrophic collapse” and that seaports were going to drown. The difference being that in 1939 Greenland actually was melting down.

17 Dec 1939, Page 15 – Harrisburg Sunday Courier

18 Feb 1952 – POLAR ICE THAW INCREASING
Melt was nowhere near a record this year, and 170 billion tons more snow fell on the surface during the winter than melted during the summer.
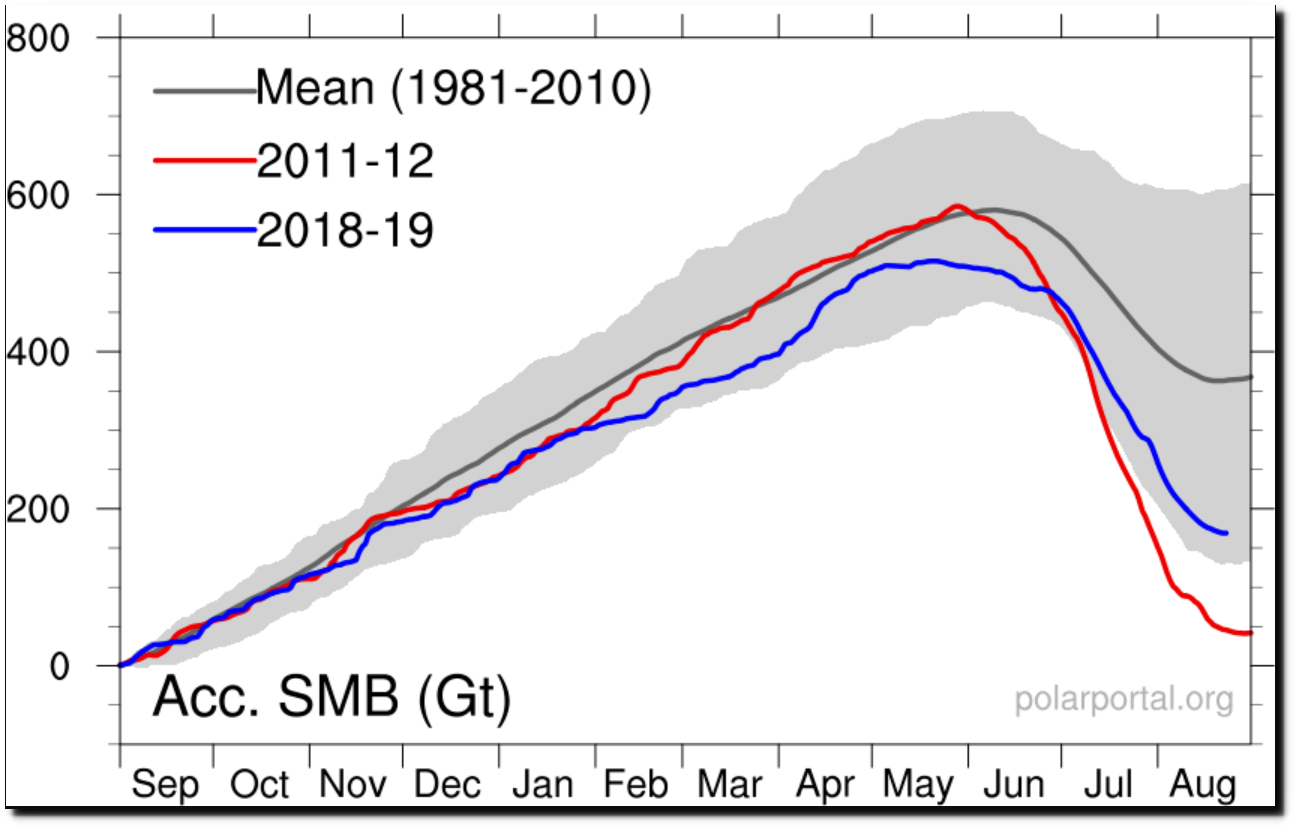
The surface mass balance (surface gain minus surface melt) shows a 1.2 trillion ton increase in mass over the last three years.
Tide gauges show no indication of an acceleration in sea level rise. Many show no sea level rise at all.
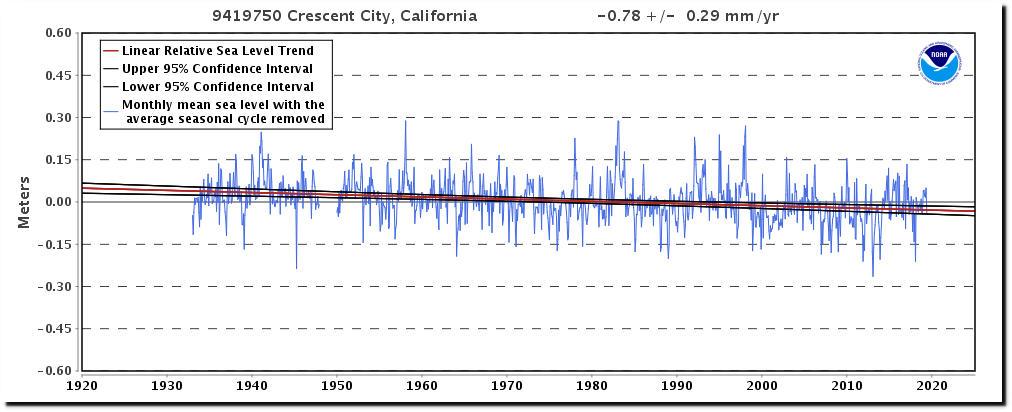
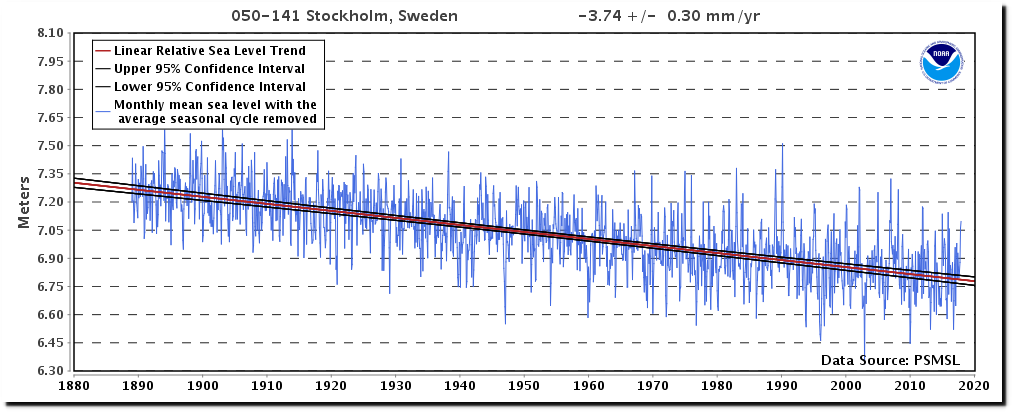
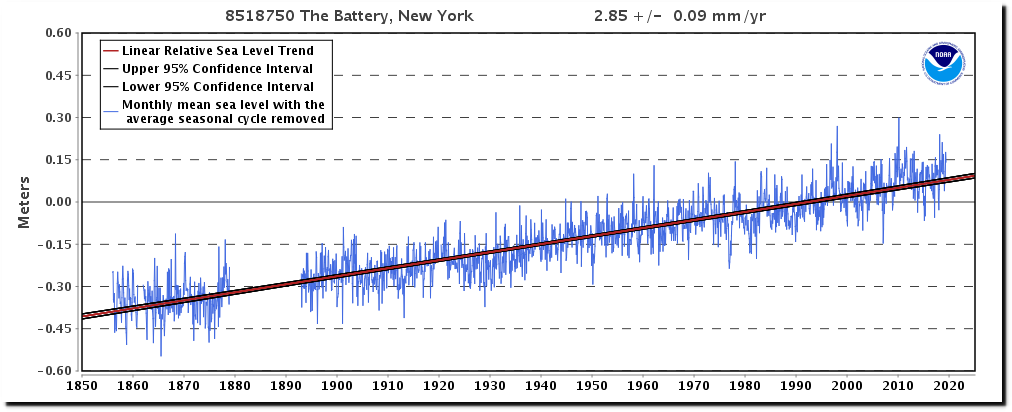
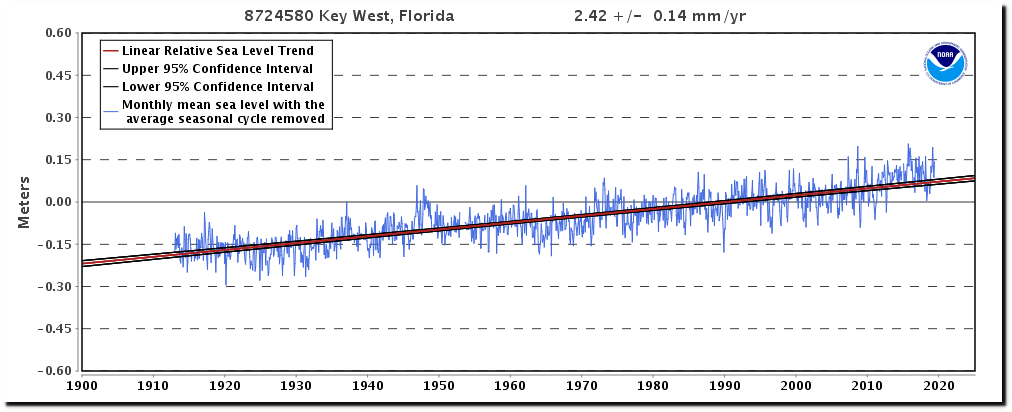
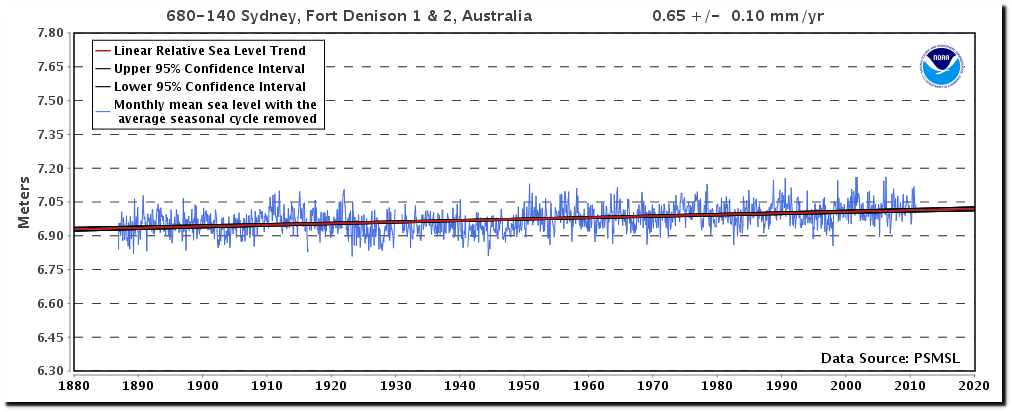
Sea Level Trends – NOAA Tides & Currents
In 2002, the BBC discussed a 9,000 year old city which is now 120 feet underwater. Apparently their SUV usage did them in.
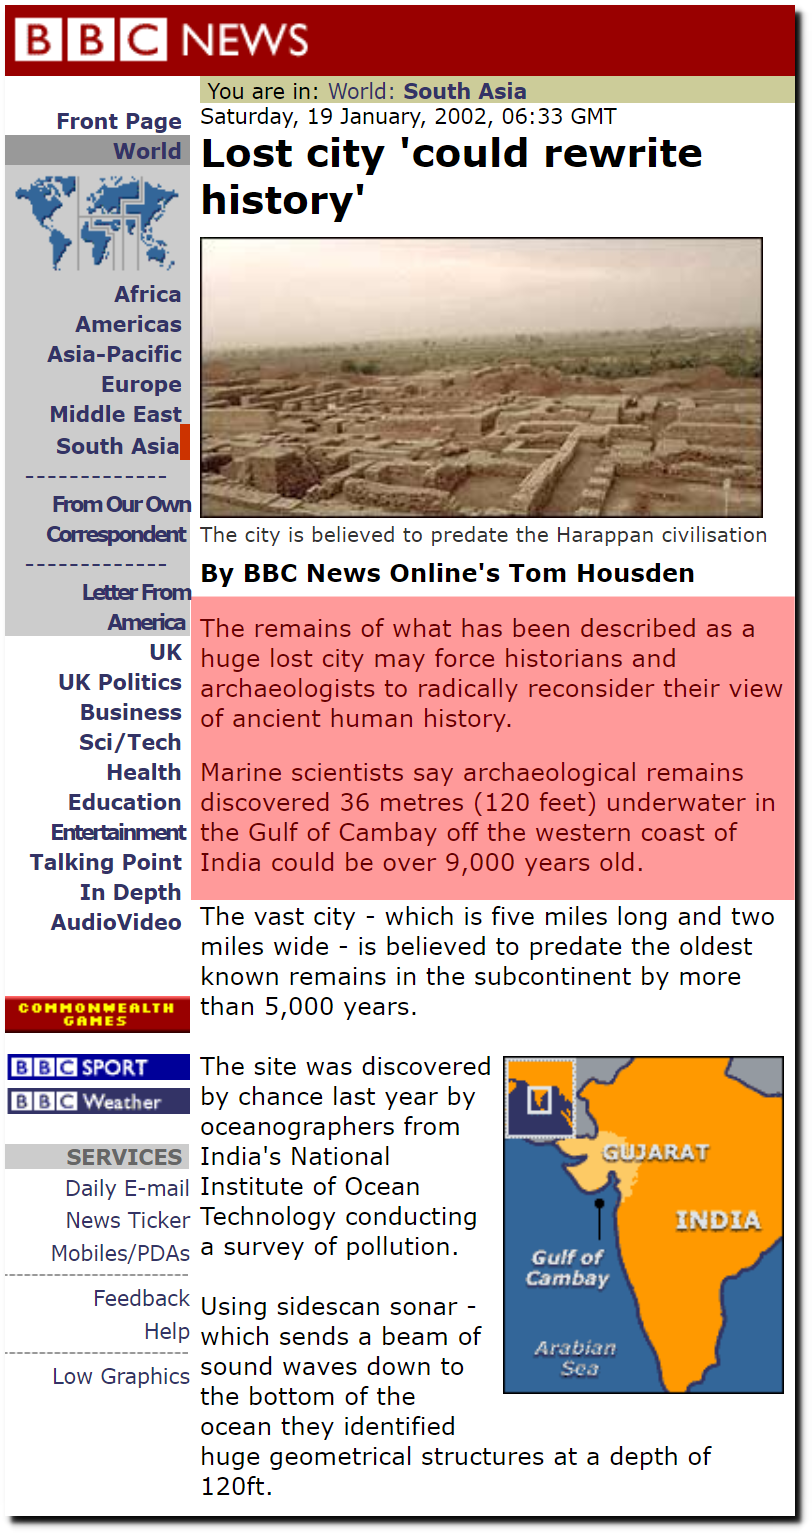
BBC News | SOUTH ASIA | Lost city ‘could rewrite history’
Like essentially all climate journalism, the BBC completely disregards the truth with their junk science and propaganda.
“On Monday Night last blew the most violent Hurricane that has ever been known”
– September 4, 1772” a divine rebuke to human vanity and pomposity”
– Alexander Hamilton
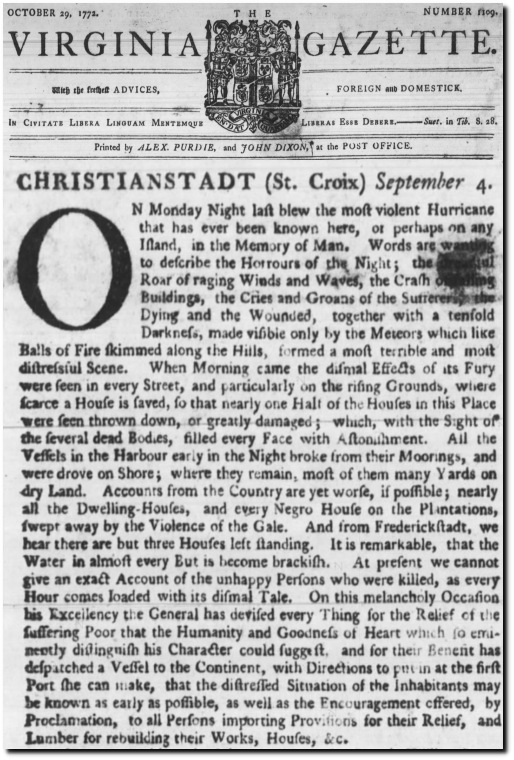
29 Oct 1772, Page 1 – The Virginia Gazette at Newspapers.com
“every house almost at Christianstadt, and all the plantations and negro-houses leveled. Only three houses left standing at Frederickstadt, and numbers of people killed.”
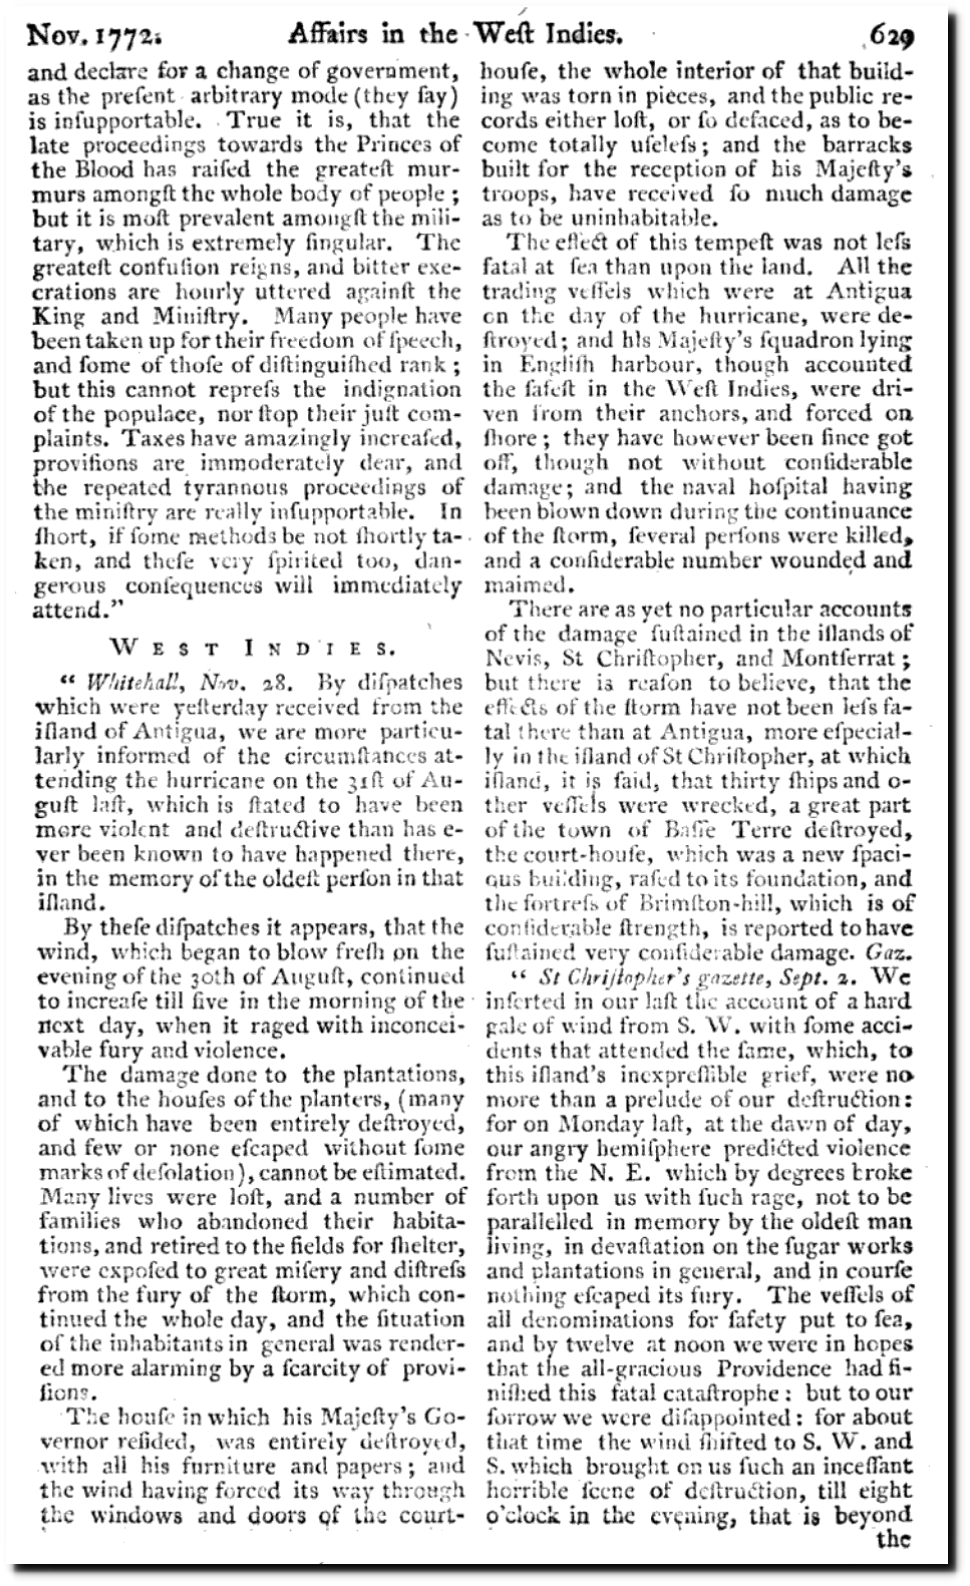

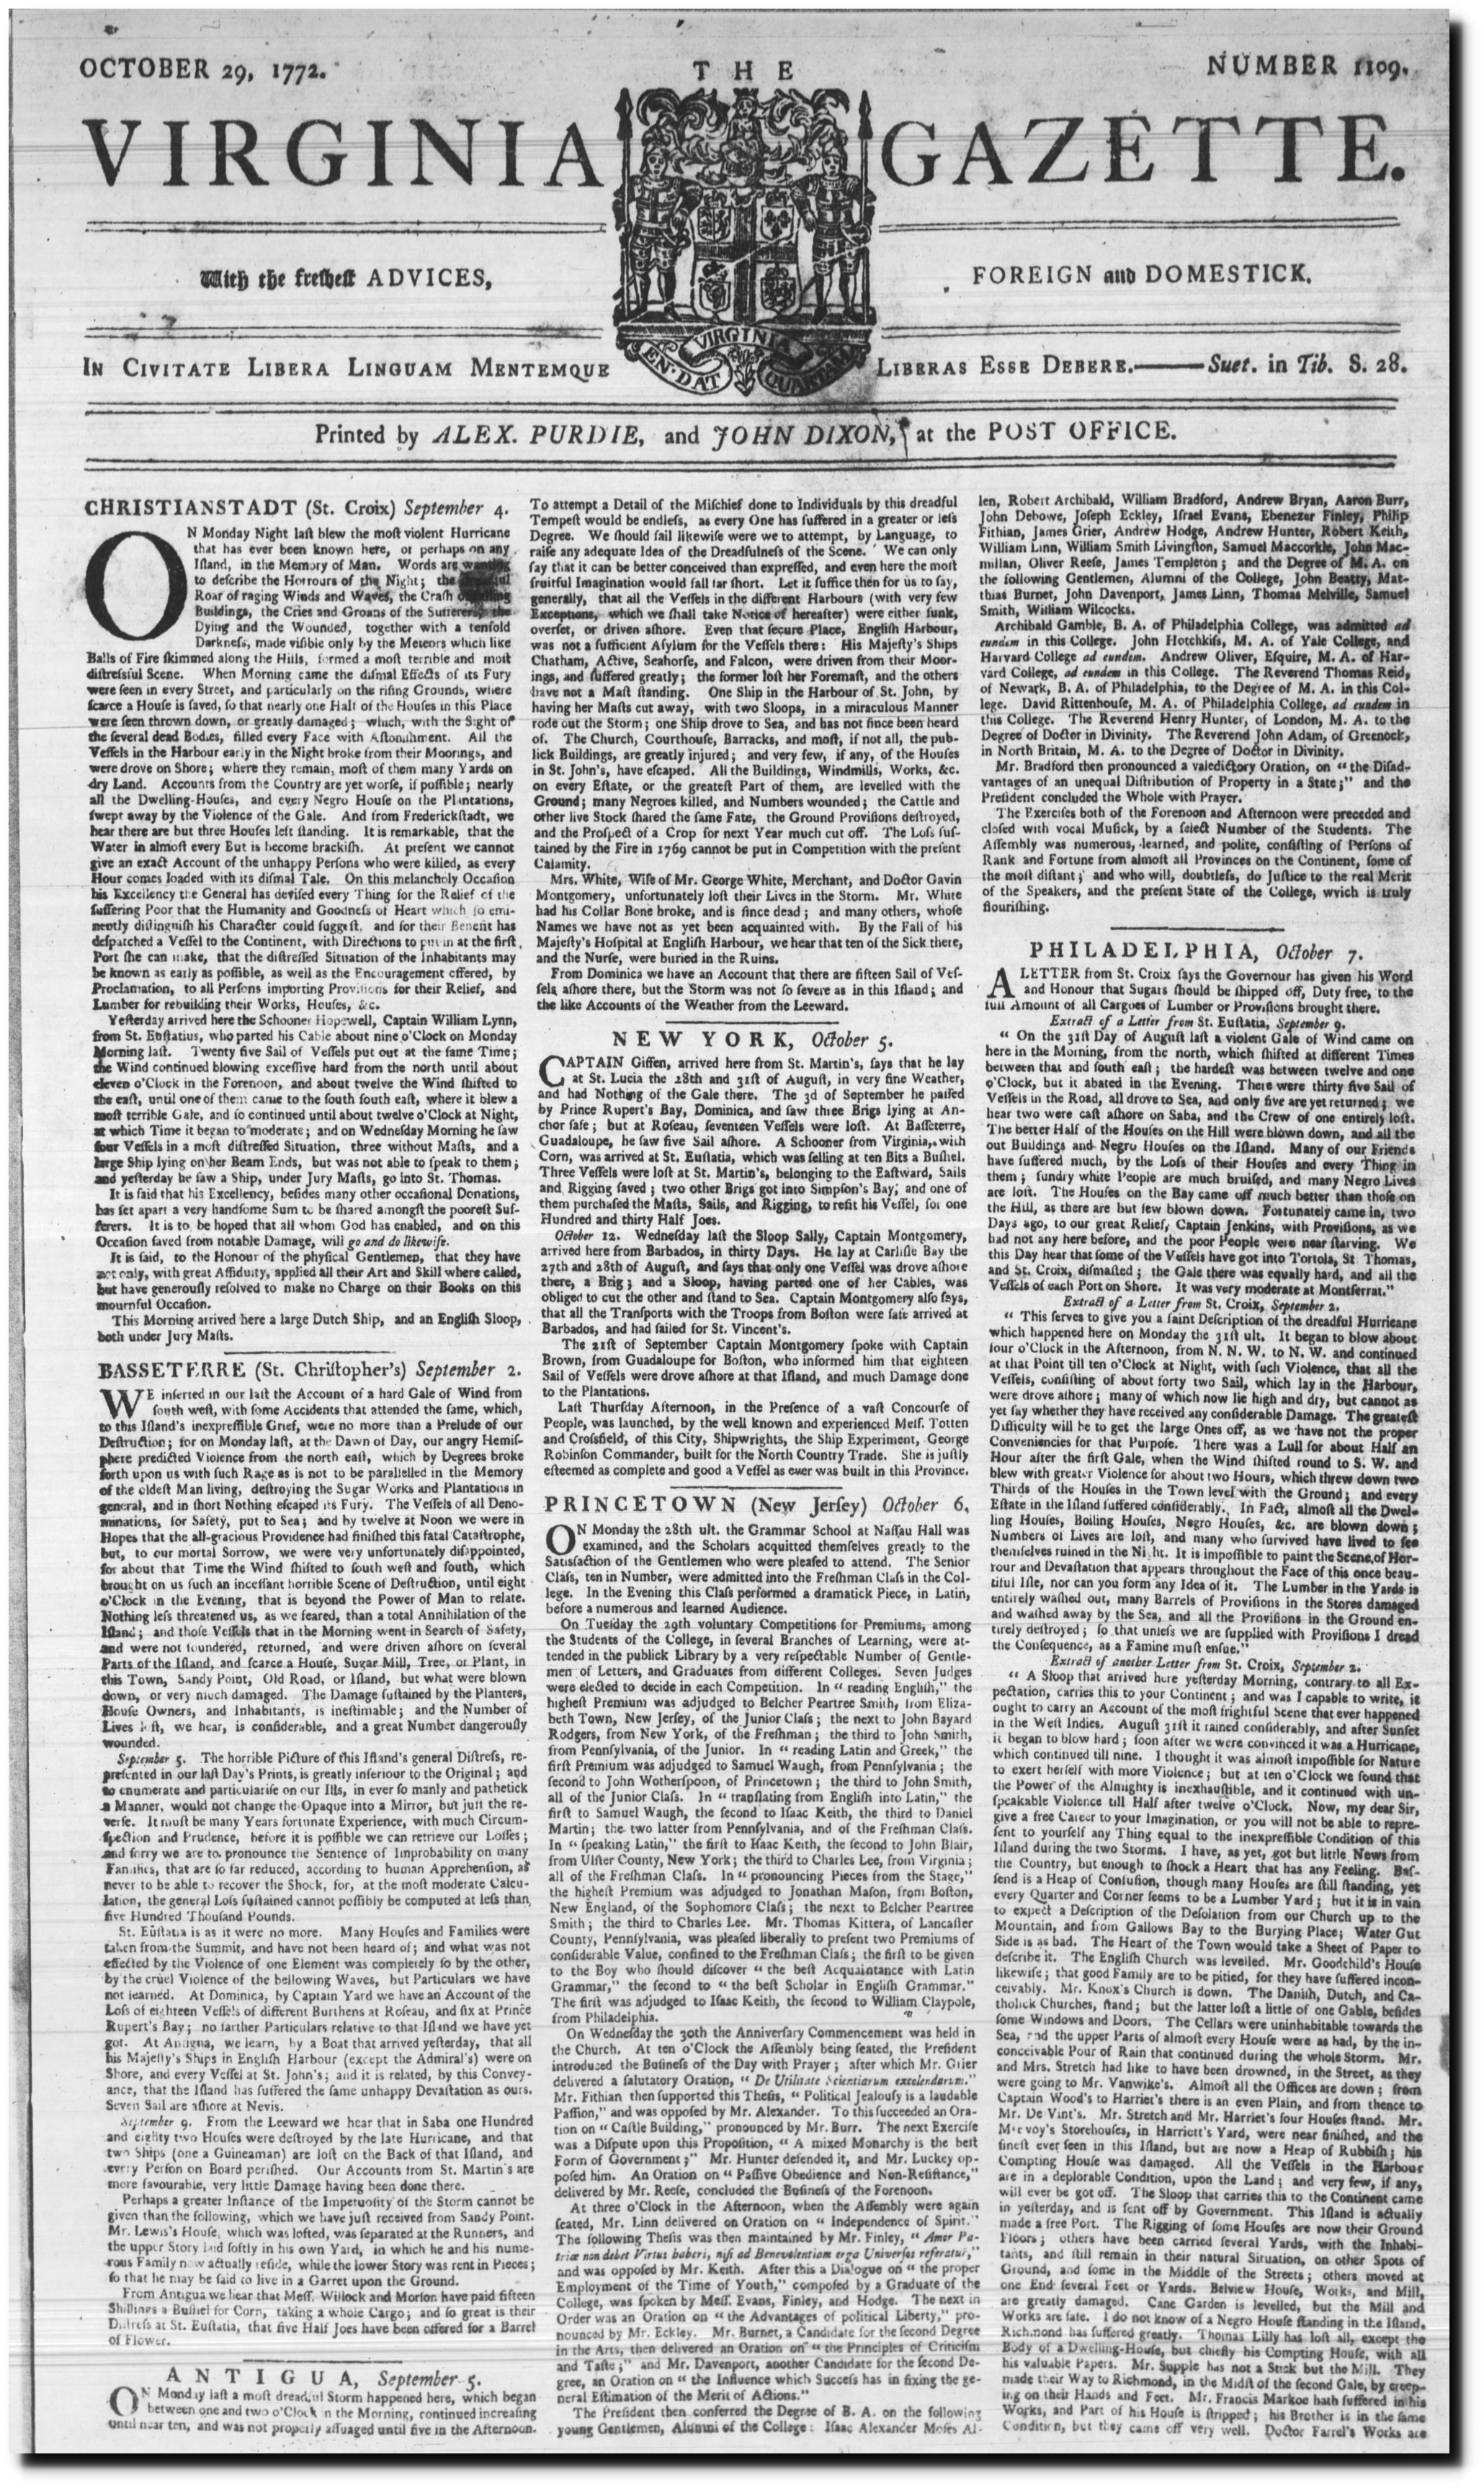
29 Oct 1772, Page 1 – The Virginia Gazette at Newspapers.com
Instead of homogenizing in a huge number of incoherent stations, only high quality long term stations should be included in the Australian temperature record. But entertaining how NOAA and BOM pretend they are doing something useful when they generate their temperature graphs.
Alice Springs has had 227 days over 110F (43C) since 1878. Nearly two thirds of those days occurred before 1910, so BOM makes them magically disappear.

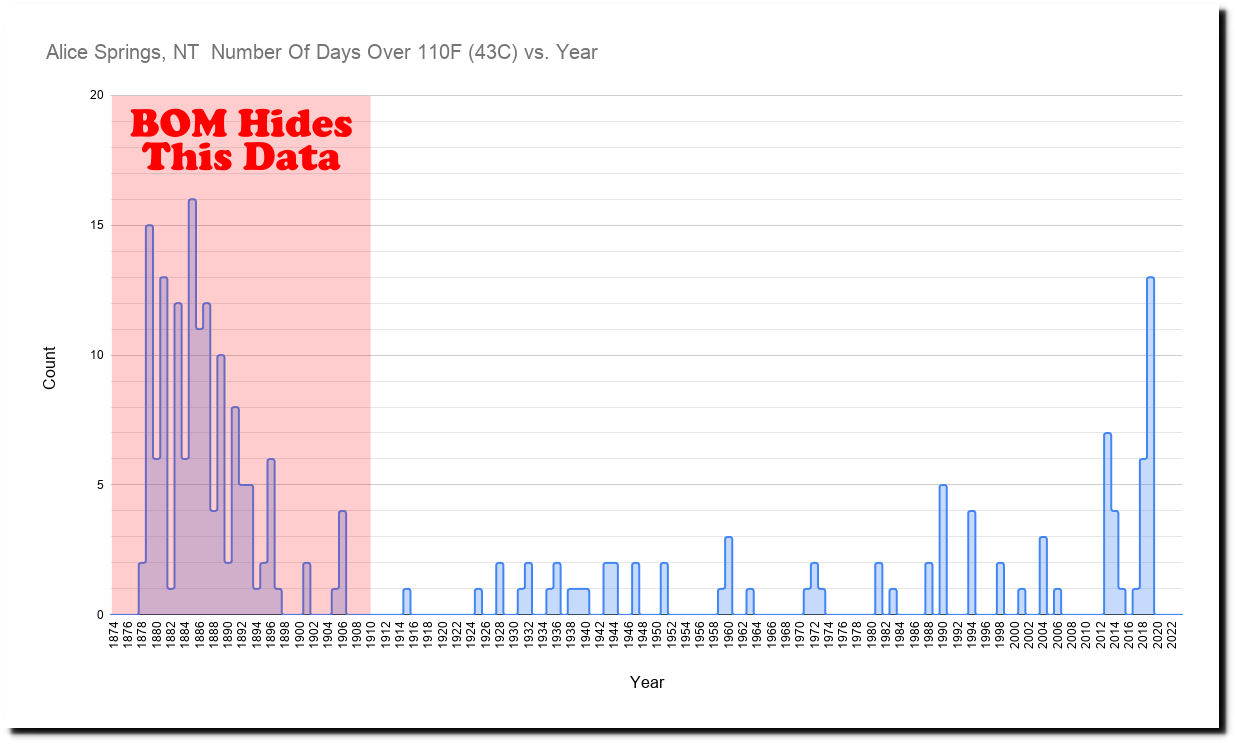
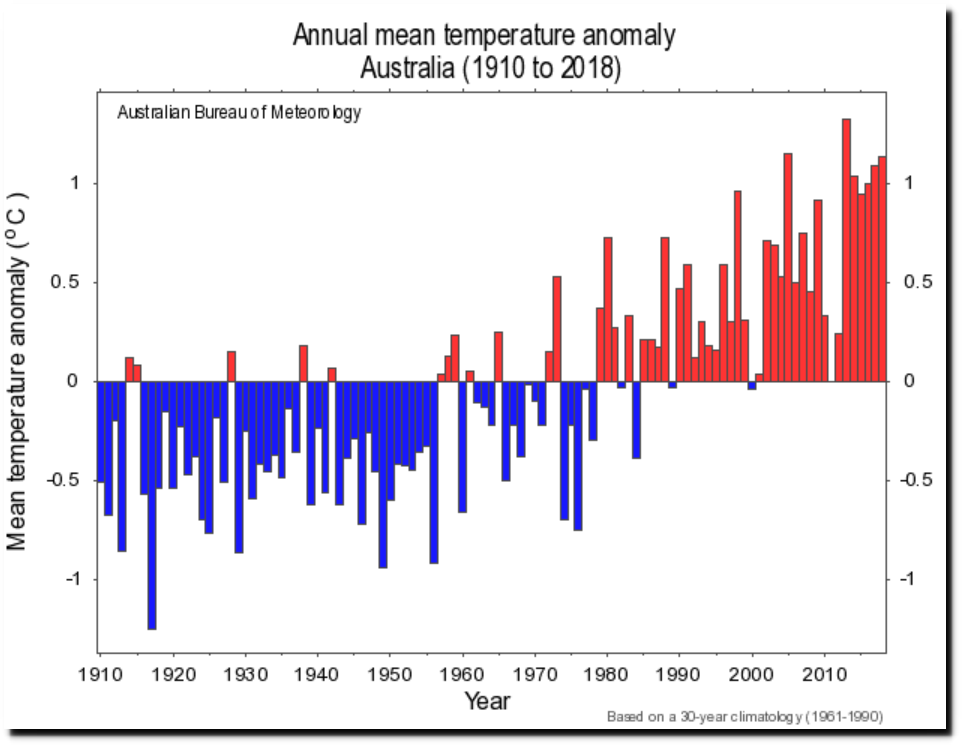
Climate change and variability: Tracker: Australian timeseries graphs
BOM throws out temperature readings of 117.5 degrees, because they have a theory the readings might be off by half a degree. One of the most pathetic excuses for data tampering.

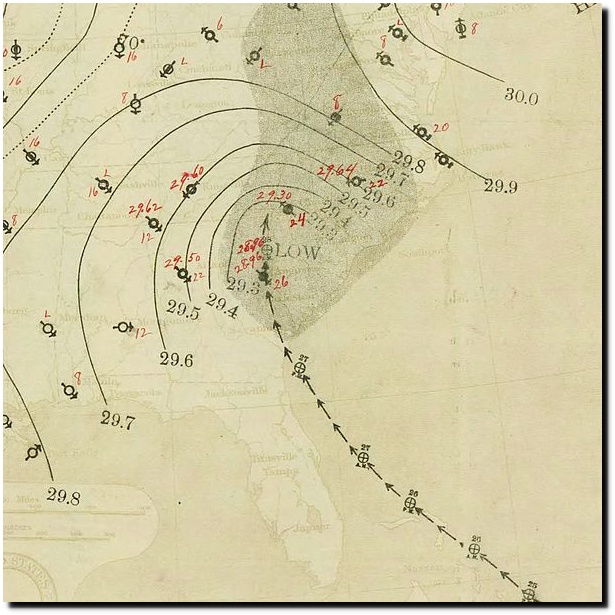
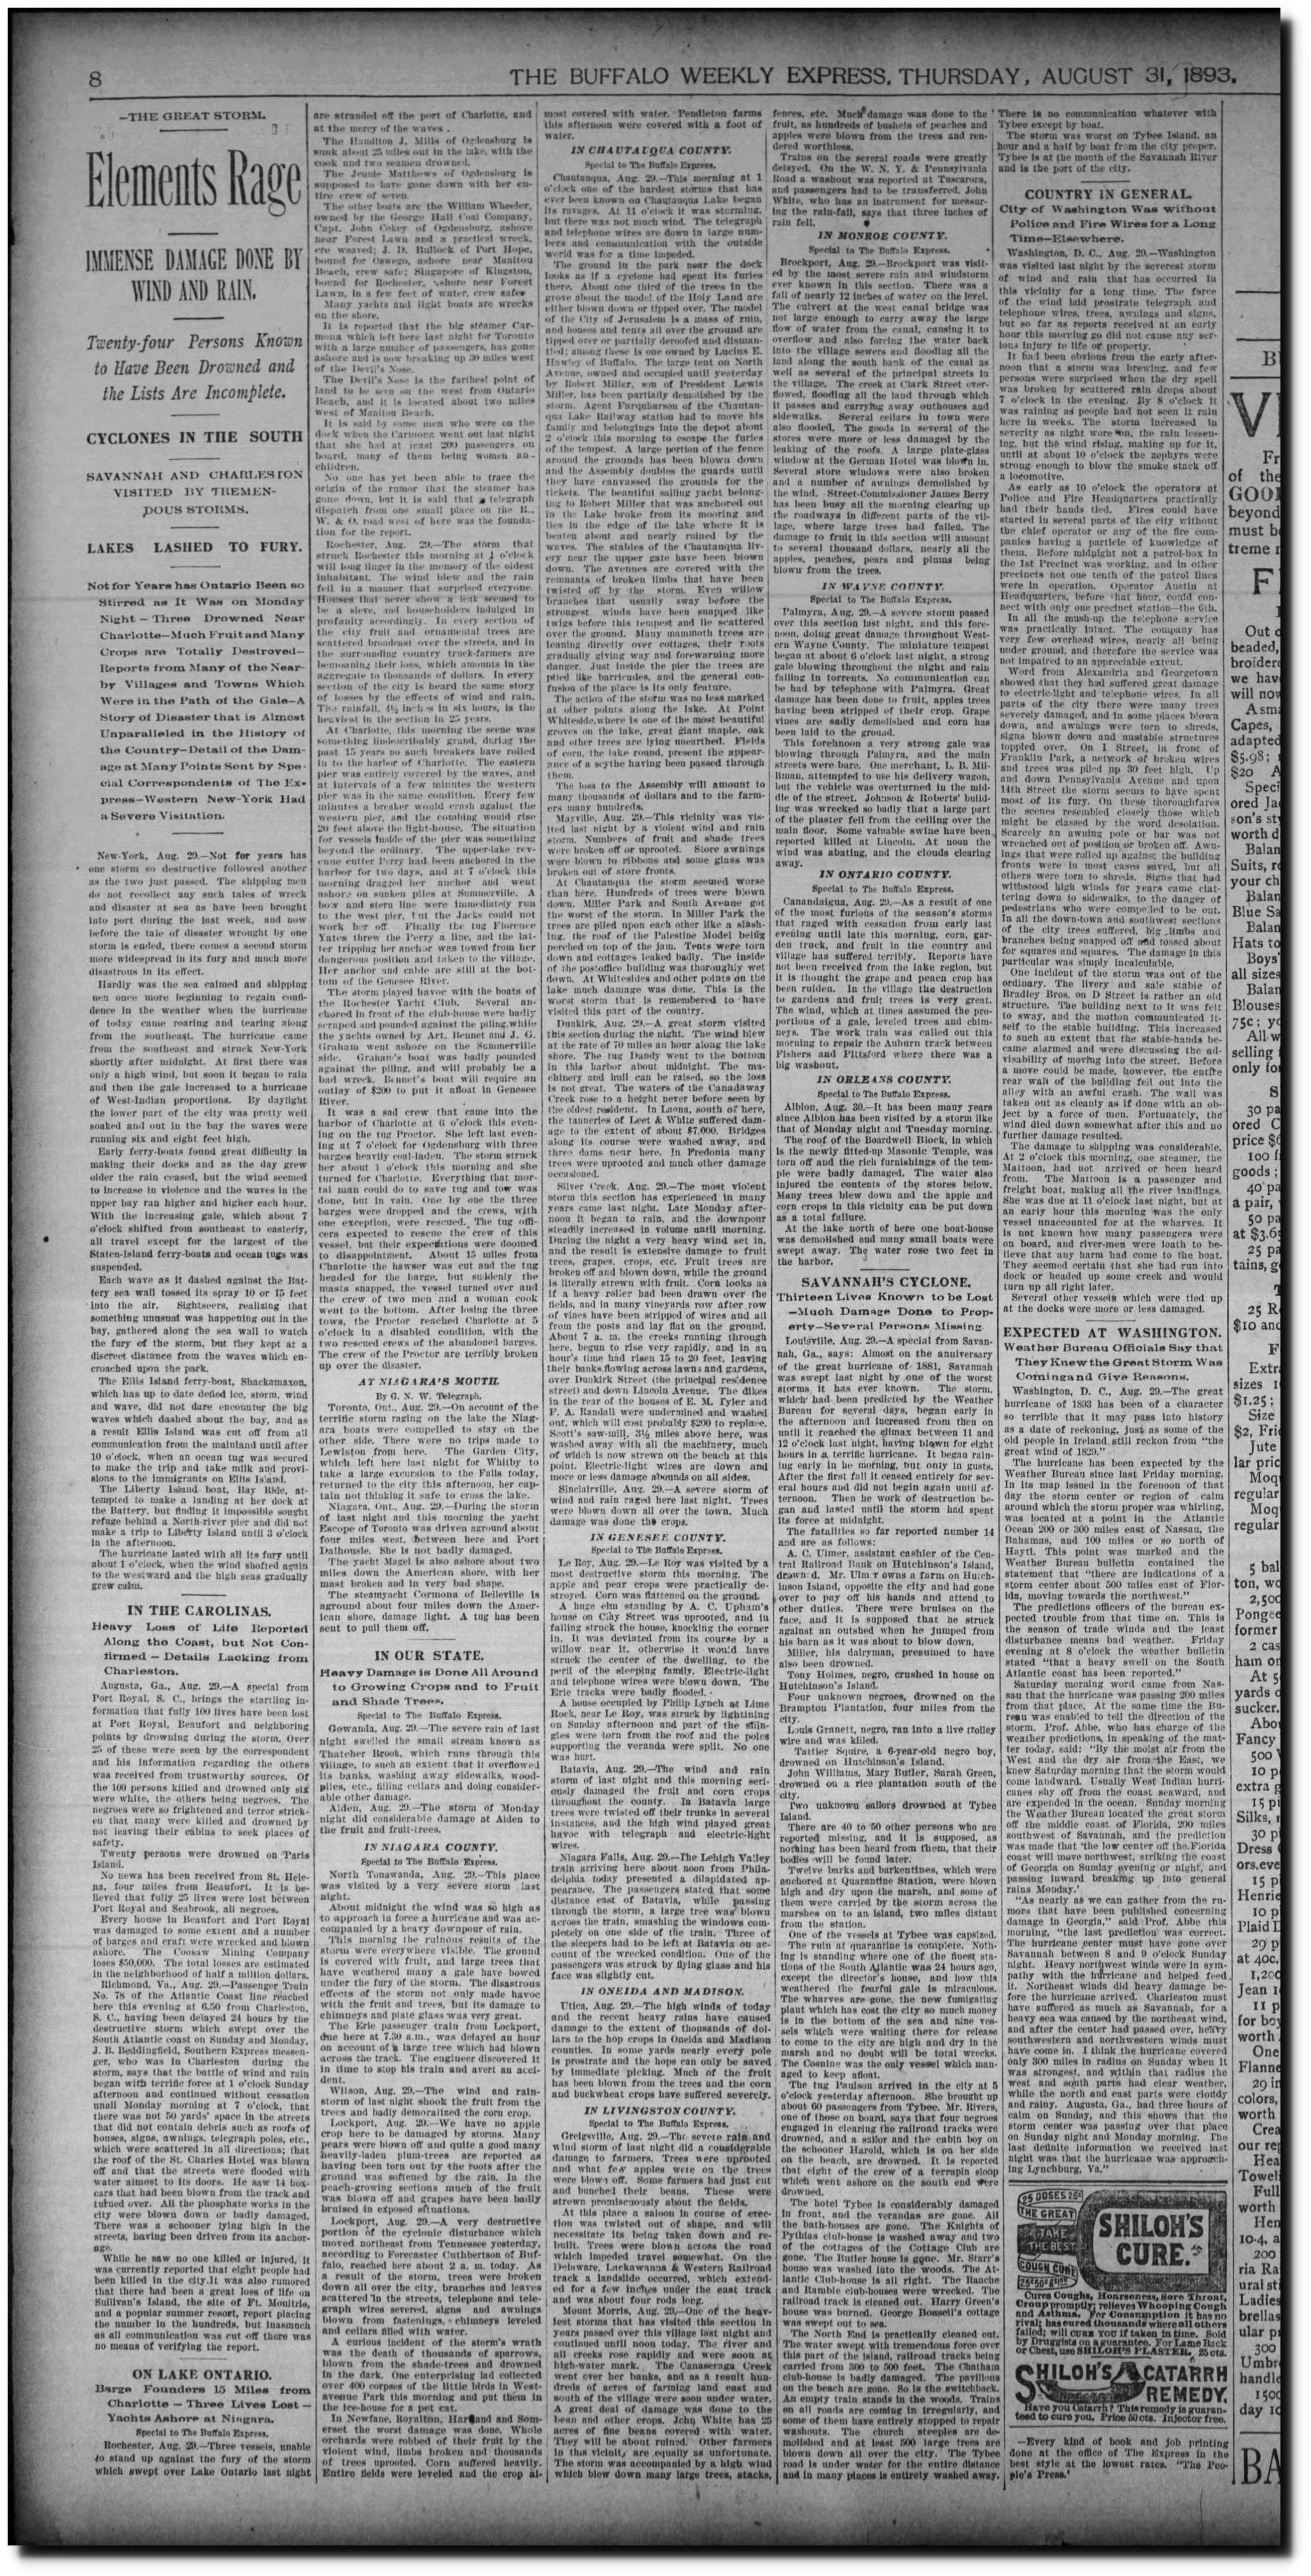
The hurricane season of 1893 was one of the most active on record. Two of the ten deadliest US hurricanes hit that year. Three major hurricanes hit the US, as well as a category 2 in October. This week in 1893, the Sea Island Hurricane destroyed Savannah, Georgia – with CO2 levels below 300 PPM.
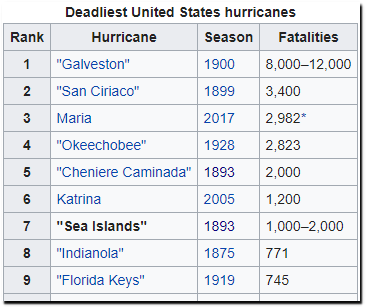
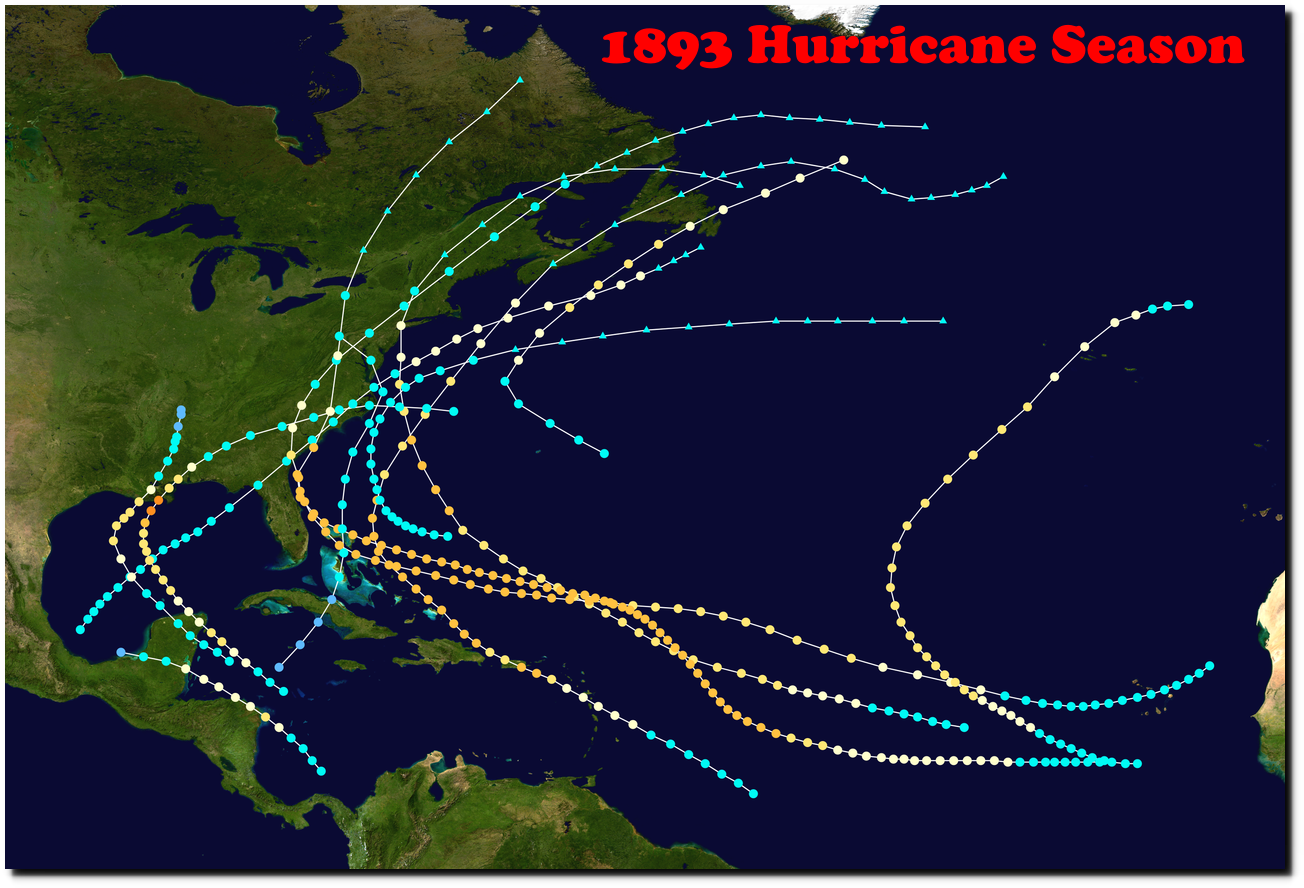
1893 Atlantic hurricane season – Wikipedia
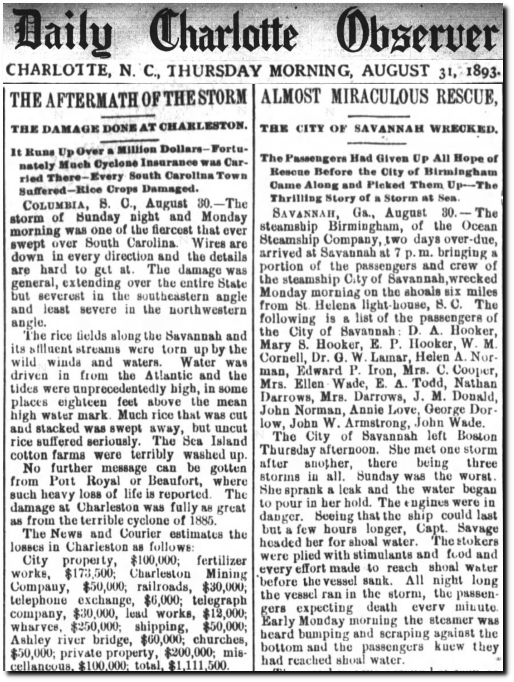
31 Aug 1893, Page 1 – The Charlotte Observer at Newspapers.com
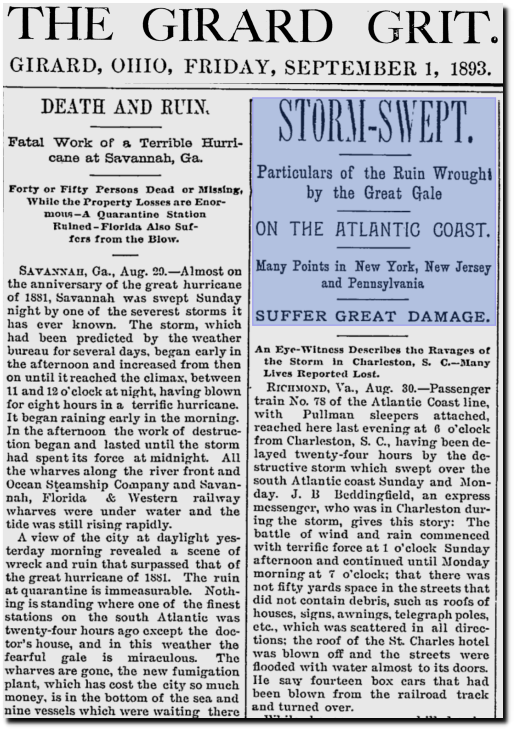
The Girard Grit – Google News Archive Search
