
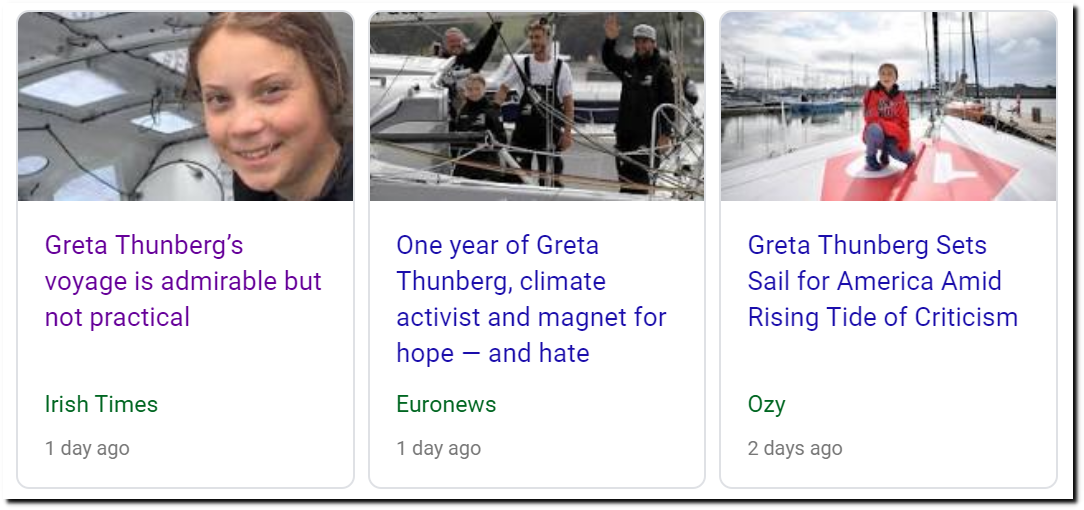
Seth Borenstein has taken Greenland propaganda to an impressive new level.

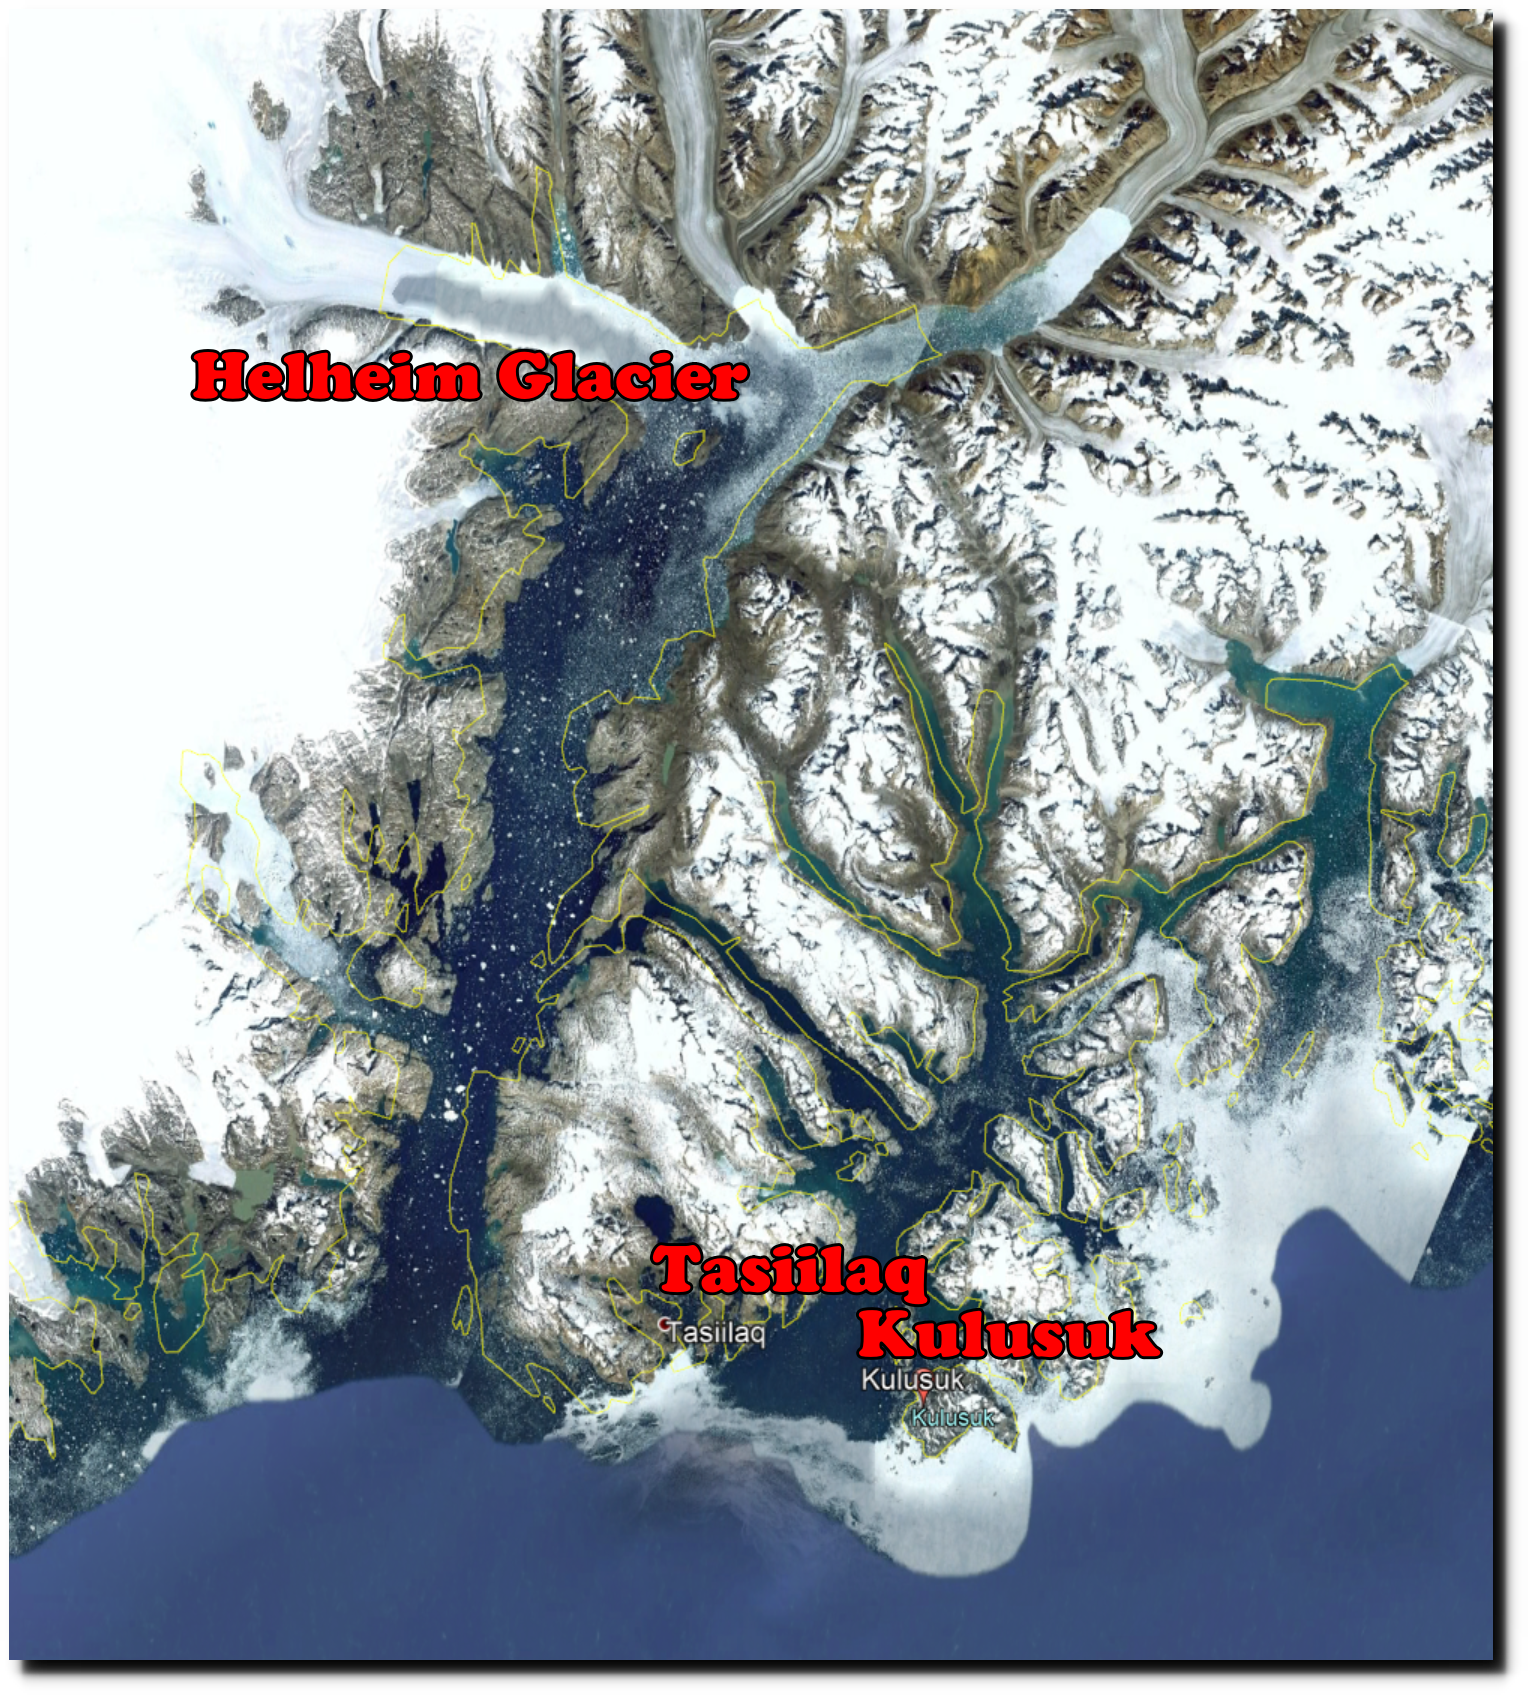
Greenland’s glaciers are melting like never before, especially Helheim – Los Angeles Times
Looking at his claims individually.
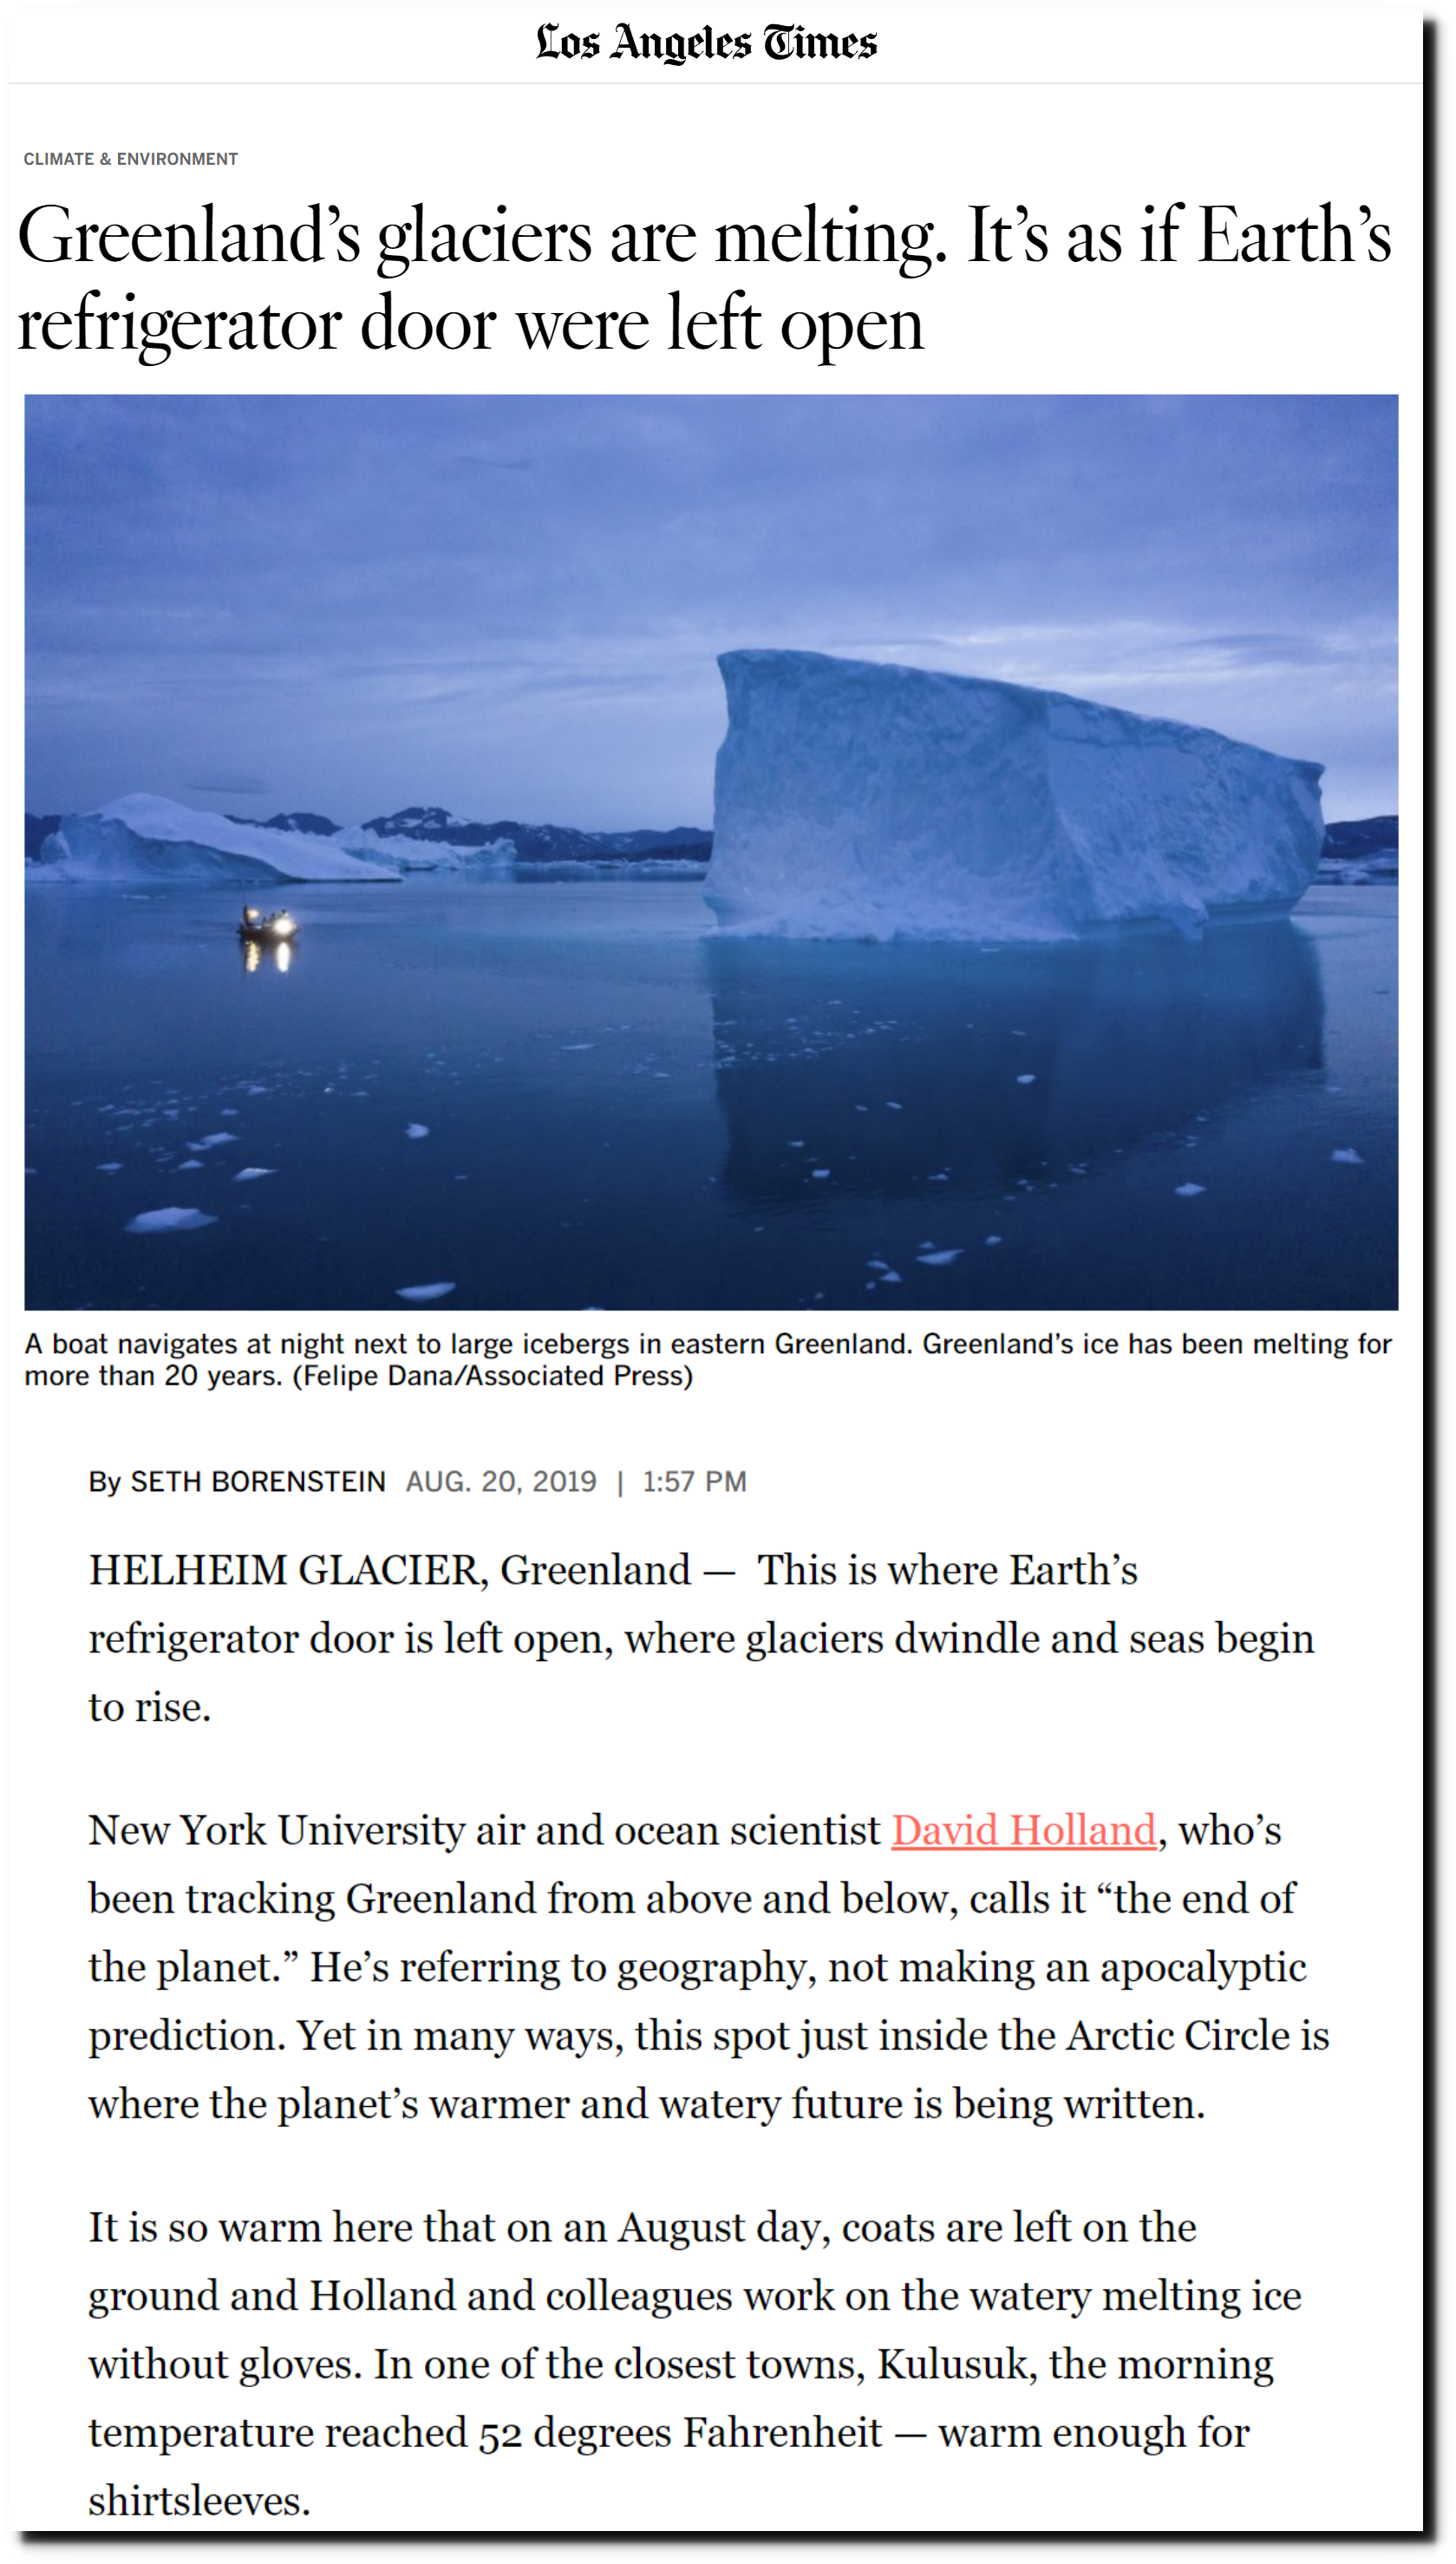
This is where Earth’s refrigerator door is left open, where glaciers dwindle and seas begin to rise.
Nonsense. Sea level has been rising for 20,000 years – most of the time much faster than at present. There is much less ice on Earth than there was 20,000 years ago – when New York and Chicago were under more than a mile of ice.
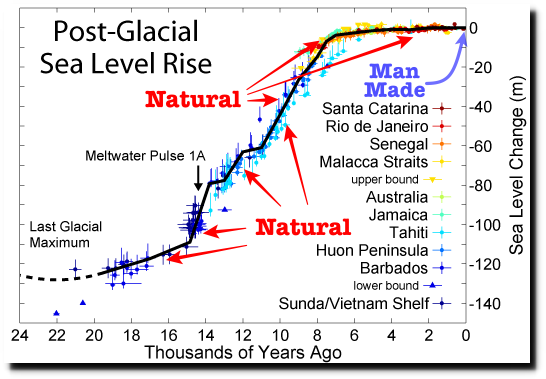
File:Post-Glacial Sea Level.png – Wikimedia Commons
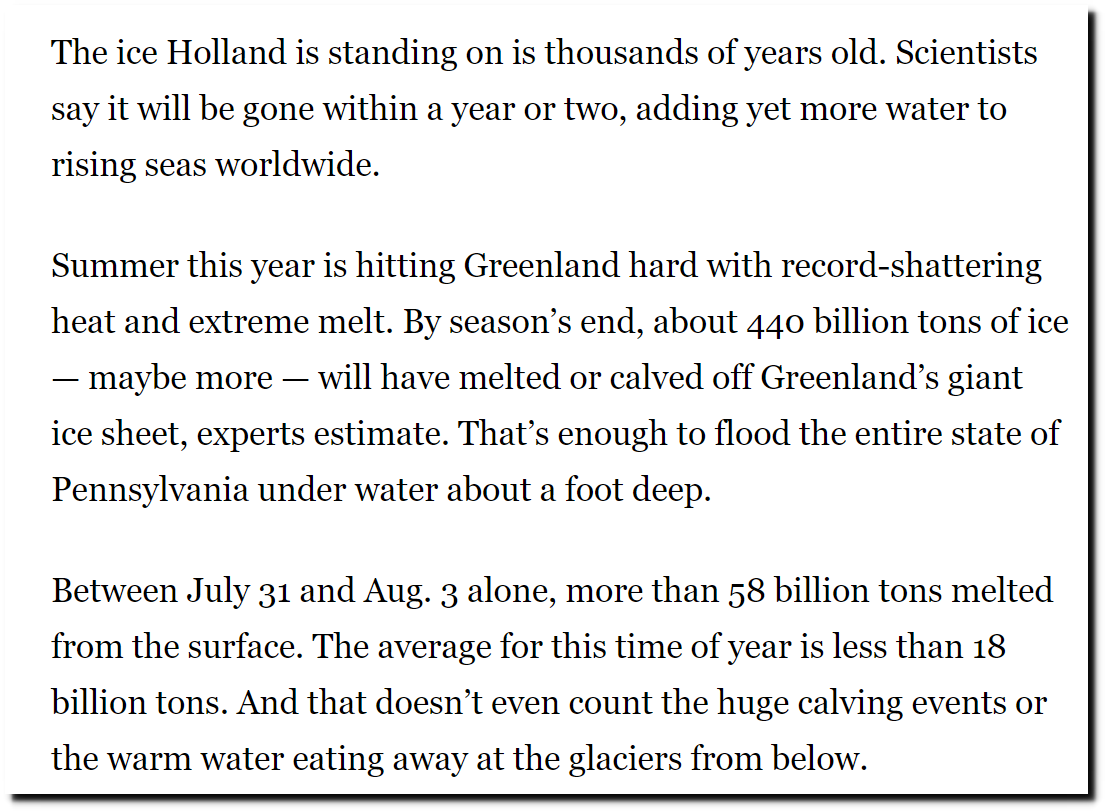
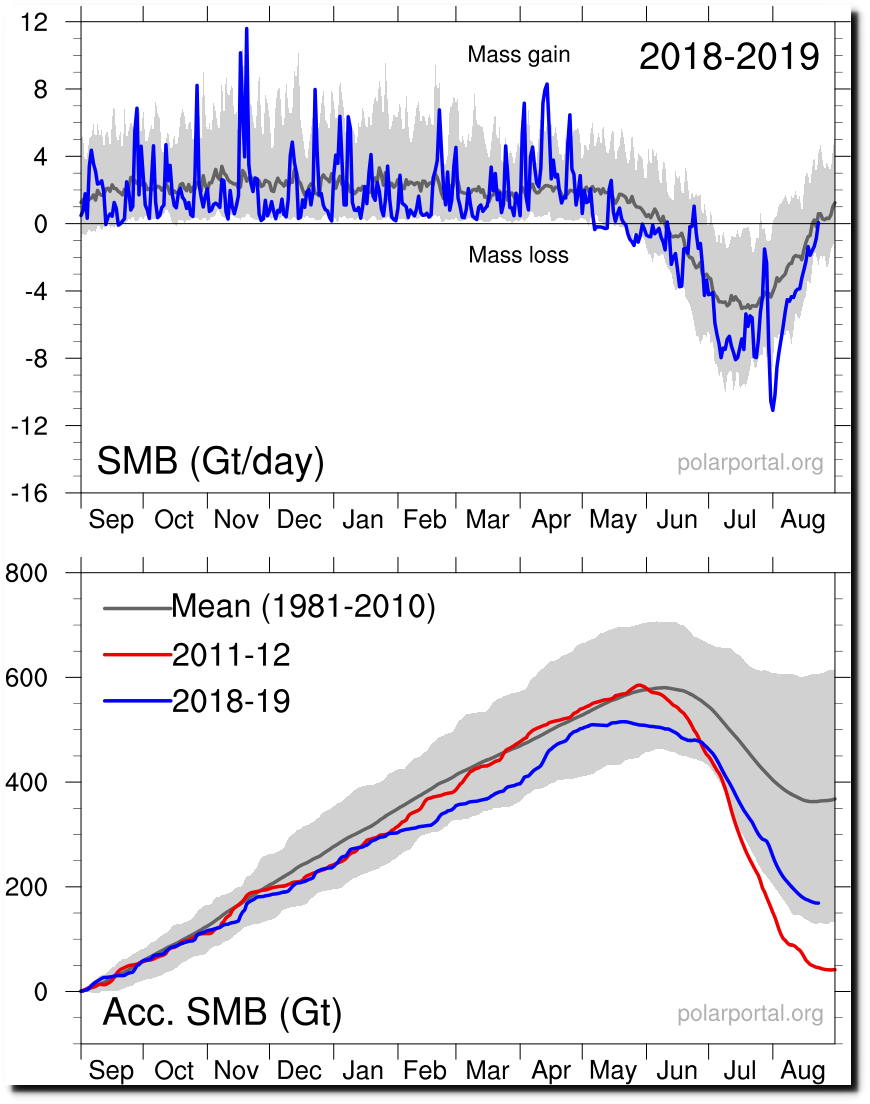
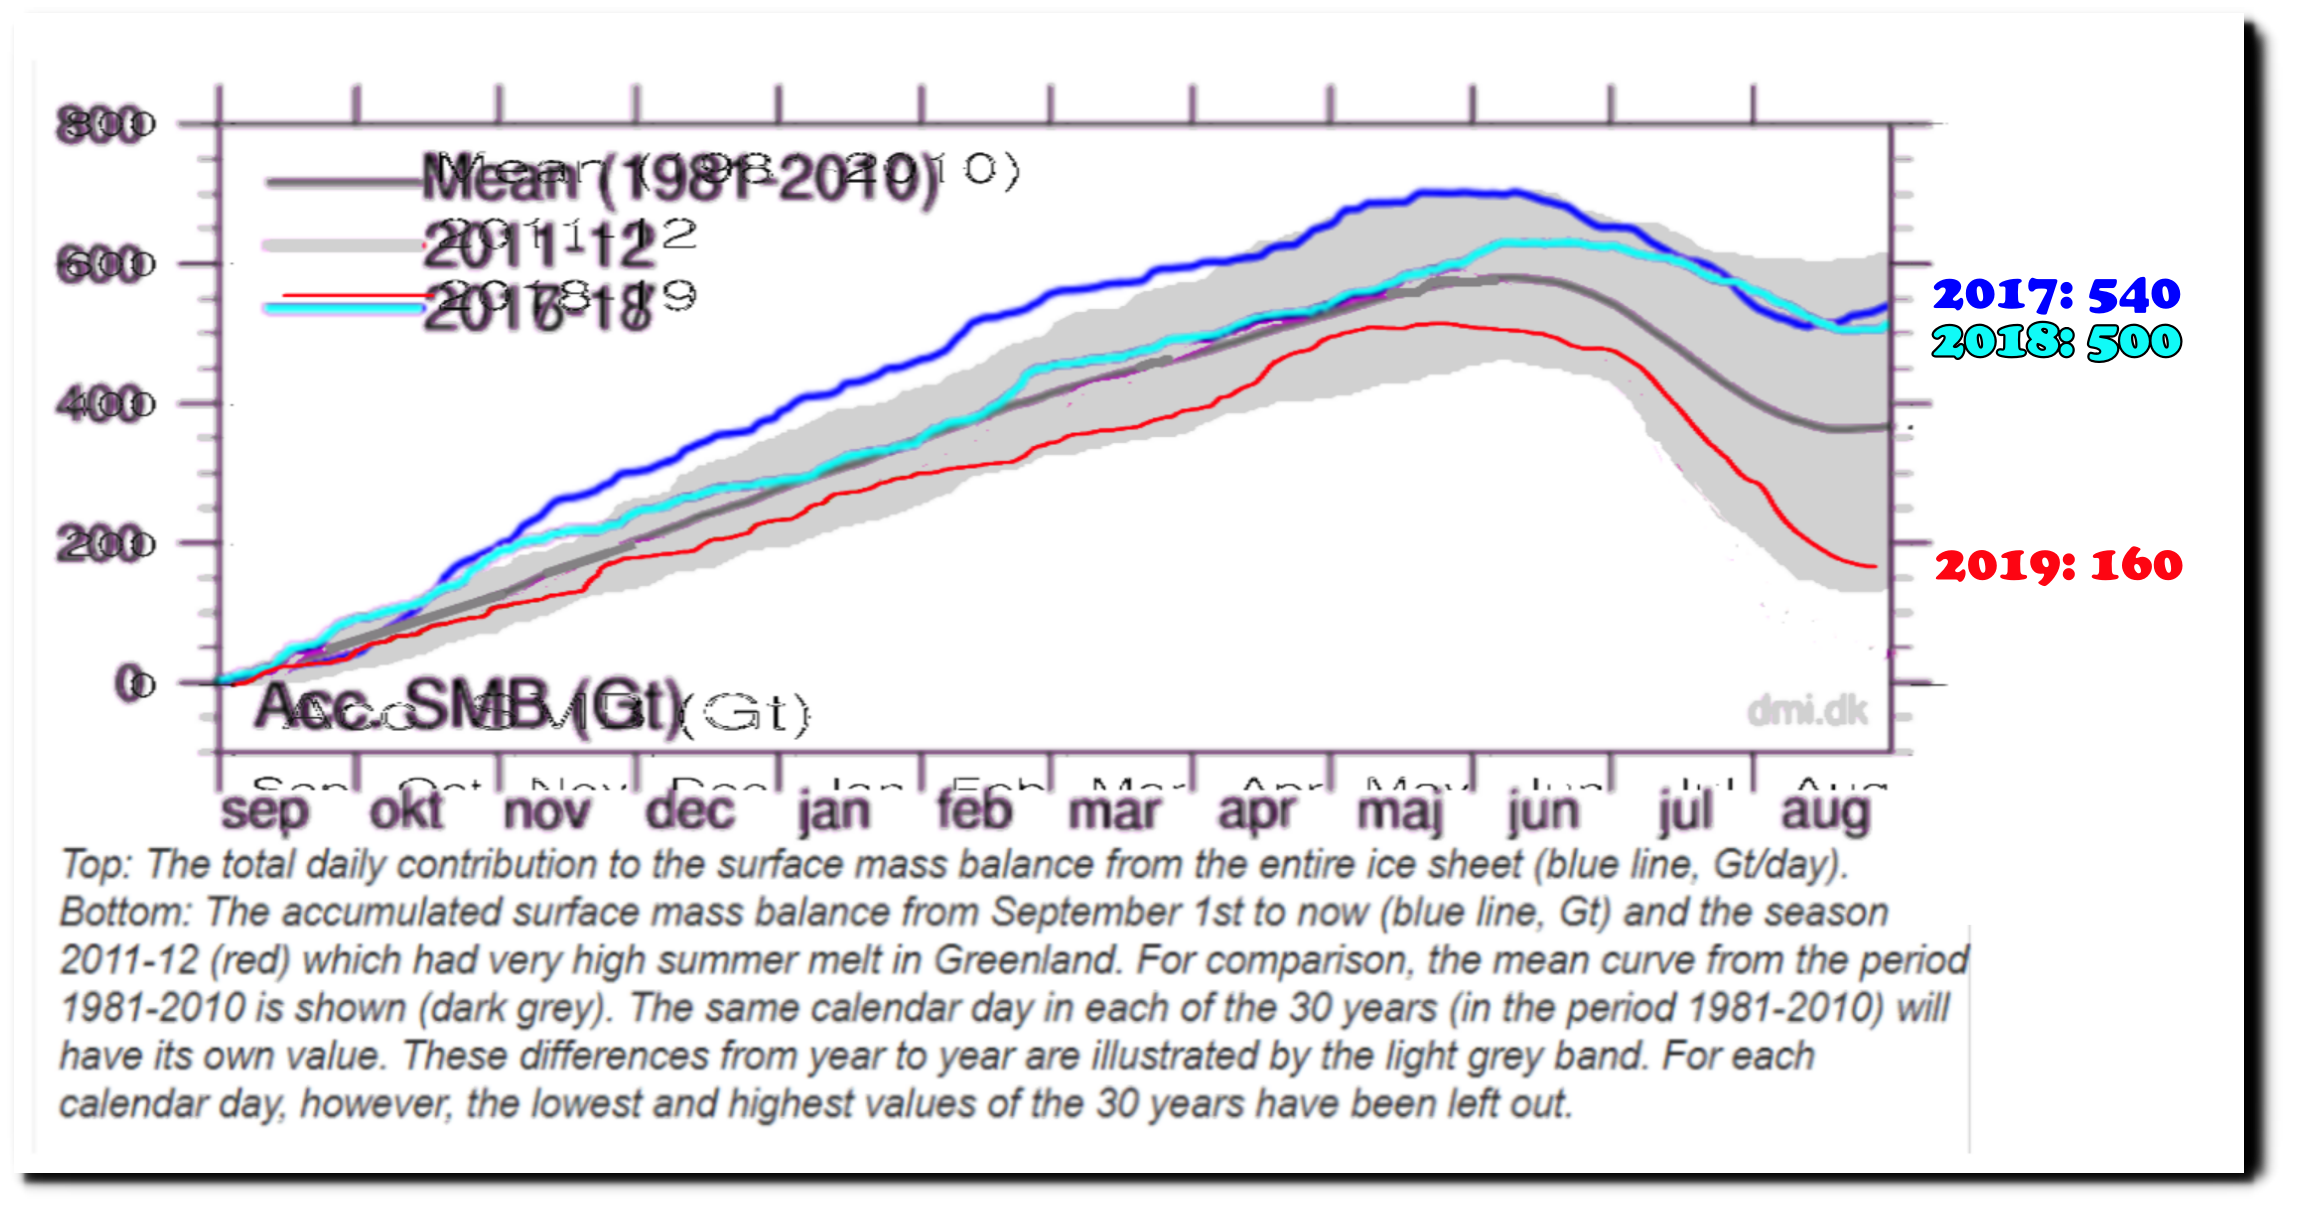
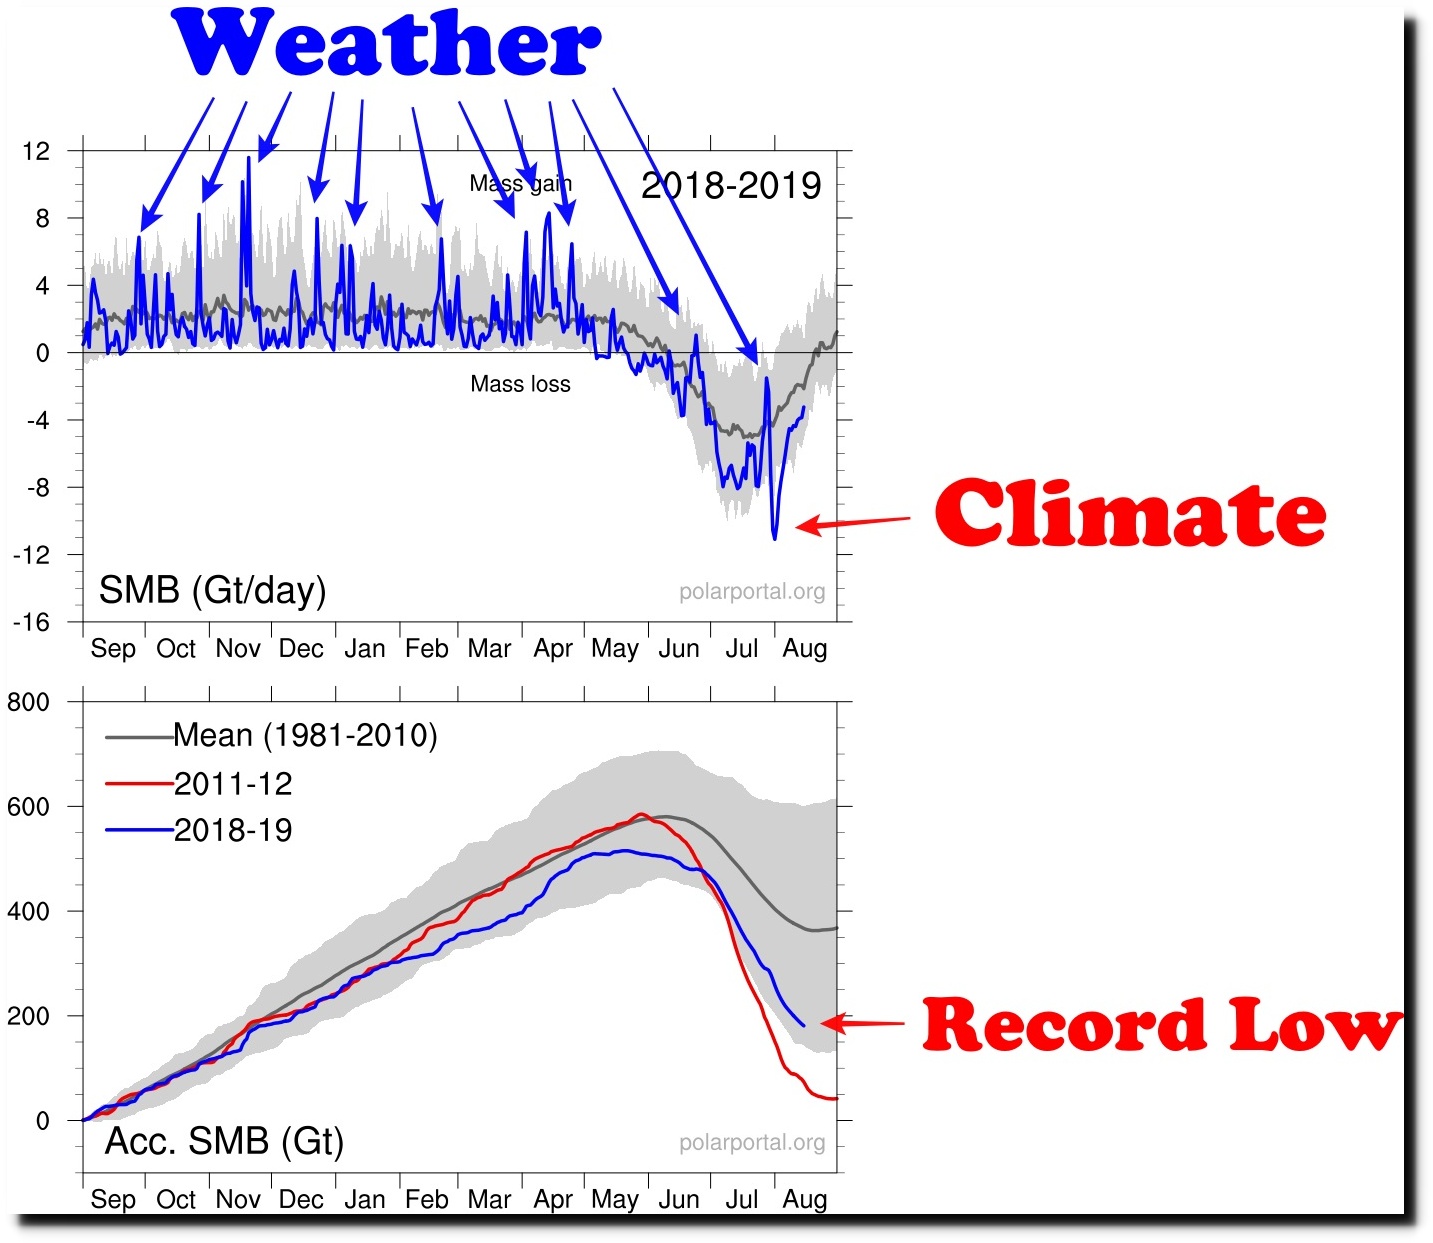
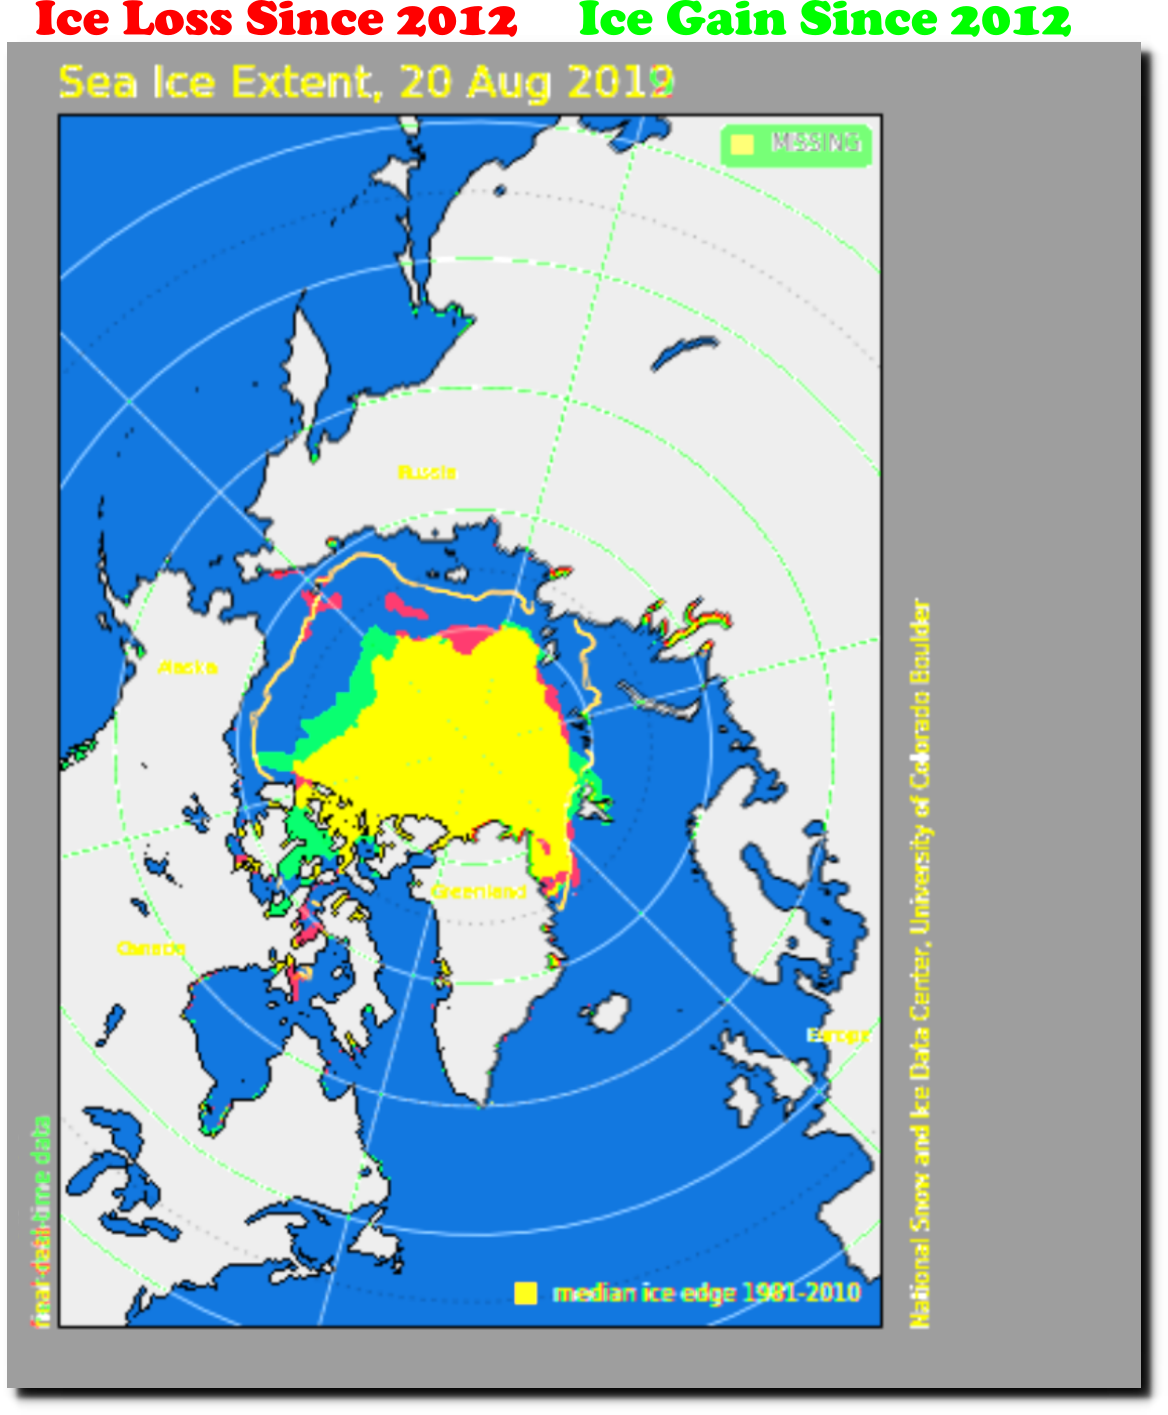
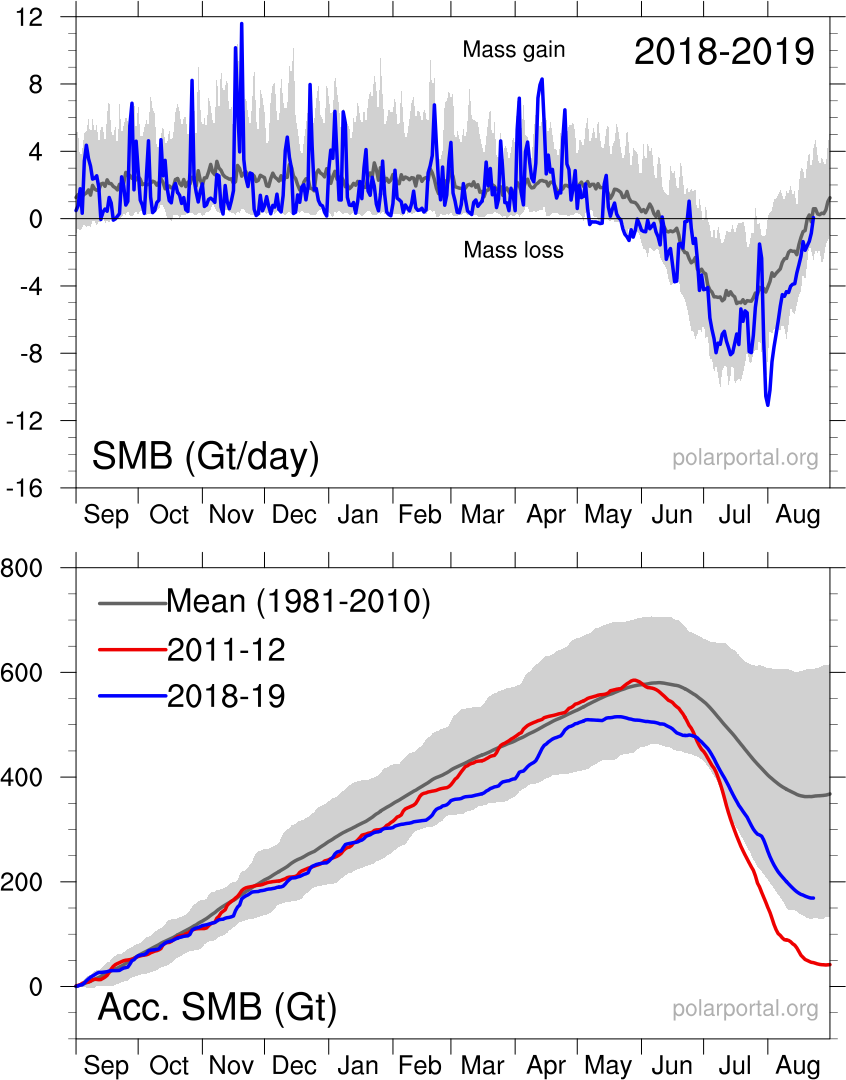
By season’s end, about 440 billion tons of ice — maybe more — will have melted or calved off Greenland’s giant ice sheet, experts estimate.The average for this time of year is less than 18 billion tons.
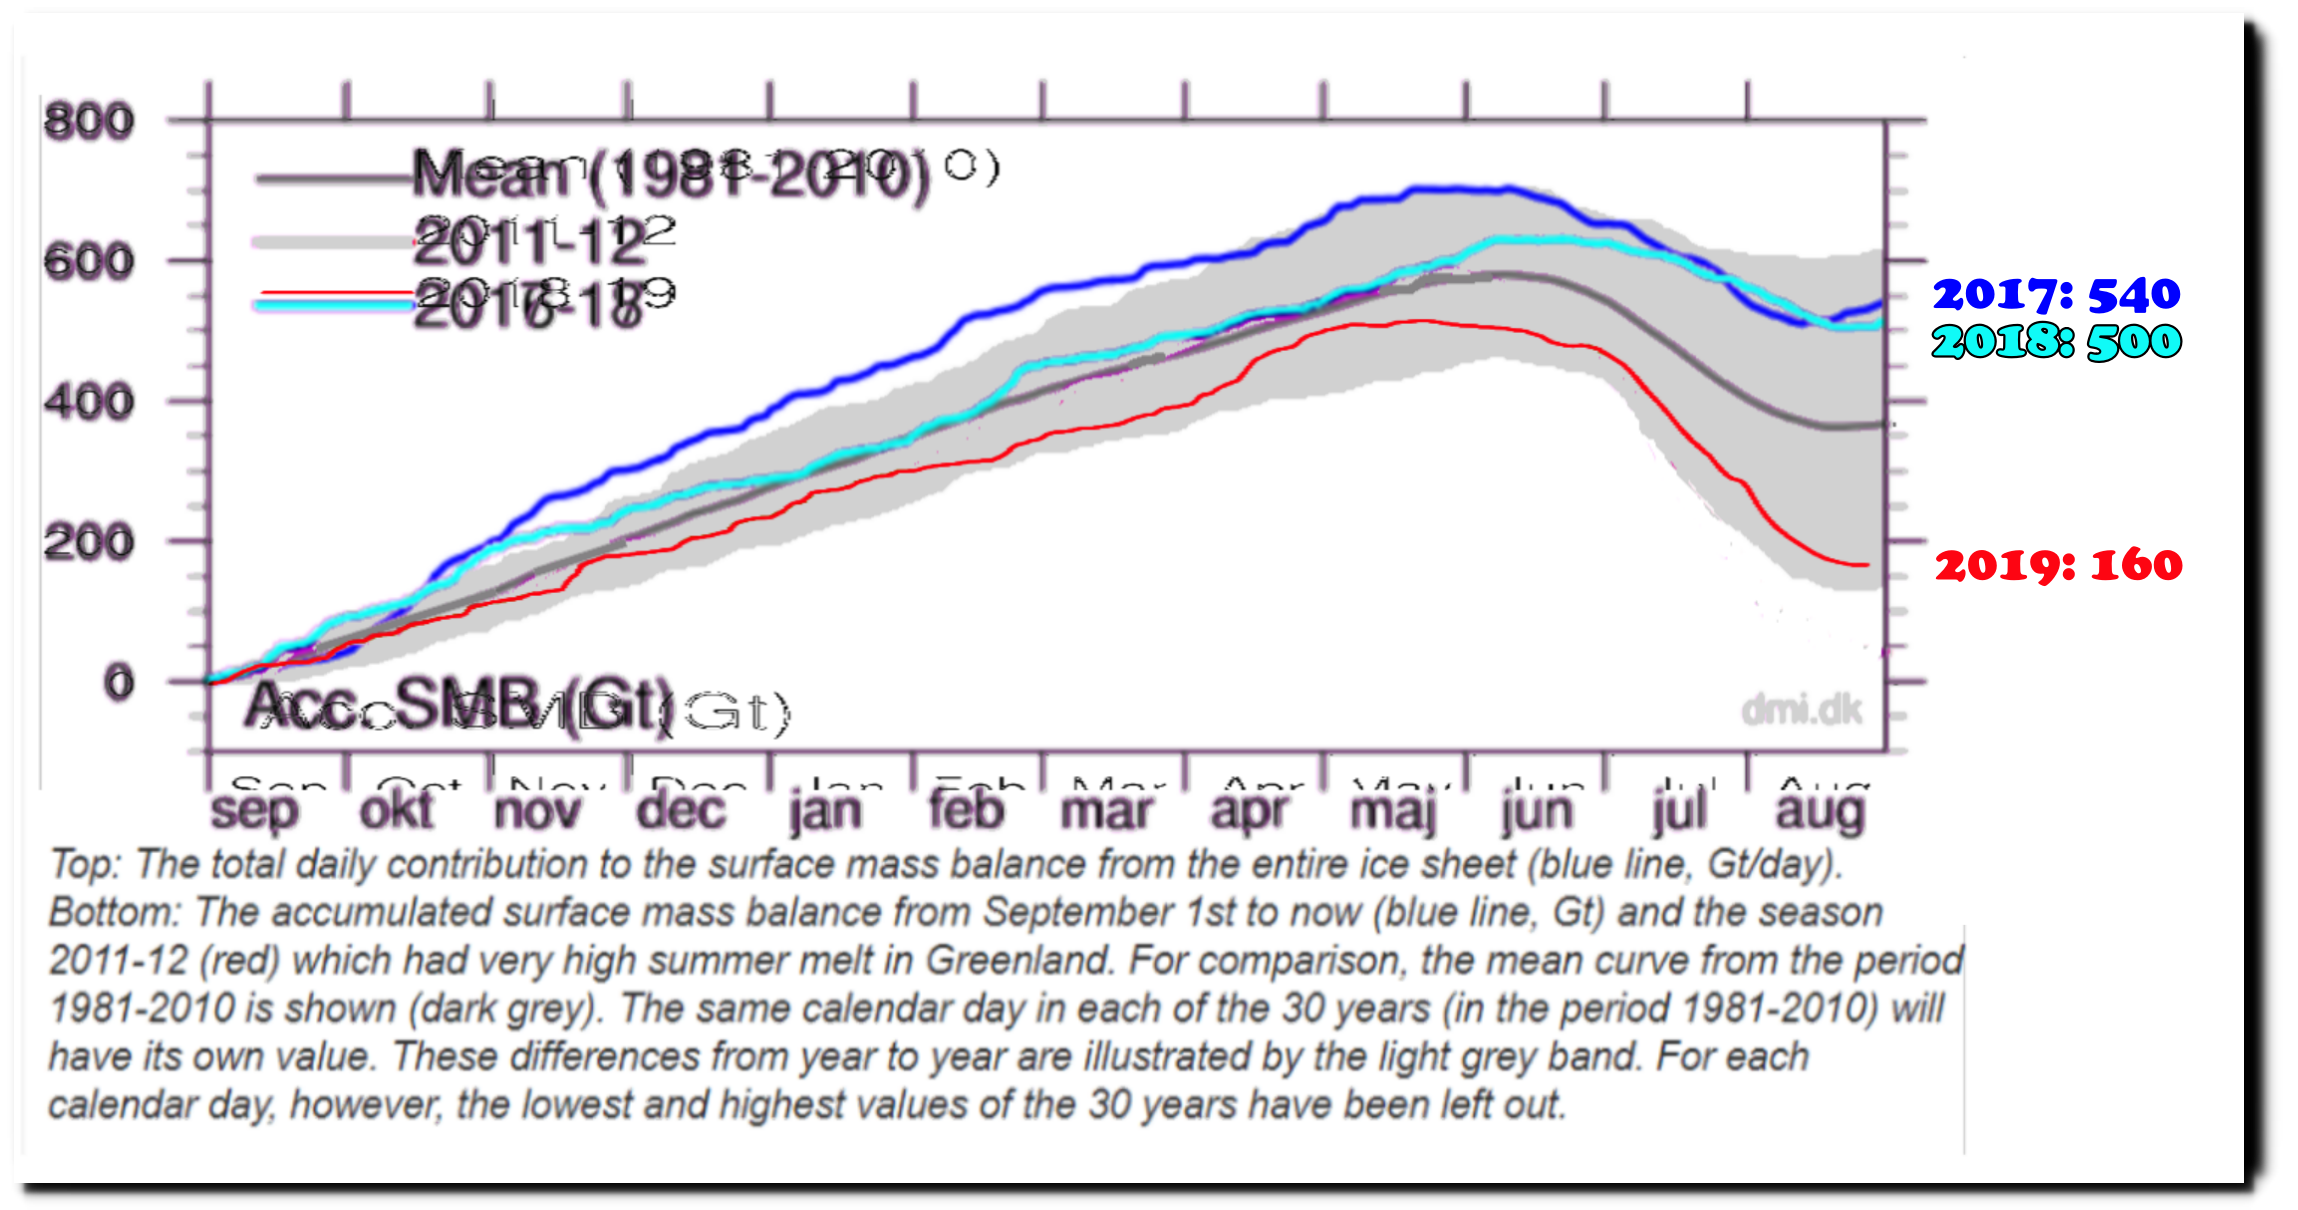
Greenland’s surface has gained 160 billion tons of new ice this year, after gains of 500 and 540 billion tons during the last two years. Average loss since the spring peak is 225 billion tons (plus calving loss) – not 18 billion tons.
In one of the closest towns, Kulusuk, the morning temperature reached 52 degrees Fahrenheit — warm enough for shirtsleeves.
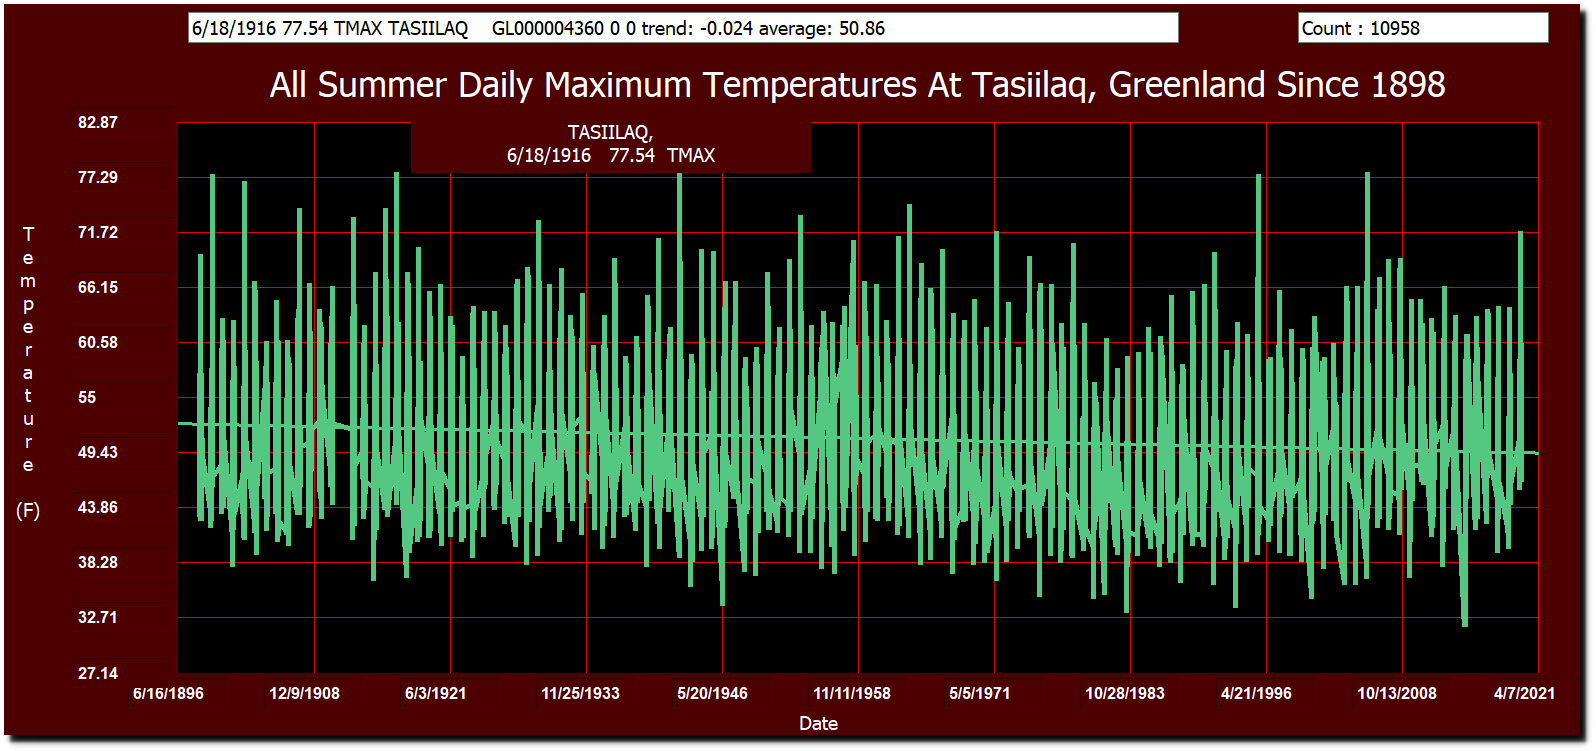
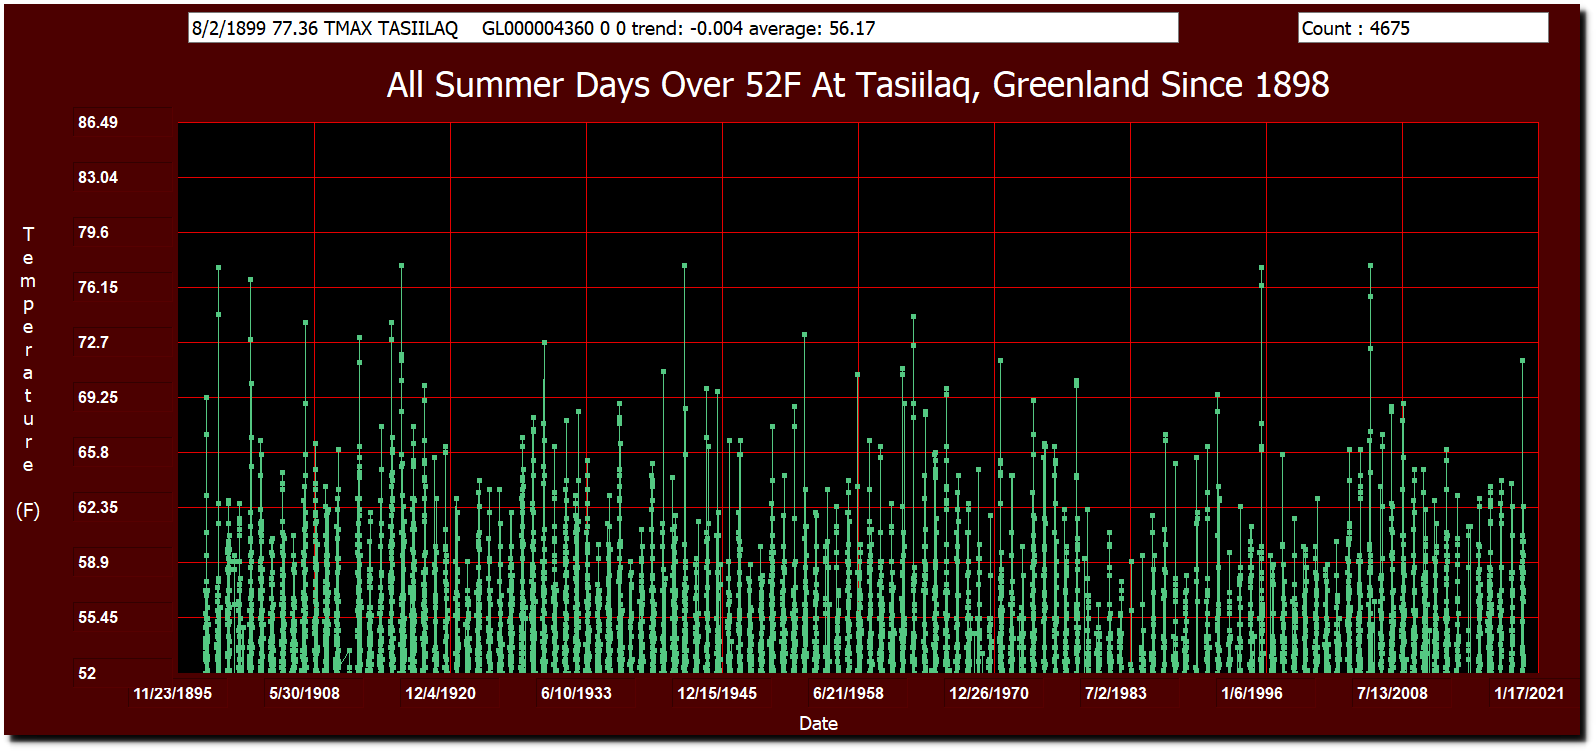
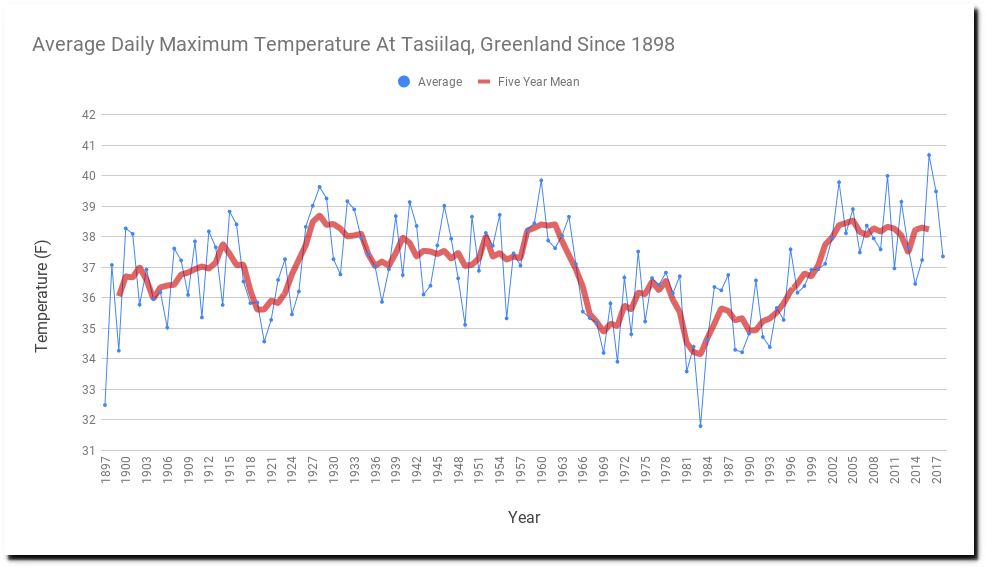
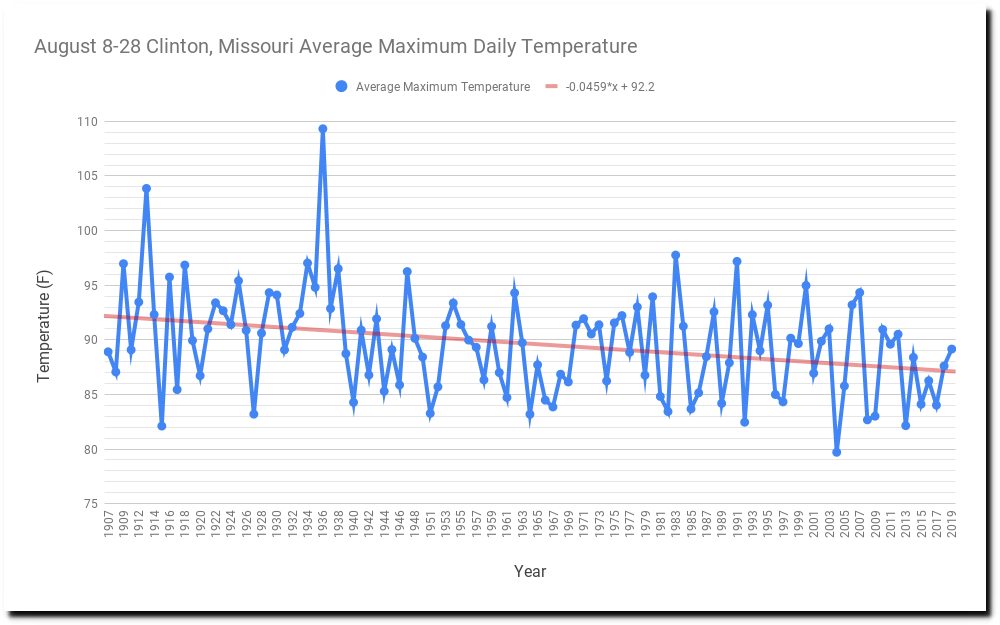
Meaningless out of context propaganda. The average summer maximum temperature there is 51 degrees. They have had 4,675 days over 52F since 1898. Highest temperature recorded there was 78 degrees on first seen on June 18, 1916. Summer daily maximum temperatures have been trending downwards at 2.4 degrees per century since the late 19th century.
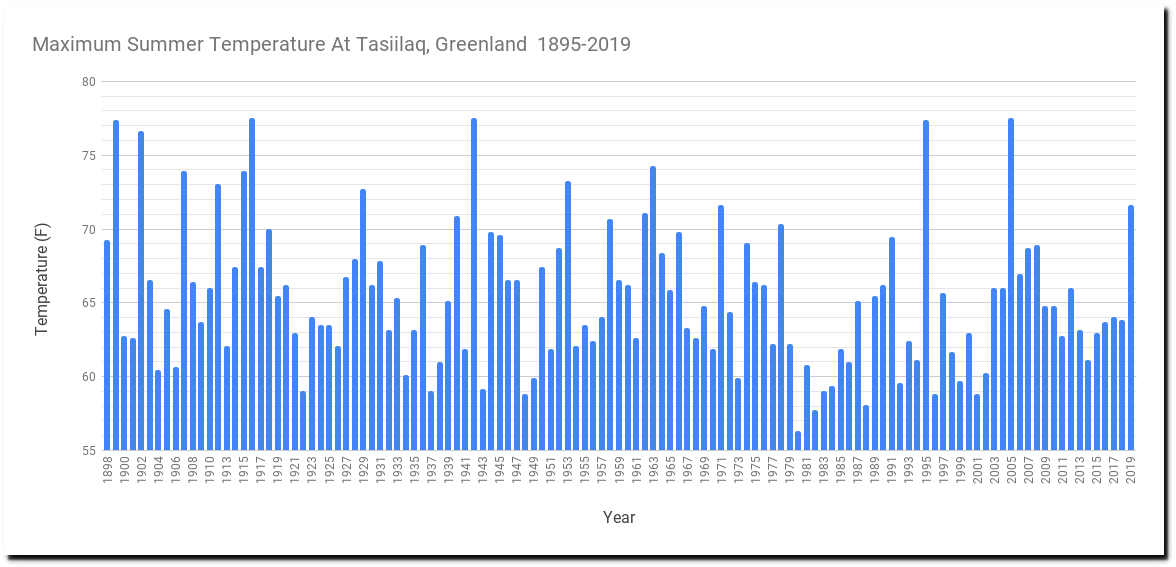
Summer maximum temperatures at Tasiilaq are about the same as they were prior to the cold period from 1960-2000.
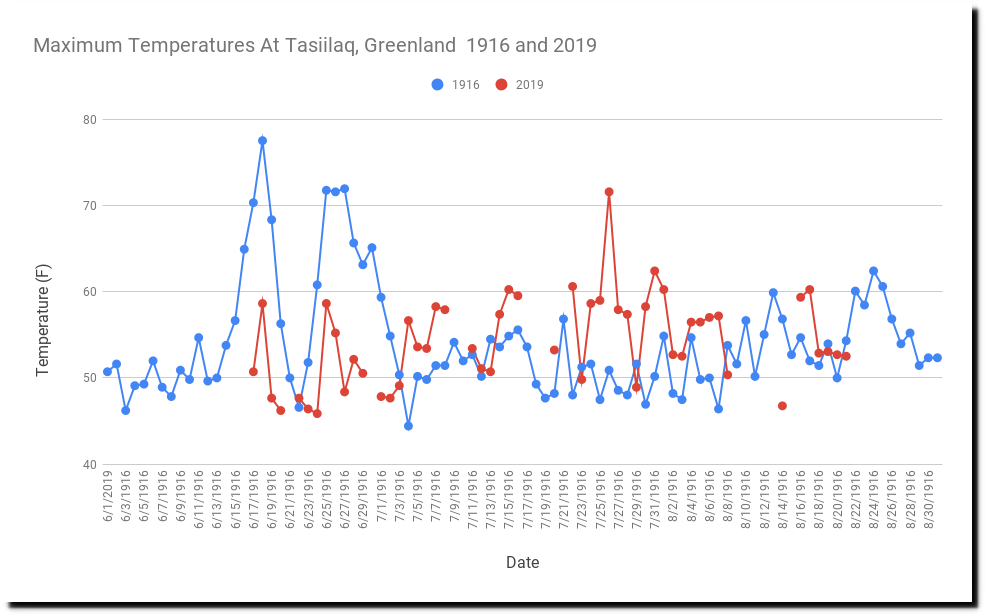
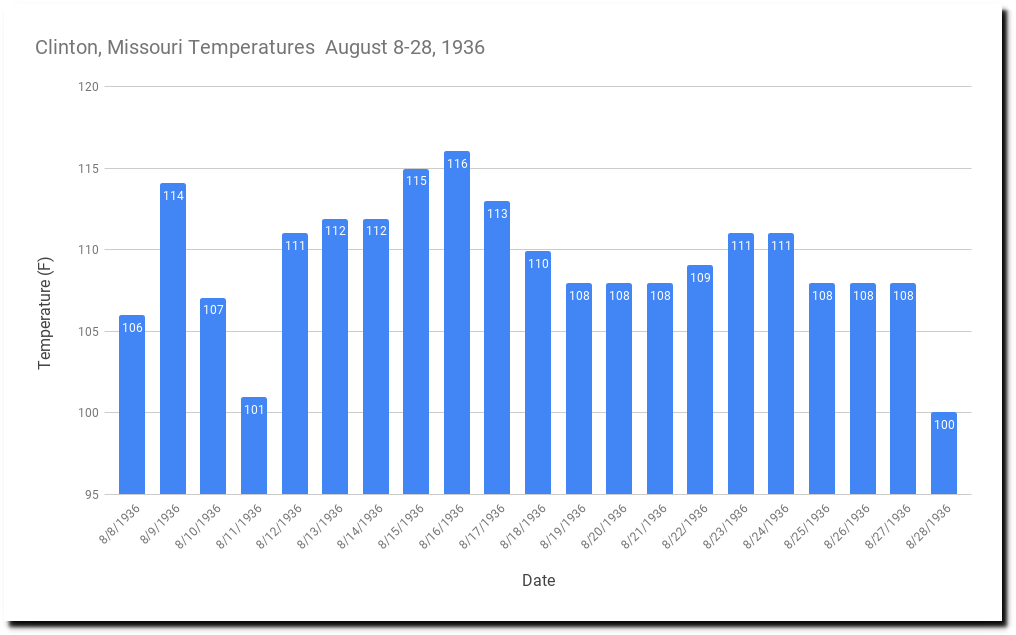
Average temperatures this summer have been about the same as summer 1916, but 1916 had a more warm days. This year only had one.
The Helheim Glacier has lost about three square miles of ice since 2012, while the Petermann Glacier has gained more than ten times that much.
Glaciers here do shrink in the summer and grow in the winter, but nothing like this year.
Incorrect. The Petermann Glacier is more than 100 feet thick at its terminus. There is no way ice that thick can retreat in summer, and has been growing steadily for the past seven years.
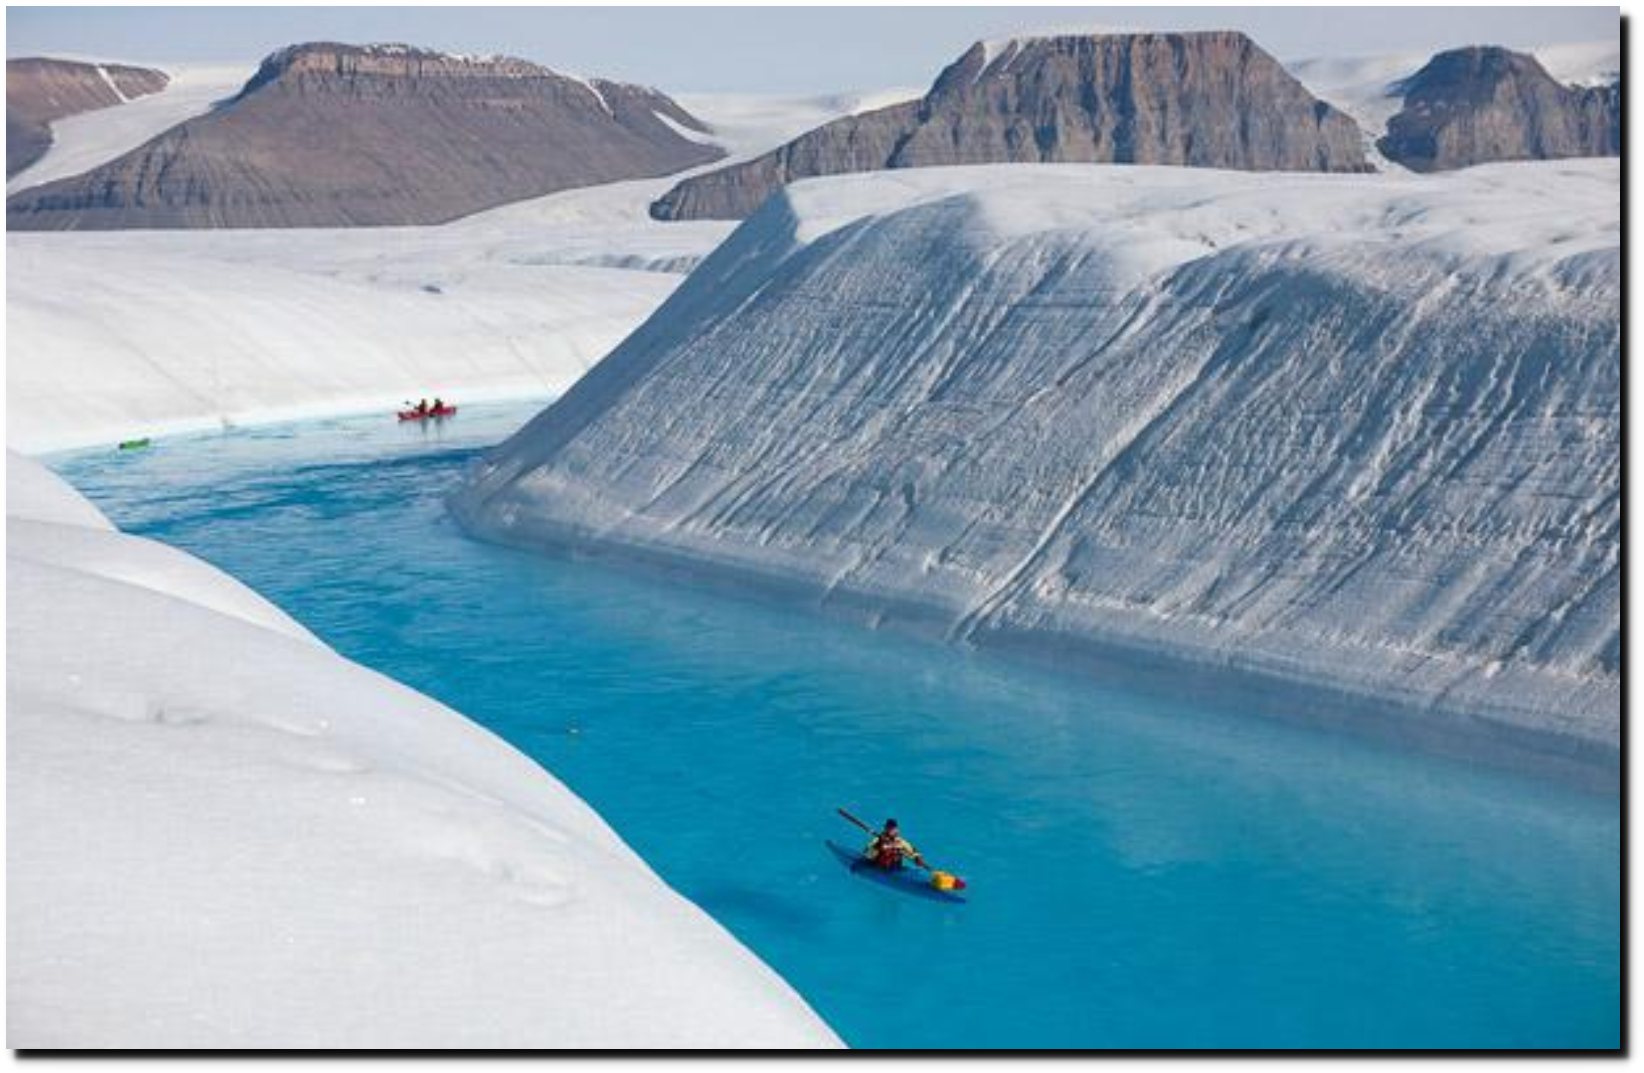
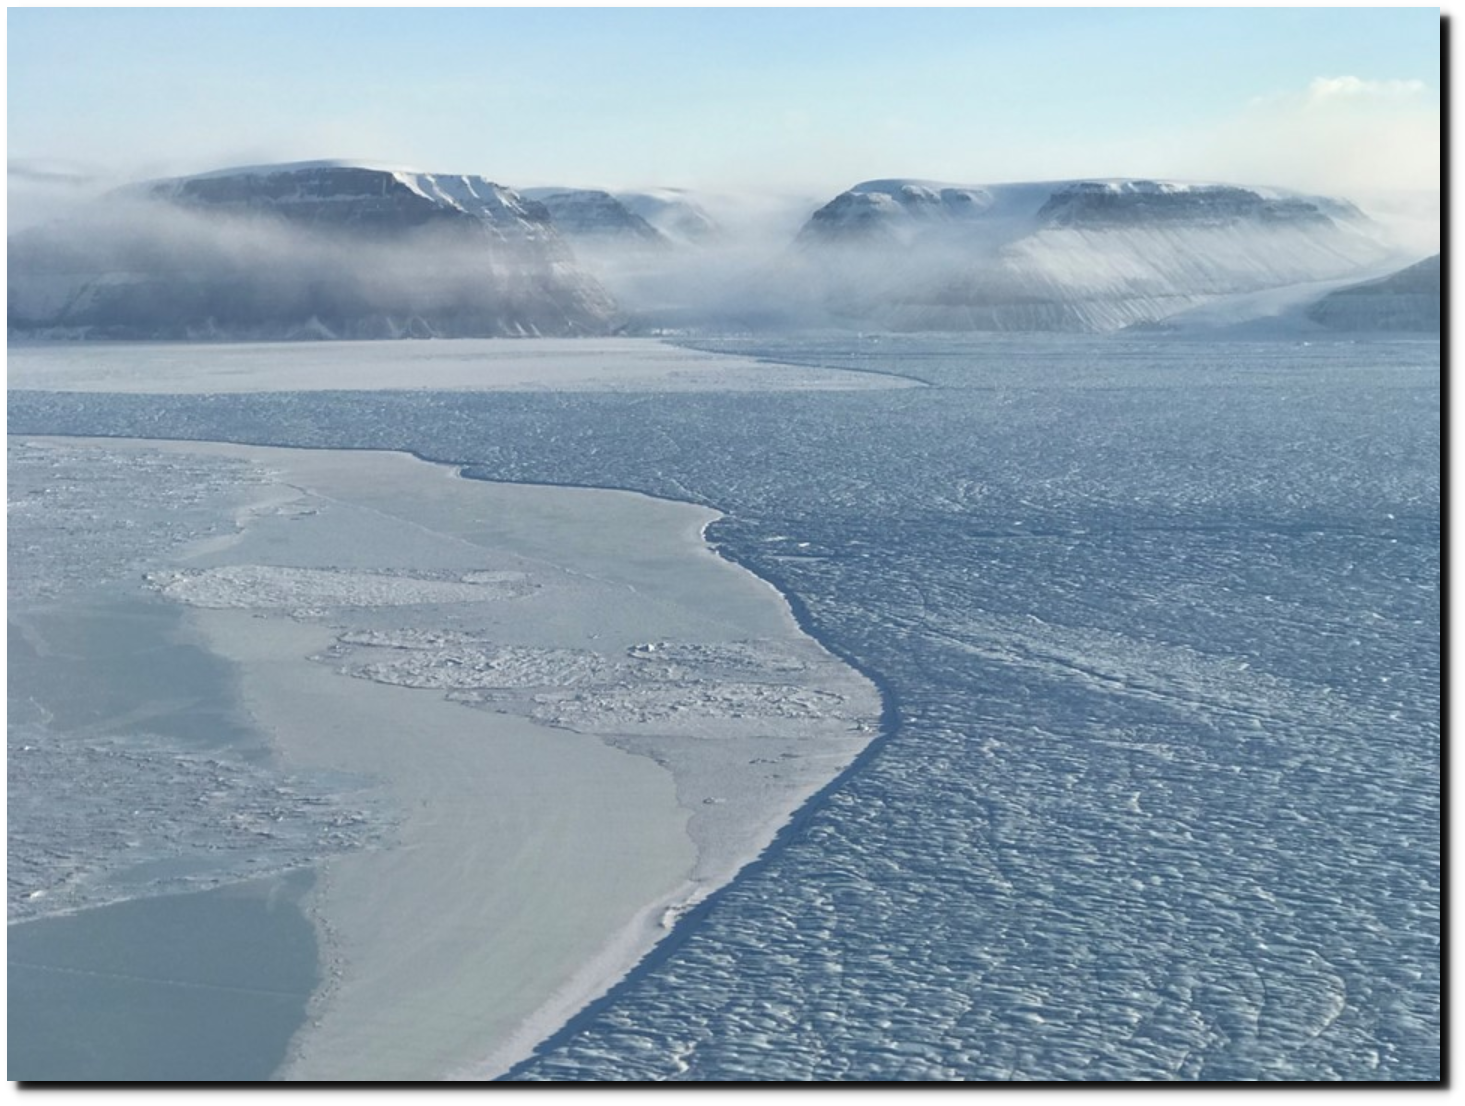
Photos near the terminus of the Petermann glacier
Greenland glaciers are melting at a very slow rate, if at all. Compare to 80 years ago when they were “facing catastrophic collapse.”

17 Dec 1939, Page 15 – Harrisburg Sunday Courier
By 1947, the Arctic had warmed 10 degrees, and scientists were predicting catastrophic sea level rise, unless they got money to start an international agency.
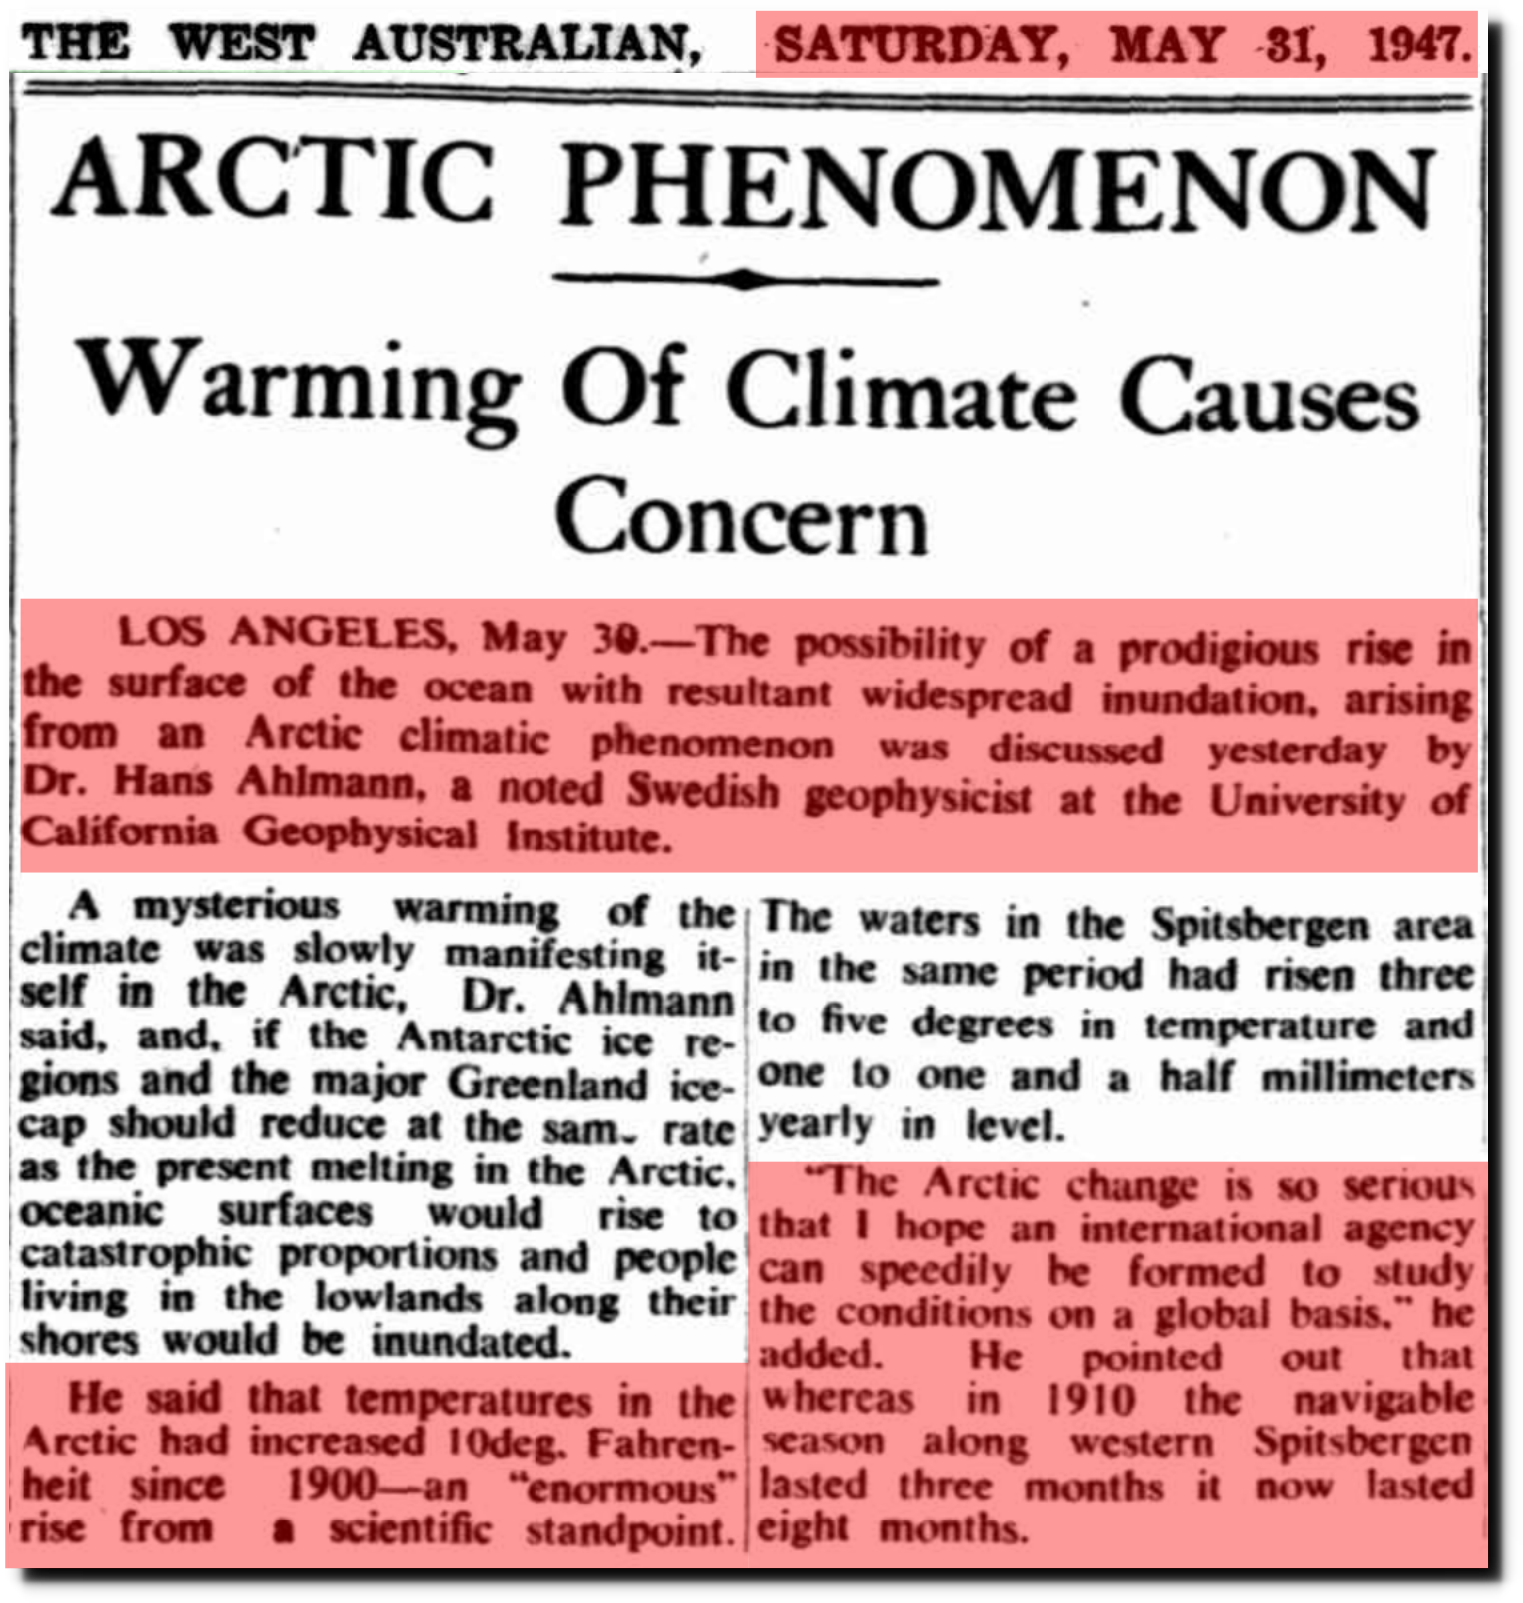
31 May 1947 – ARCTIC PHENOMENON – Trove
Summit Station, a research camp nearly 2 miles high and far north, warmed to above freezing twice this year for a record total of 16.5 hours. Before this year, that station was above zero for only 6.5 hours in 2012, once in 1889 and also in the Middle Ages.
Incorrect. Summit station never got above freezing this summer.
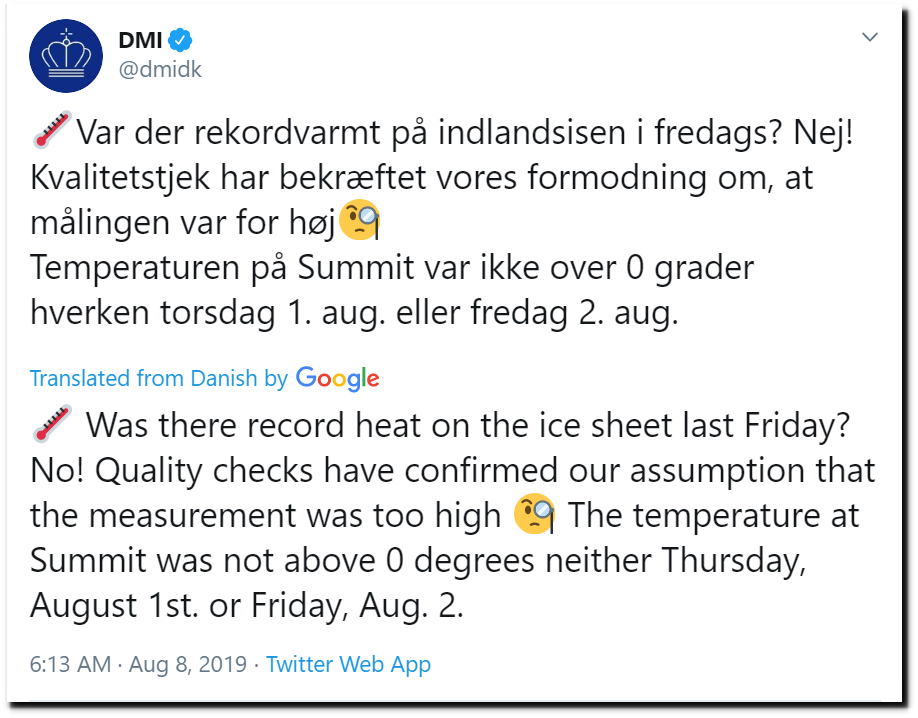
(24) DMI on Twitter: “??Var der rekordvarmt på indlandsisen i fredags? Nej!
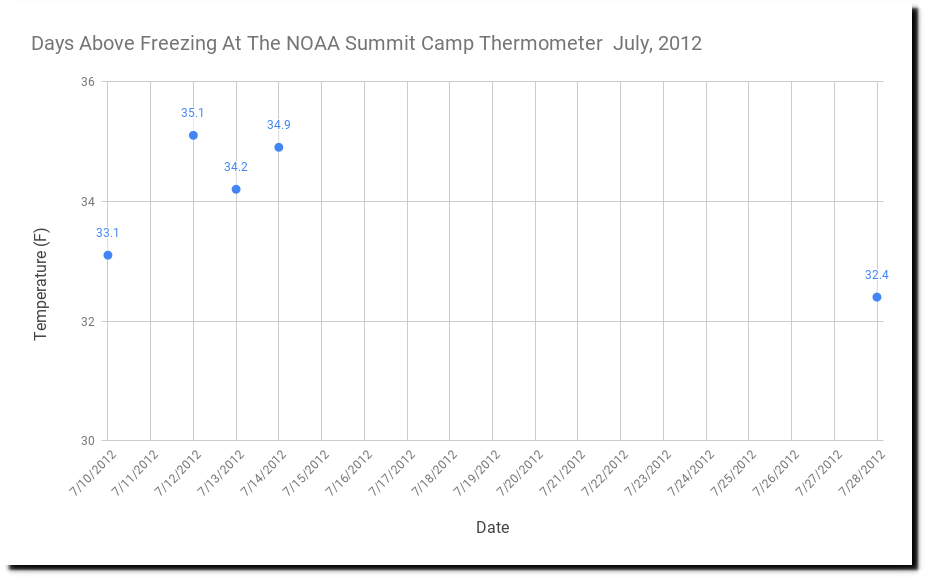
According to NOAA, Summit camp was above freezing on six days in 2012.
The one thing with Seth Borenstein got right in this article is that Greenland was warm during the Middle Ages, when CO2 levels were very low.
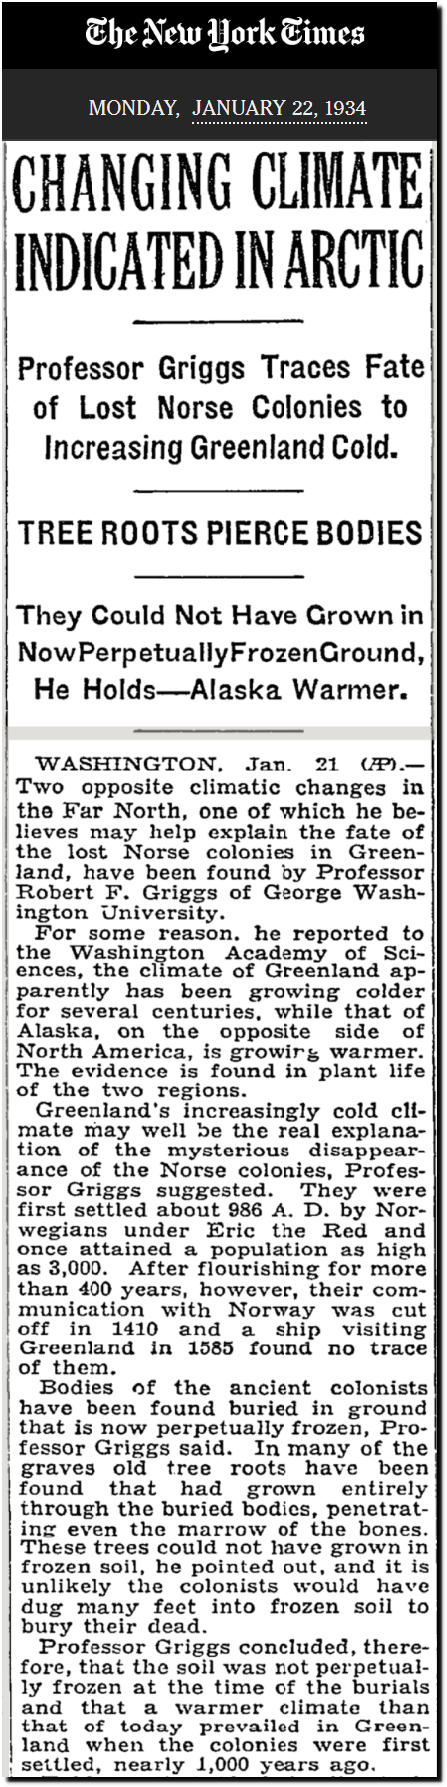
TimesMachine: January 22, 1934 – NYTimes.com
Seth is keeping up the long tradition of Greenland fake news. According to the Guardian, next year is the tipping point and sea level will rise 23 feet.
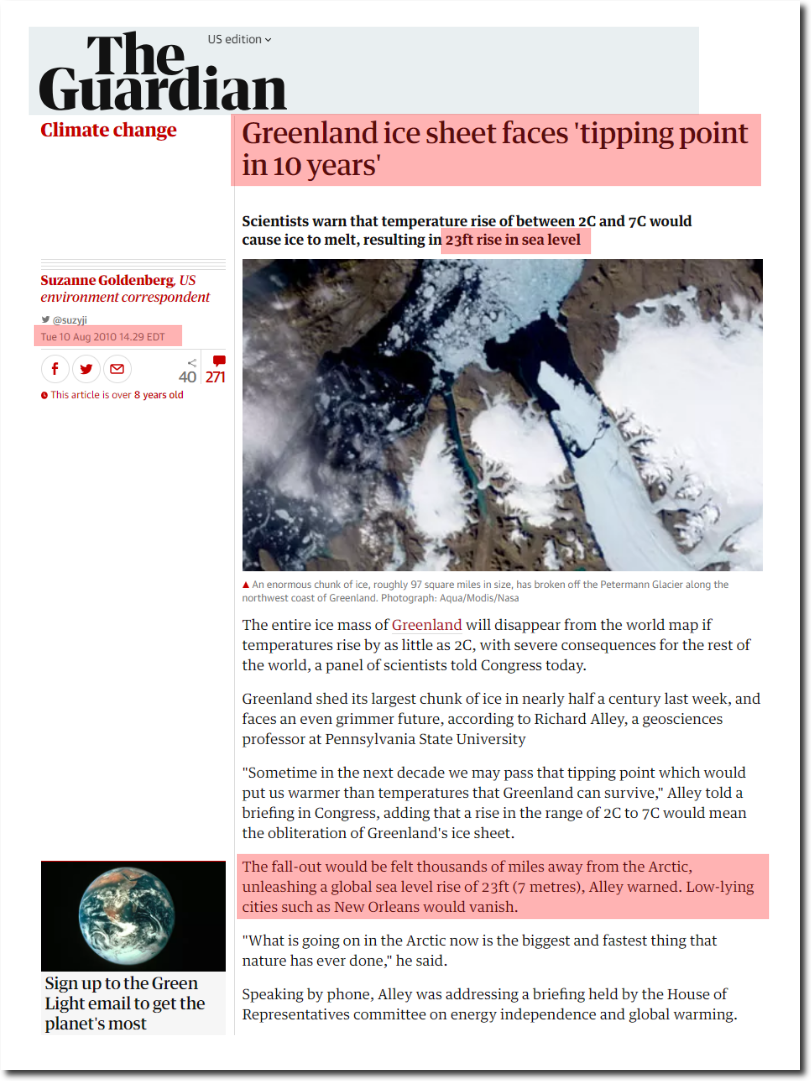
Greenland ice sheet faces ‘tipping point in 10 years’ | Environment | The Guardian
So, the same story as 1952.
Dr. William S. Carlson, an Arctic expert, said to-night that the Polar icecaps were melting at anastonishingg and unexplained rate and were threatening to swamp seaports by raising the ocean levels.
February 16, 1952
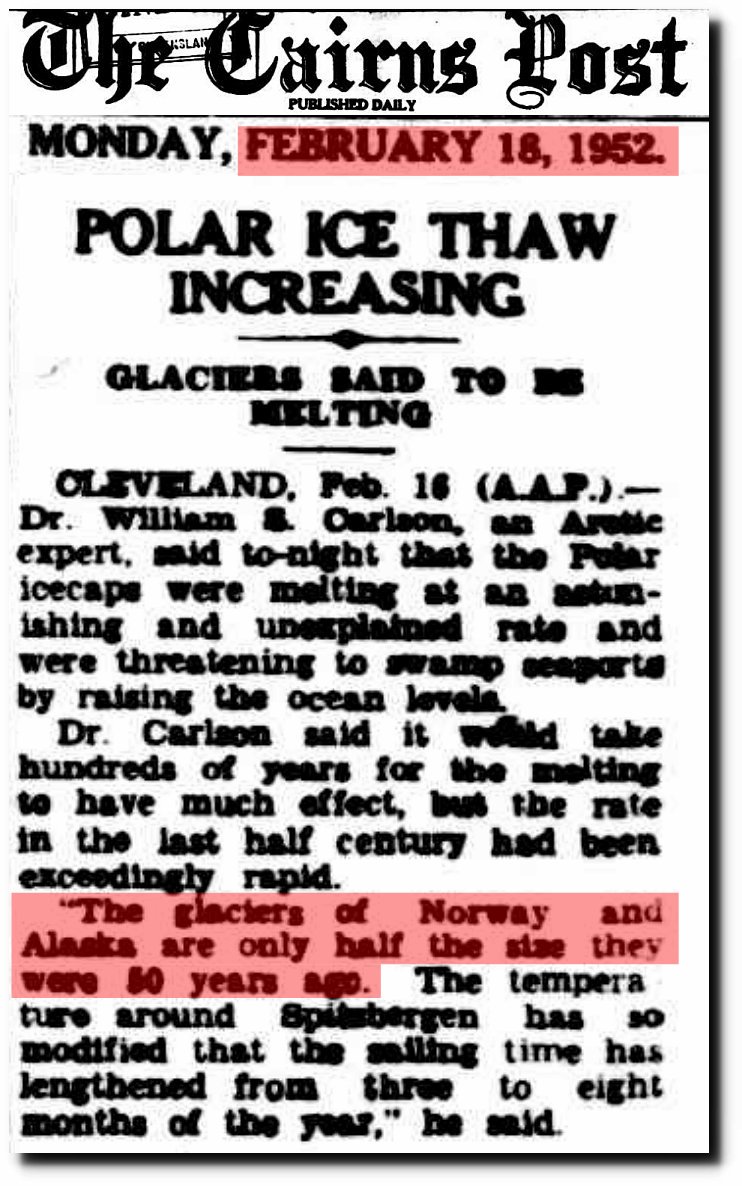
18 Feb 1952 – POLAR ICE THAW INCREASING
What I find disturbing is not that Seth Borenstein is spreading misinformation – that is what journalists do for a living. What troubles me is that a small handful of scientists like Josh Willis, Tom Mote and Jason Box allow themselves to be used in misleading propaganda articles like this, over and over again.


