


Disrupting the Borg is expensive and time consuming!

Google Search
-
Recent Posts
- One Atomic Bomb Per Hour
- New Video : Analyzing Oil And Gas
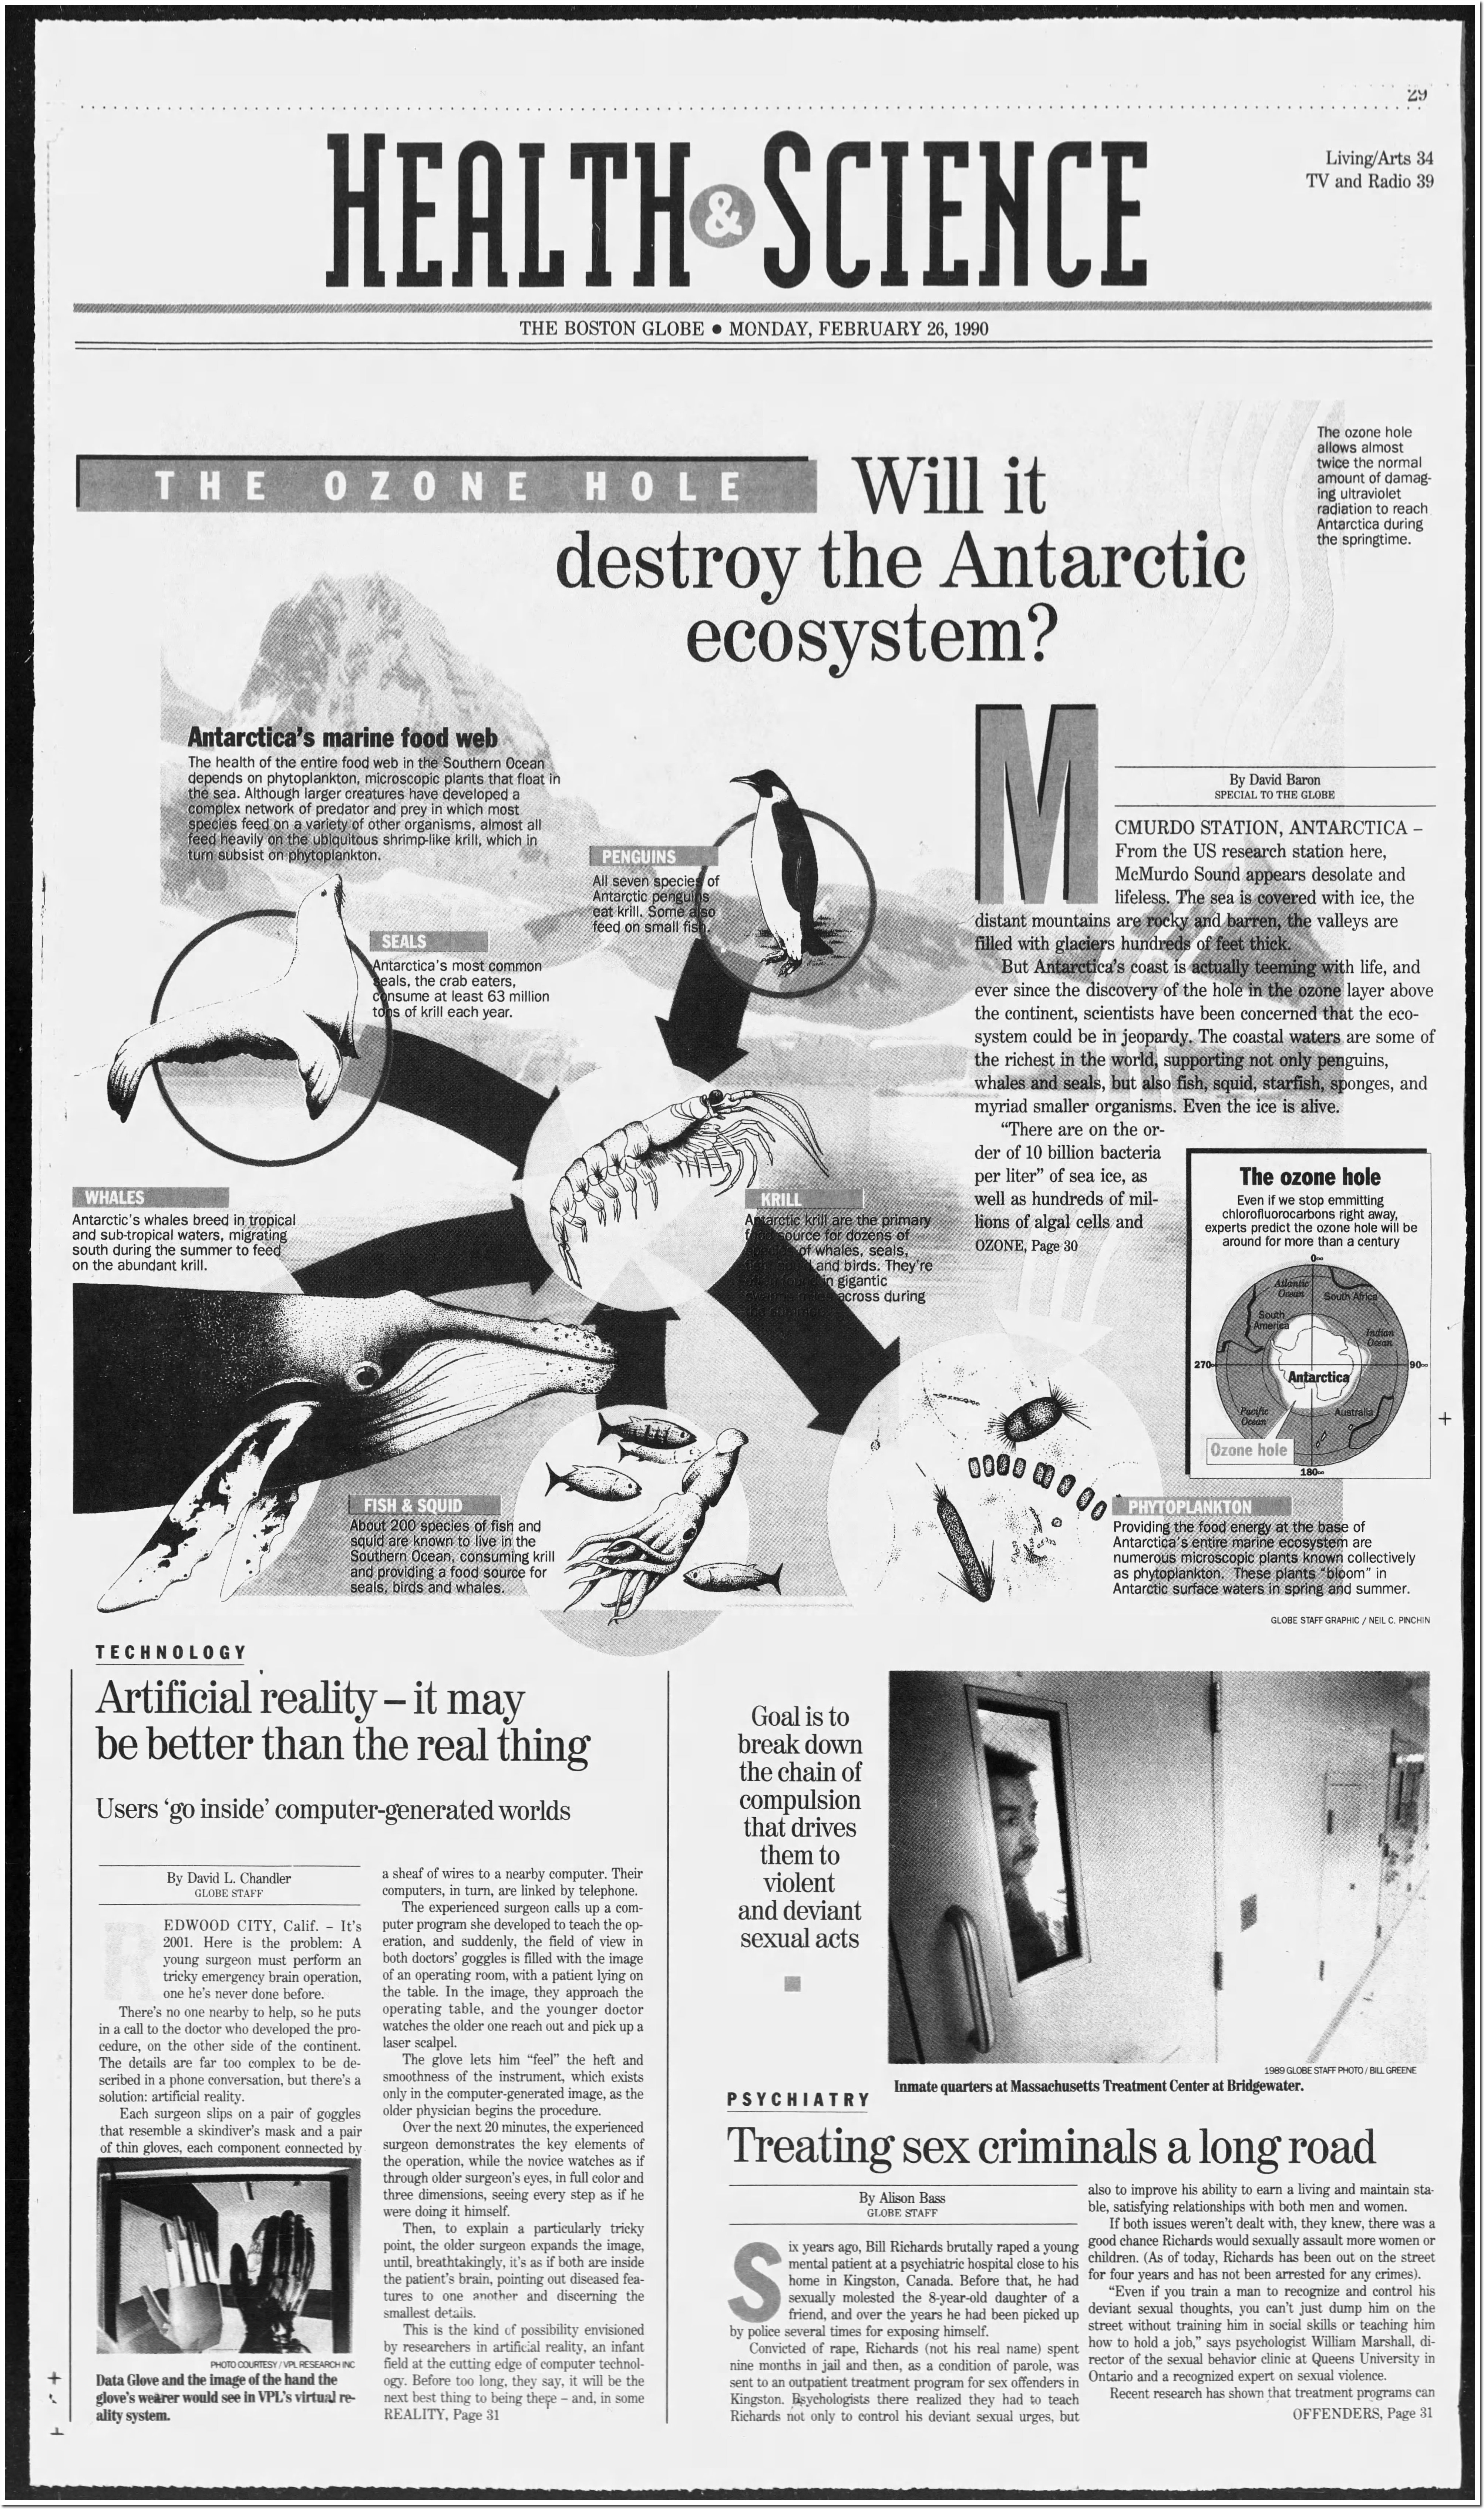
- Is Antarctica Melting?
- High Speed Analysis And Visualization
- El Nino To The Rescue?
- Fake News Update
- Growth Of Antarctic Sea Ice
- 65 Years Of Progress!
- El Nino To The Rescue?
- Worst March Drought On Record
- ChartGL Process Control Demo
- The Biggest Money Laundering Scam
- Drought In The Headwaters Of Lake Powell
- Unrealistic Expectations Of Water Availability
- Did Bill Gates Do This?
- Worst March Drought On Record In The US
- The Real Hockey Stick Graph
- Analyzing The Western Water Crisis
- Gaslighting 1924
- “Why Do You Resist?”
- Climate Attribution Model
- Fact Checking NASA
- Fact Checking Grok
- Fact Checking The New York Times
- New Visitech Features
Recent Comments
- Gordon Vigurs on One Atomic Bomb Per Hour
- Gordon Vigurs on One Atomic Bomb Per Hour
- Gordon Vigurs on One Atomic Bomb Per Hour
- Bob G on One Atomic Bomb Per Hour
- Robertvd on One Atomic Bomb Per Hour
- czechlist on One Atomic Bomb Per Hour
- conrad ziefle on One Atomic Bomb Per Hour
- conrad ziefle on One Atomic Bomb Per Hour
- D. Boss on One Atomic Bomb Per Hour
- D. Boss on One Atomic Bomb Per Hour
Climate Emergency In Colorado
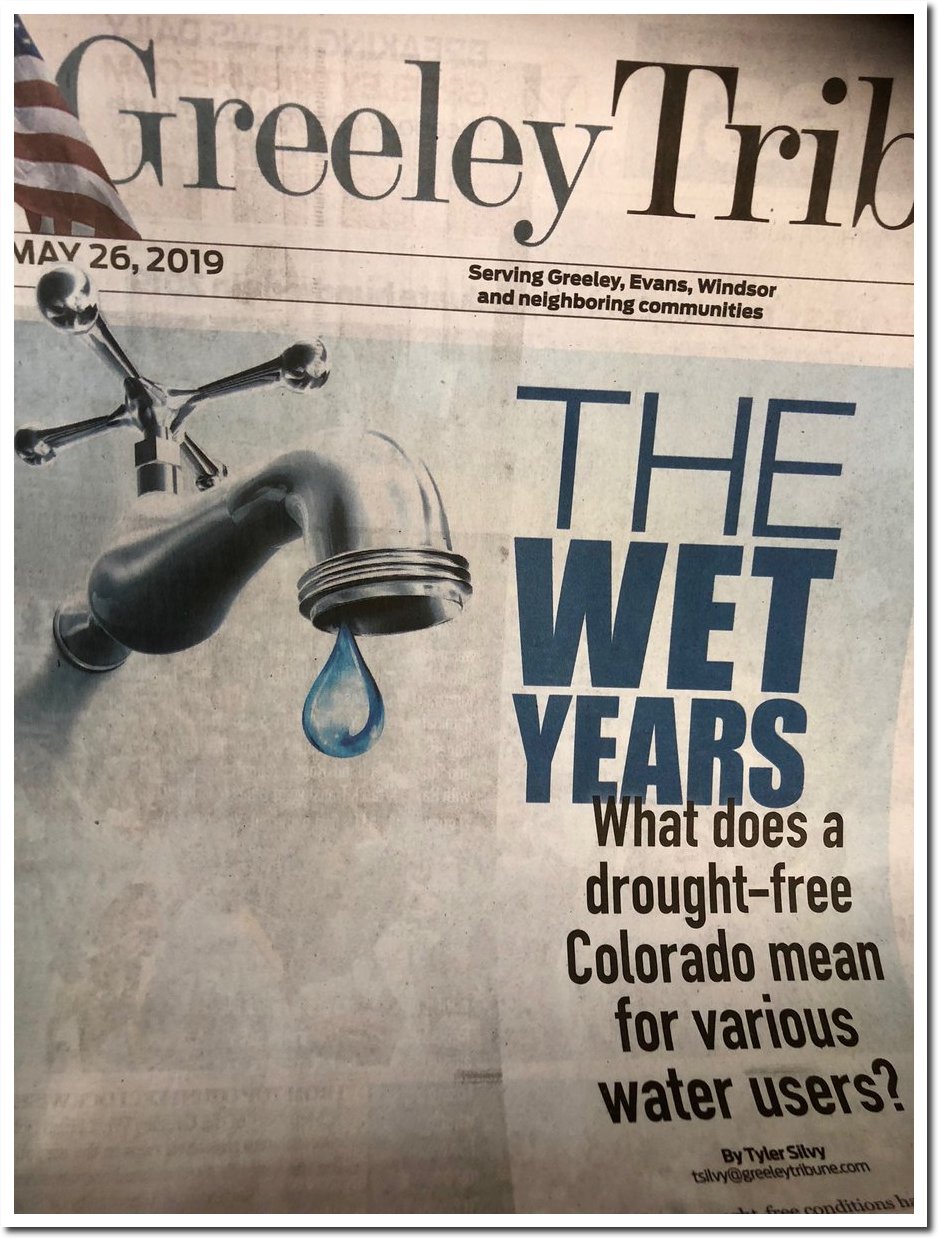
This was the wettest winter on record in the US.
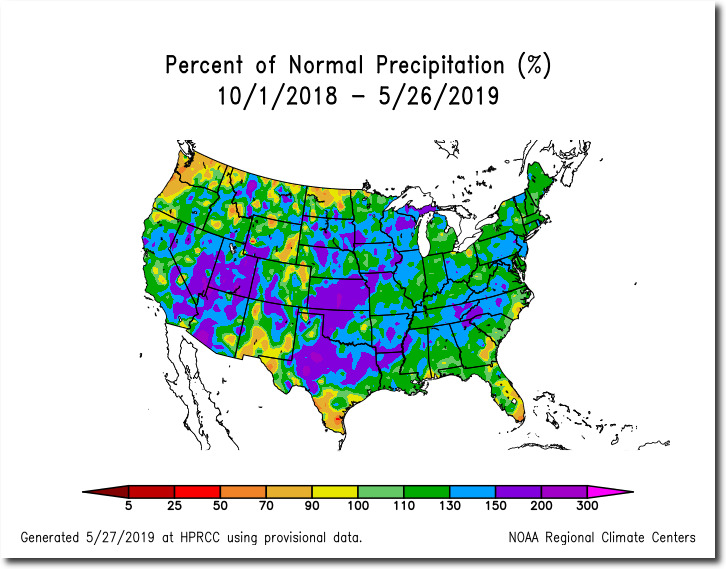
https://hprcc.unl.edu/products/maps/acis/WaterPNormUS.png
Climate experts of course predicted the exact opposite – because their beliefs are based on superstition, not science.
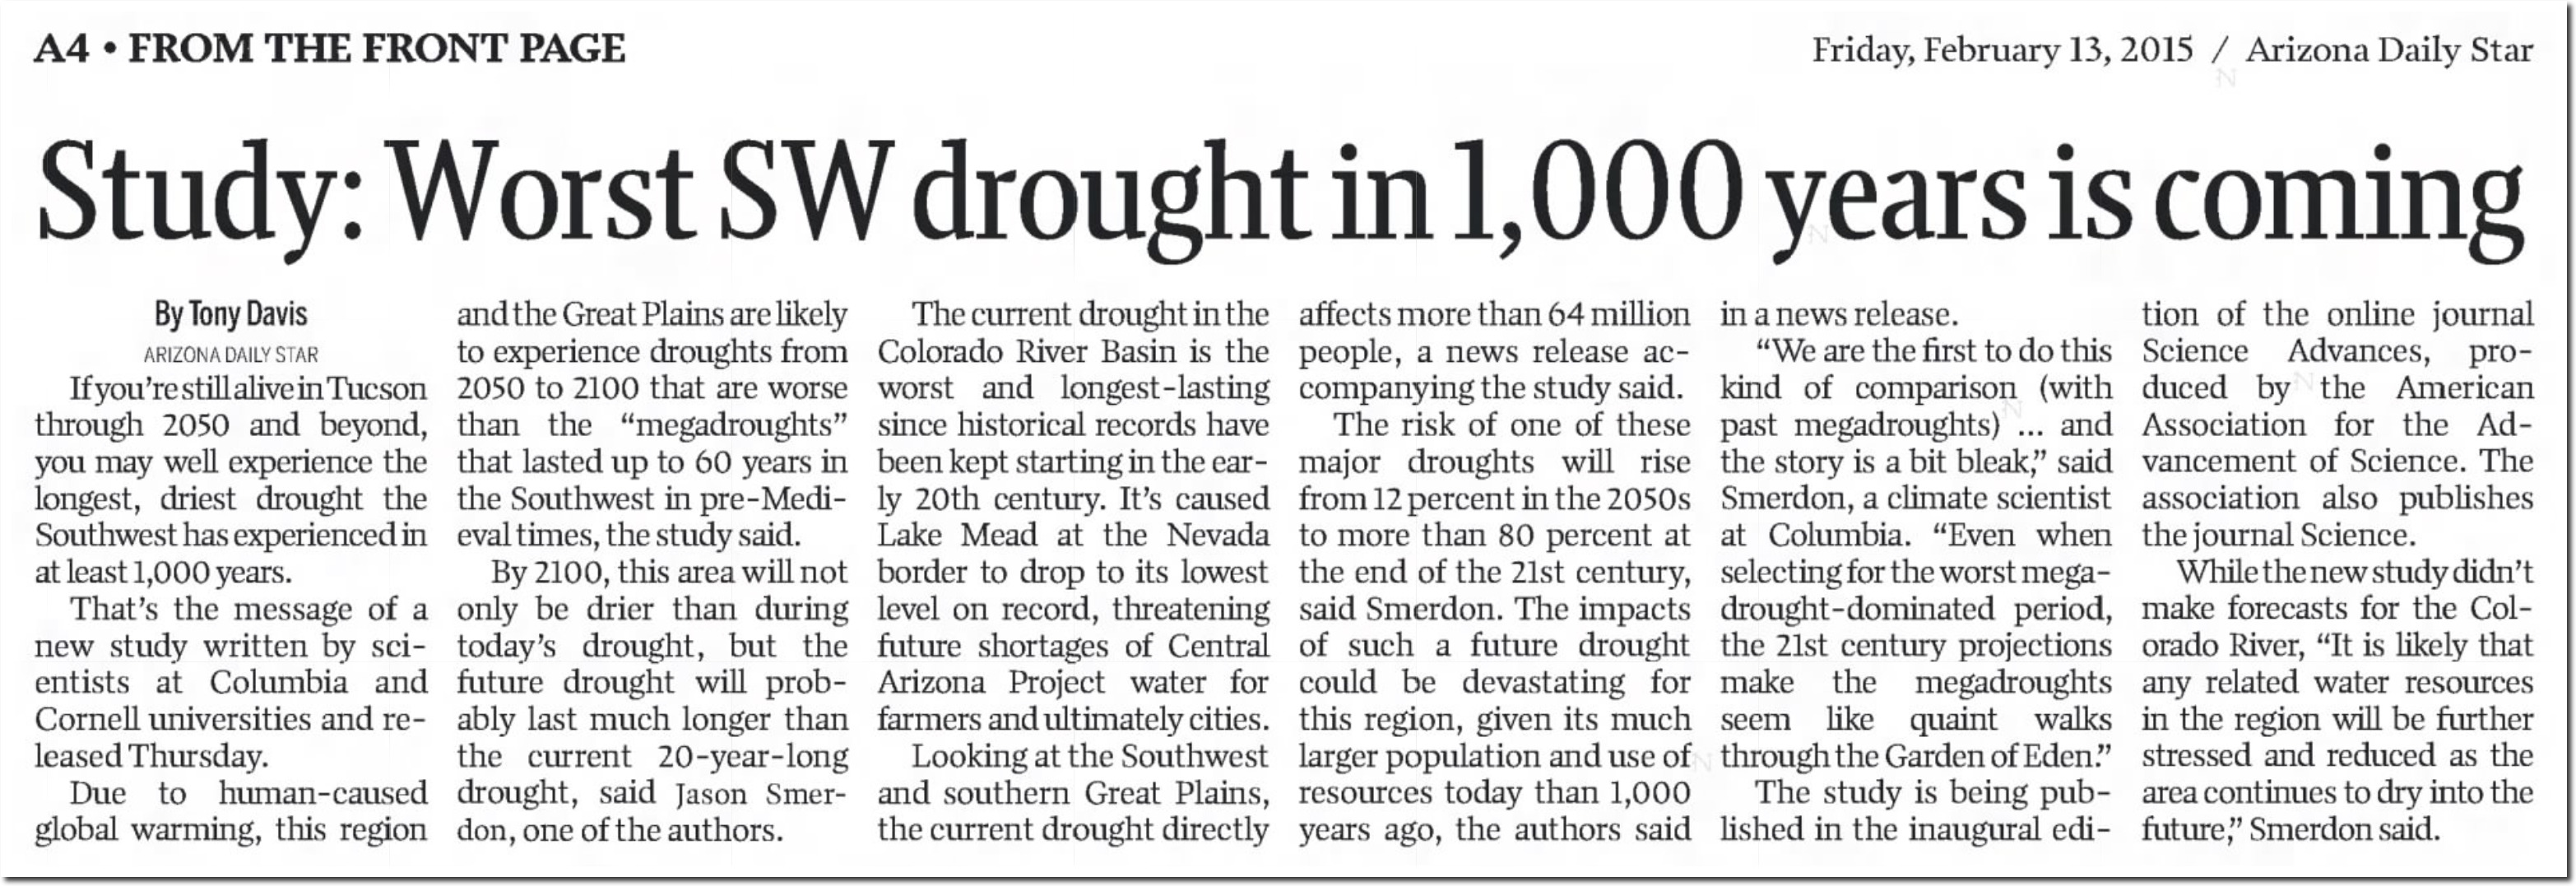
13 Feb 2015, Page A004 – Arizona Daily Star at Newspapers.com
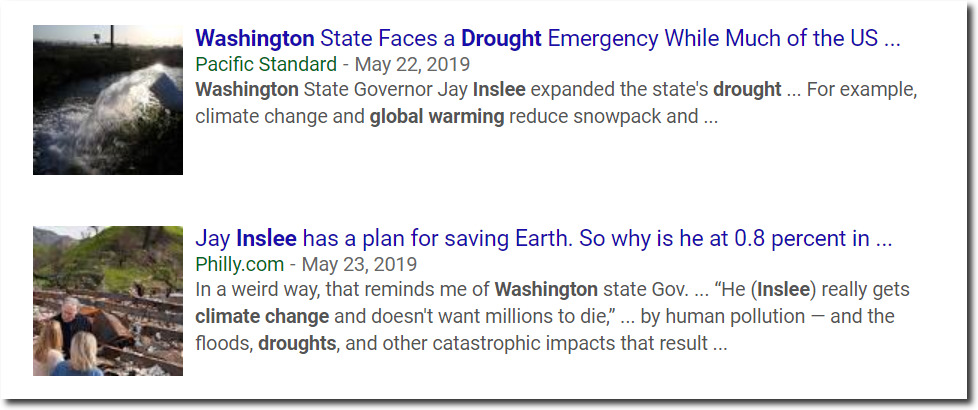
Meanwhile, Washington Governor Jay Inslee has determined that the small brown area in parts of his state is due to global warming.
Posted in Uncategorized
Leave a comment
Sea Level Crisis Update
If sea level keeps falling, we will have to walk further to get to the beach.
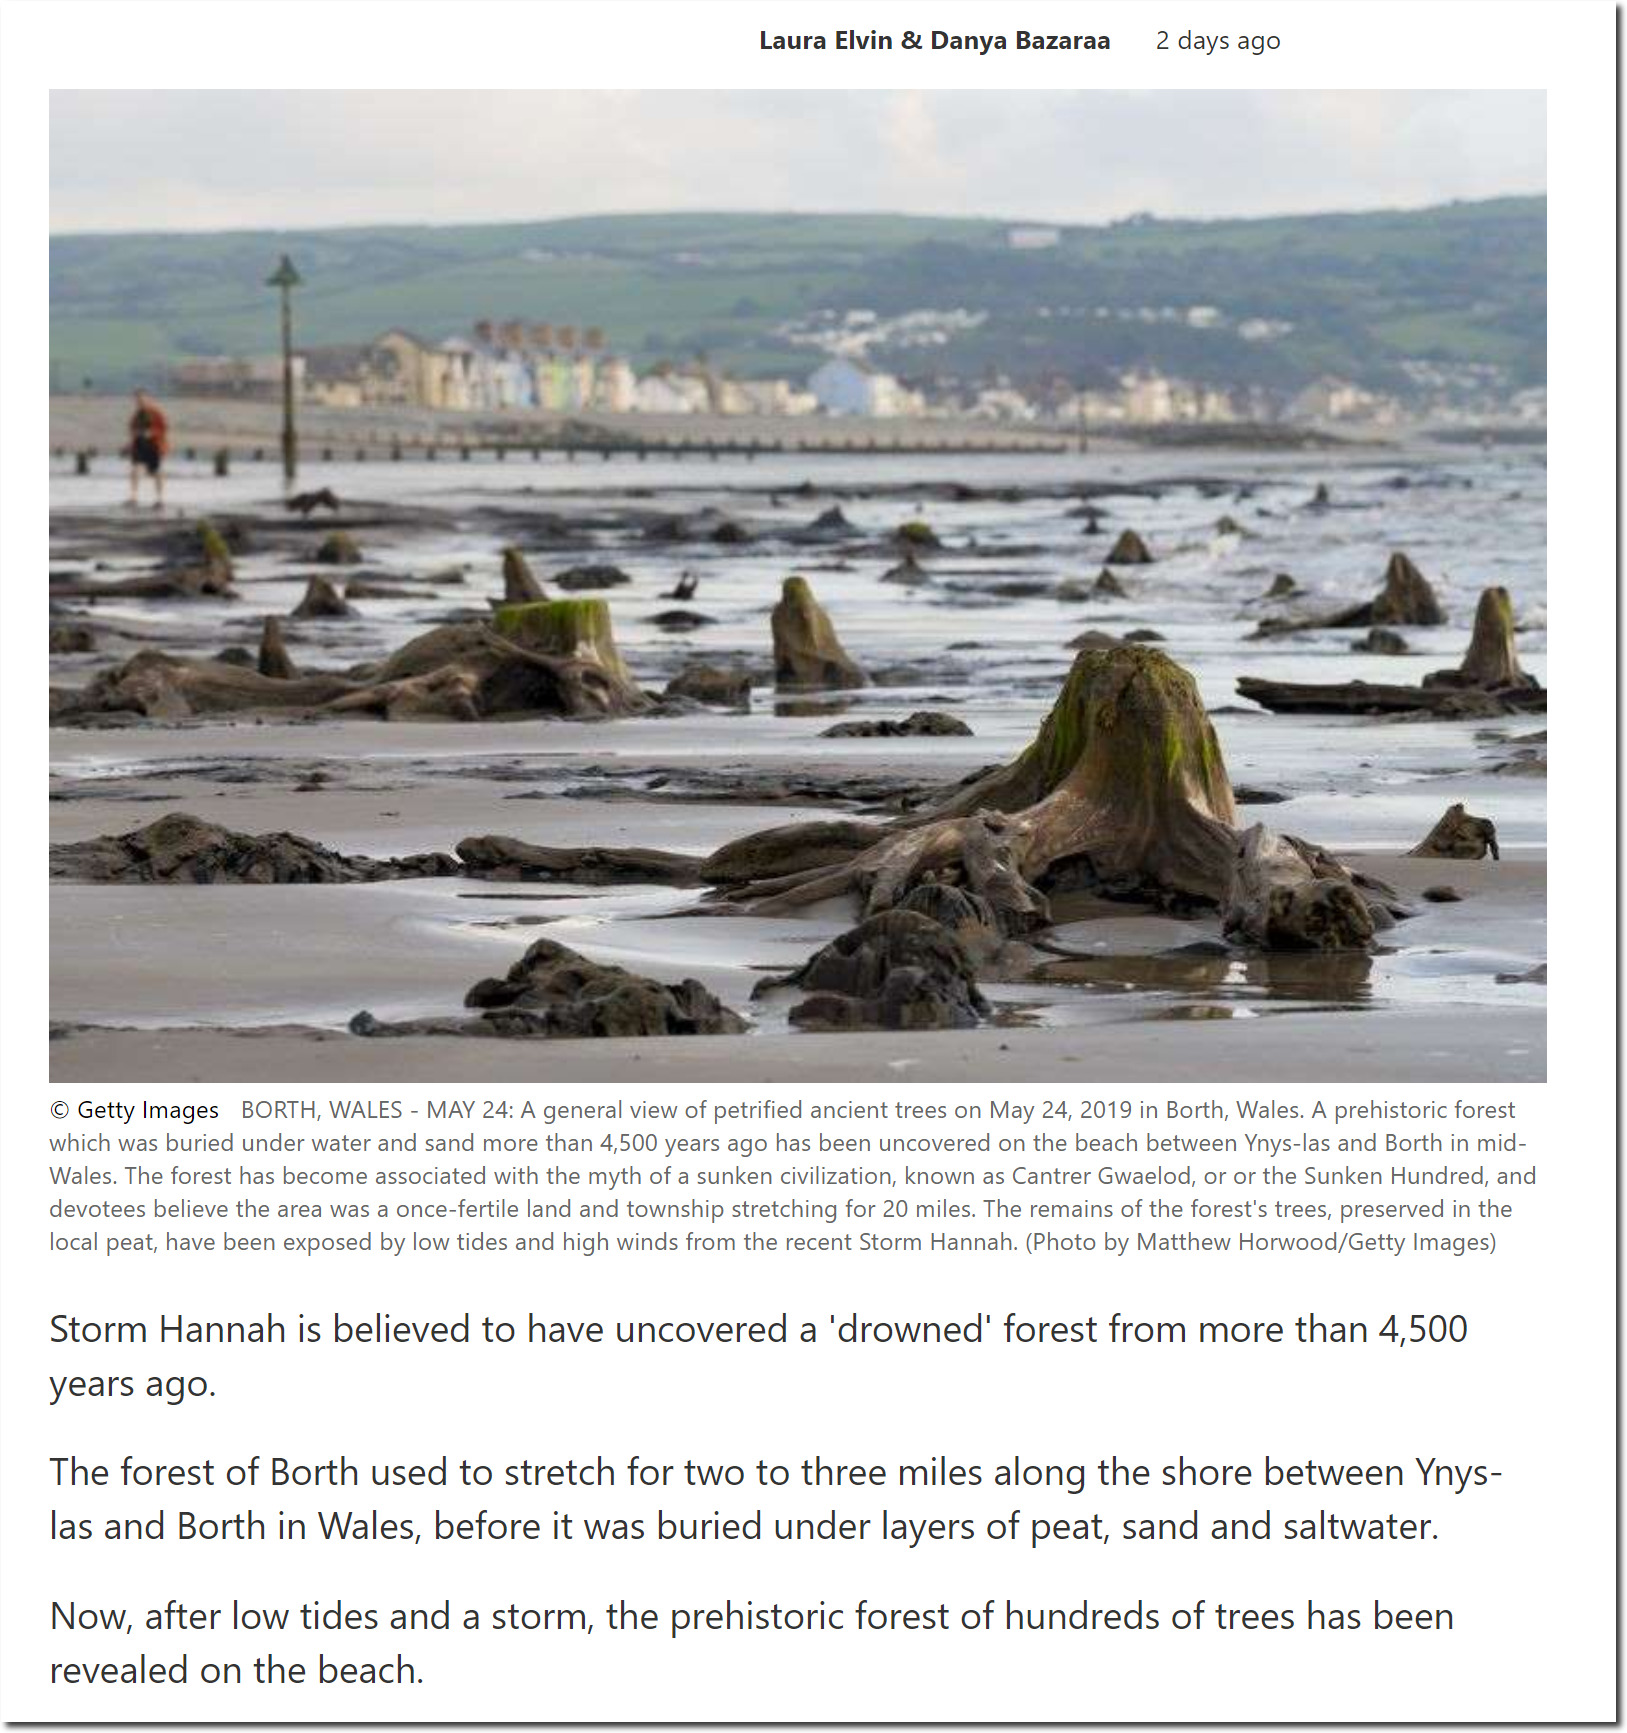
Storm Hannah unearths ‘sunken’ forest from more than 4,500 years ago
Posted in Uncategorized
Leave a comment
Charles Manson Explains Climate Change
Globalists and socialist politicians like AOC and Bernie Sanders, share the same philosophy as Charles Manson.
If it doesn’t come to One World Now, there will be no planet, there will be no life on the planet.
– Charles Manson
Posted in Uncategorized
Leave a comment
Eleven Years Since Obama Healed The Planet
Eleven years after Obama healed the planet, we only have twelve years left until it is destroyed.
Posted in Uncategorized
Leave a comment
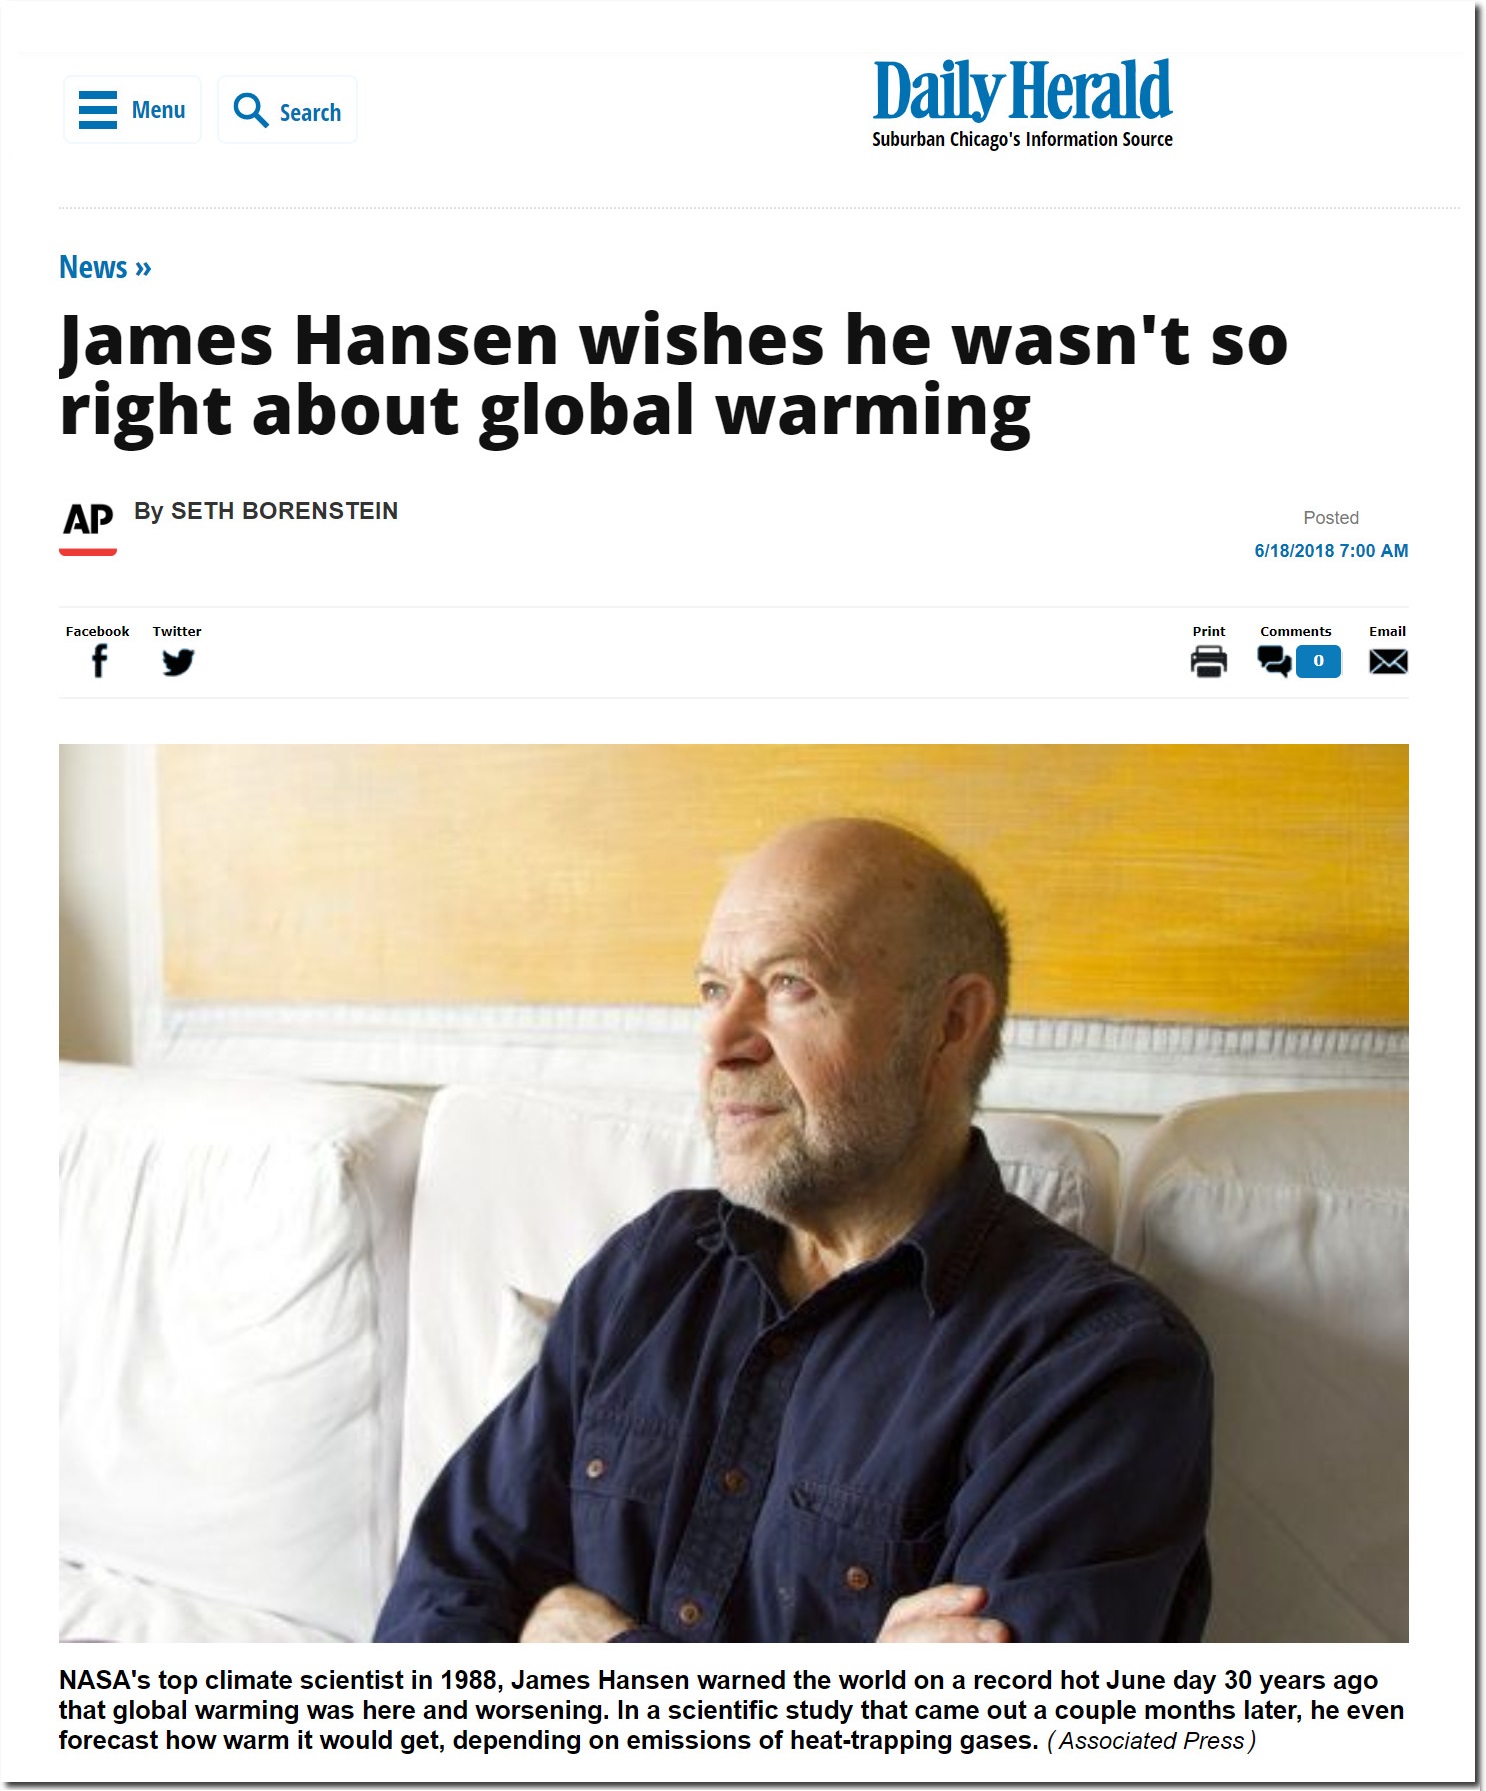
Hansen Got Everything Wrong – Alarmists Claim Victory
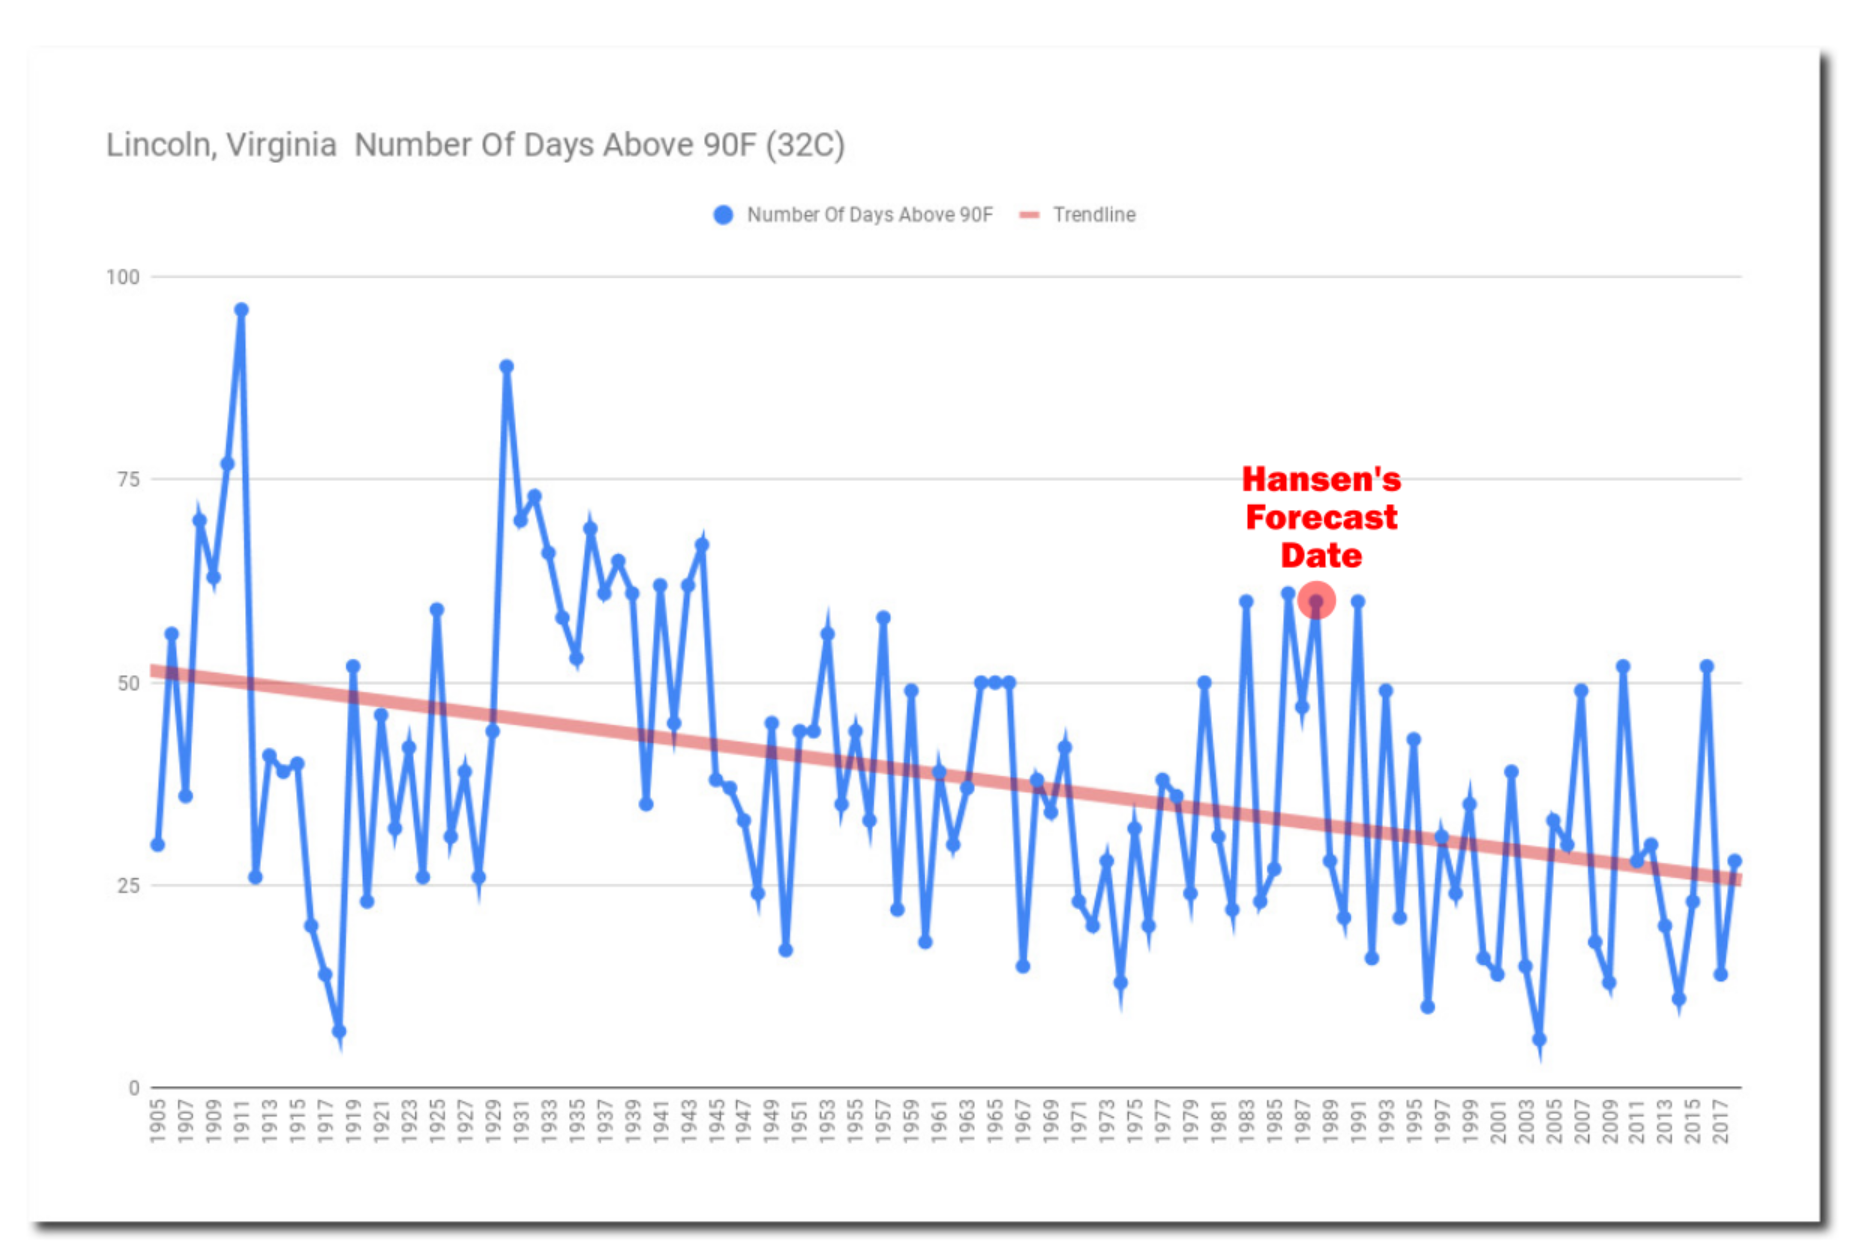
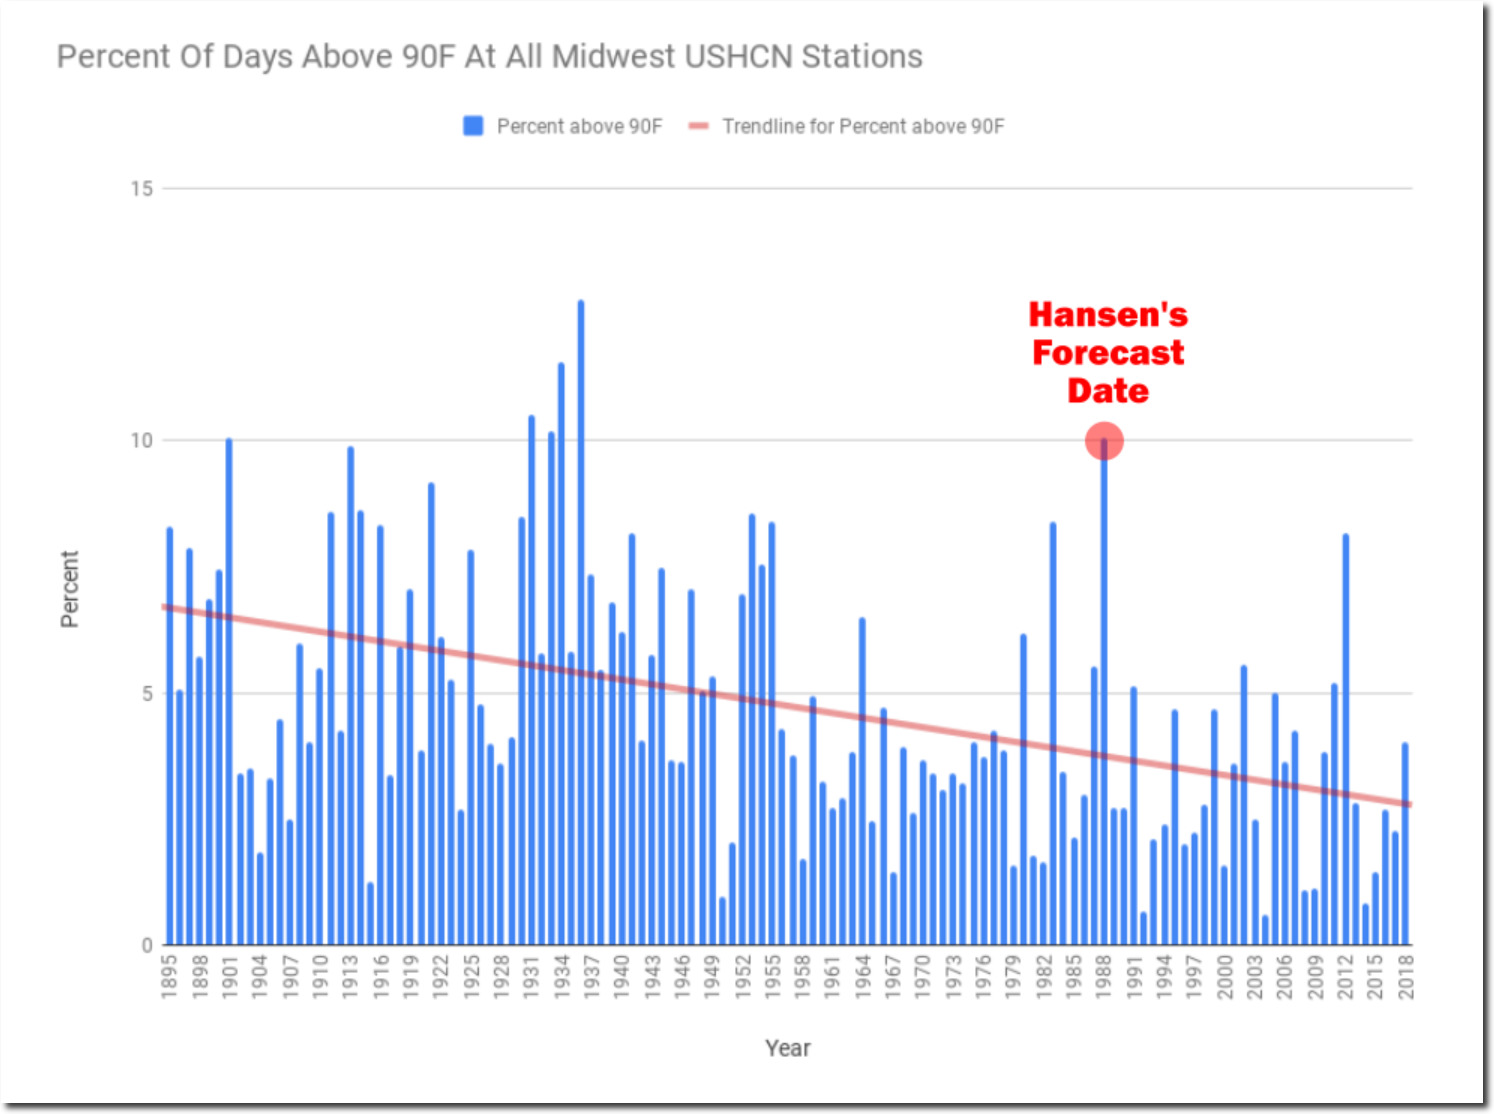
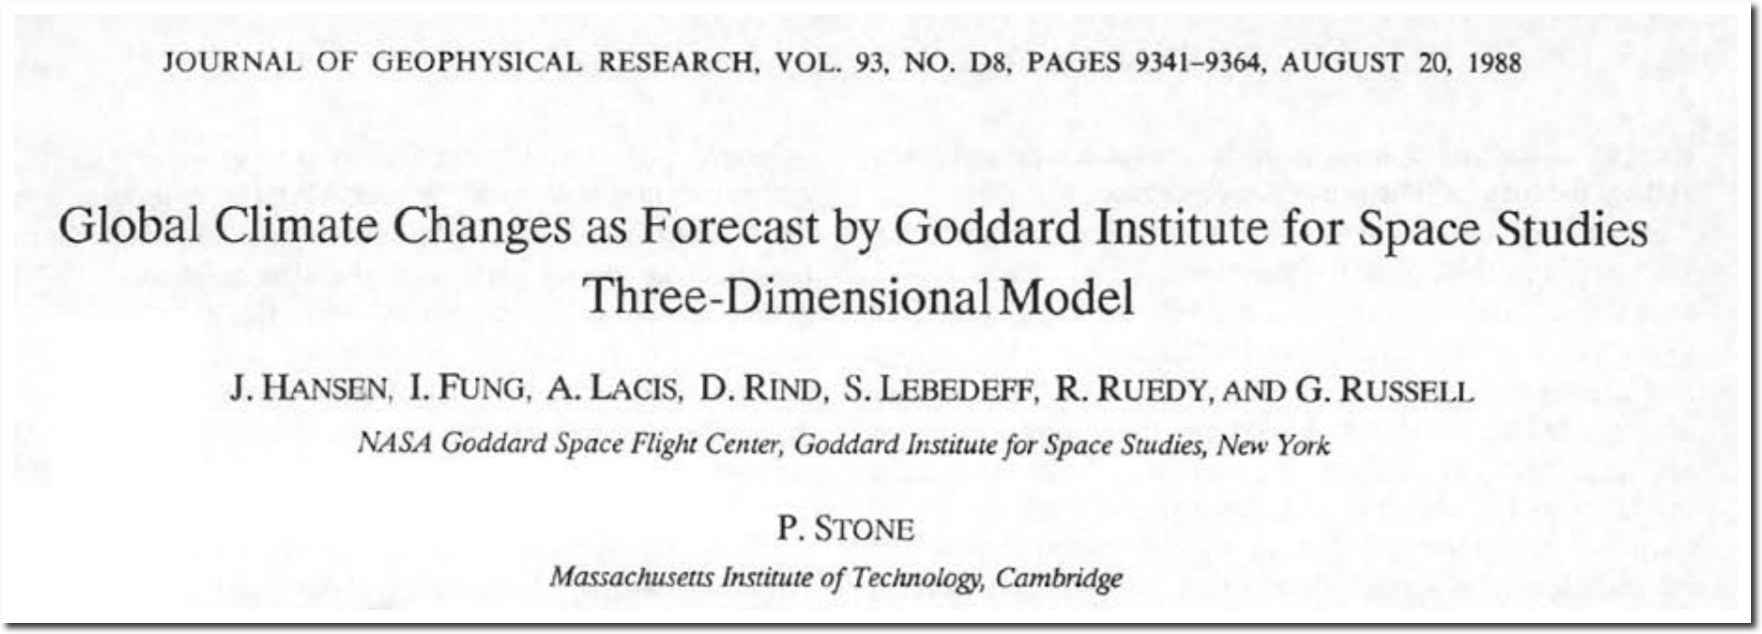
In 1988, NASA’s James Hansen predicted a huge increase in heat and drought.
If you liked last summer’s record temperatures, you’re going to love the 1990s, says James Hansen, the NASA scientist who, during congressional hearings on the Midwestern drought, linked greenhouse warming to the heat wave. Last summer was a preview of the average summer 10 years from now, and the hottest summers during the ’90s will be even hotter and drier than the one we just struggled through, he says.
If we do nothing to cut down on pumping carbon dioxide into the atmosphere, temperatures in 2050 will be 6 to 7 degrees higher than they are today. Washington, D.C., for instance, would go from its current 35 days a year over 90 degrees to 85 days a year.
– James Hansen 1988
12 Dec 1988, Page 34 – Lansing State Journal
He got all of his forecasts exactly backwards. The number of hot days in the DC area peaked in 1911, and have been declining ever since.
The number of hot days in the Midwest peaked in 1936, and have been declining ever since.
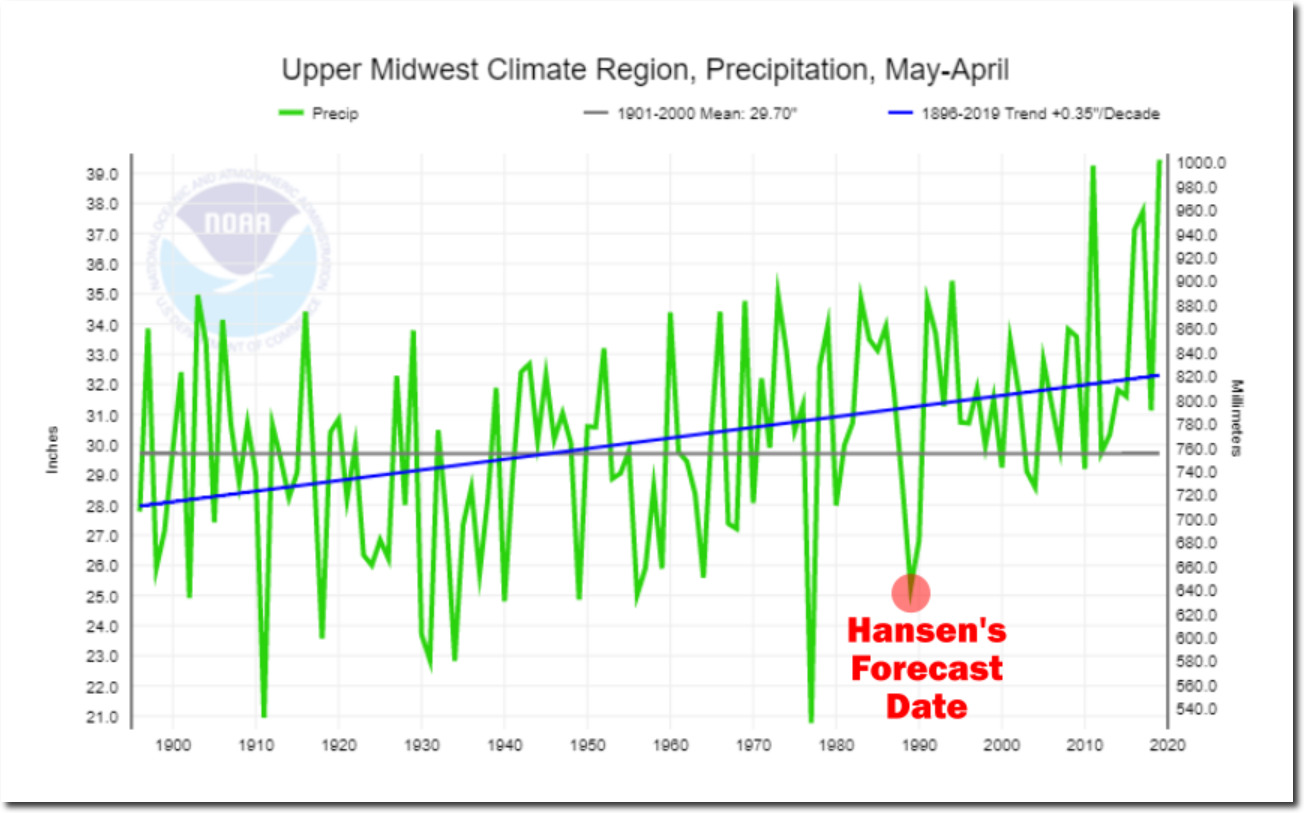
The last really dry year in the Midwest was 1988, and recent years have been record wet.
Climate at a Glance | National Centers for Environmental Information (NCEI)
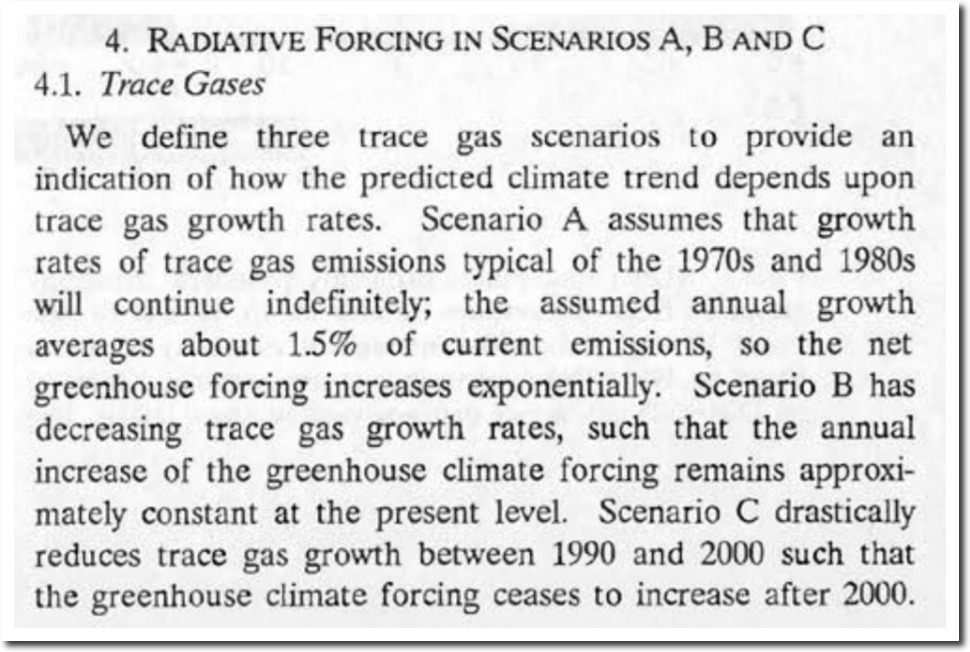
Hansen made temperature forecasts for three emissions scenarios. Scenario A was increasing emission growth rates. Scenario B was decreasing emission growth rates. Scenario C was no emissions after the year 2000.
“We have considered cases ranging from business as usual, which is scenario A, to draconian emission cuts, scenario C, which would totally eliminate net trace gas growth by year 2000.”
Climate Change and American Policy: Key Documents, 1979-2015 – Google Books
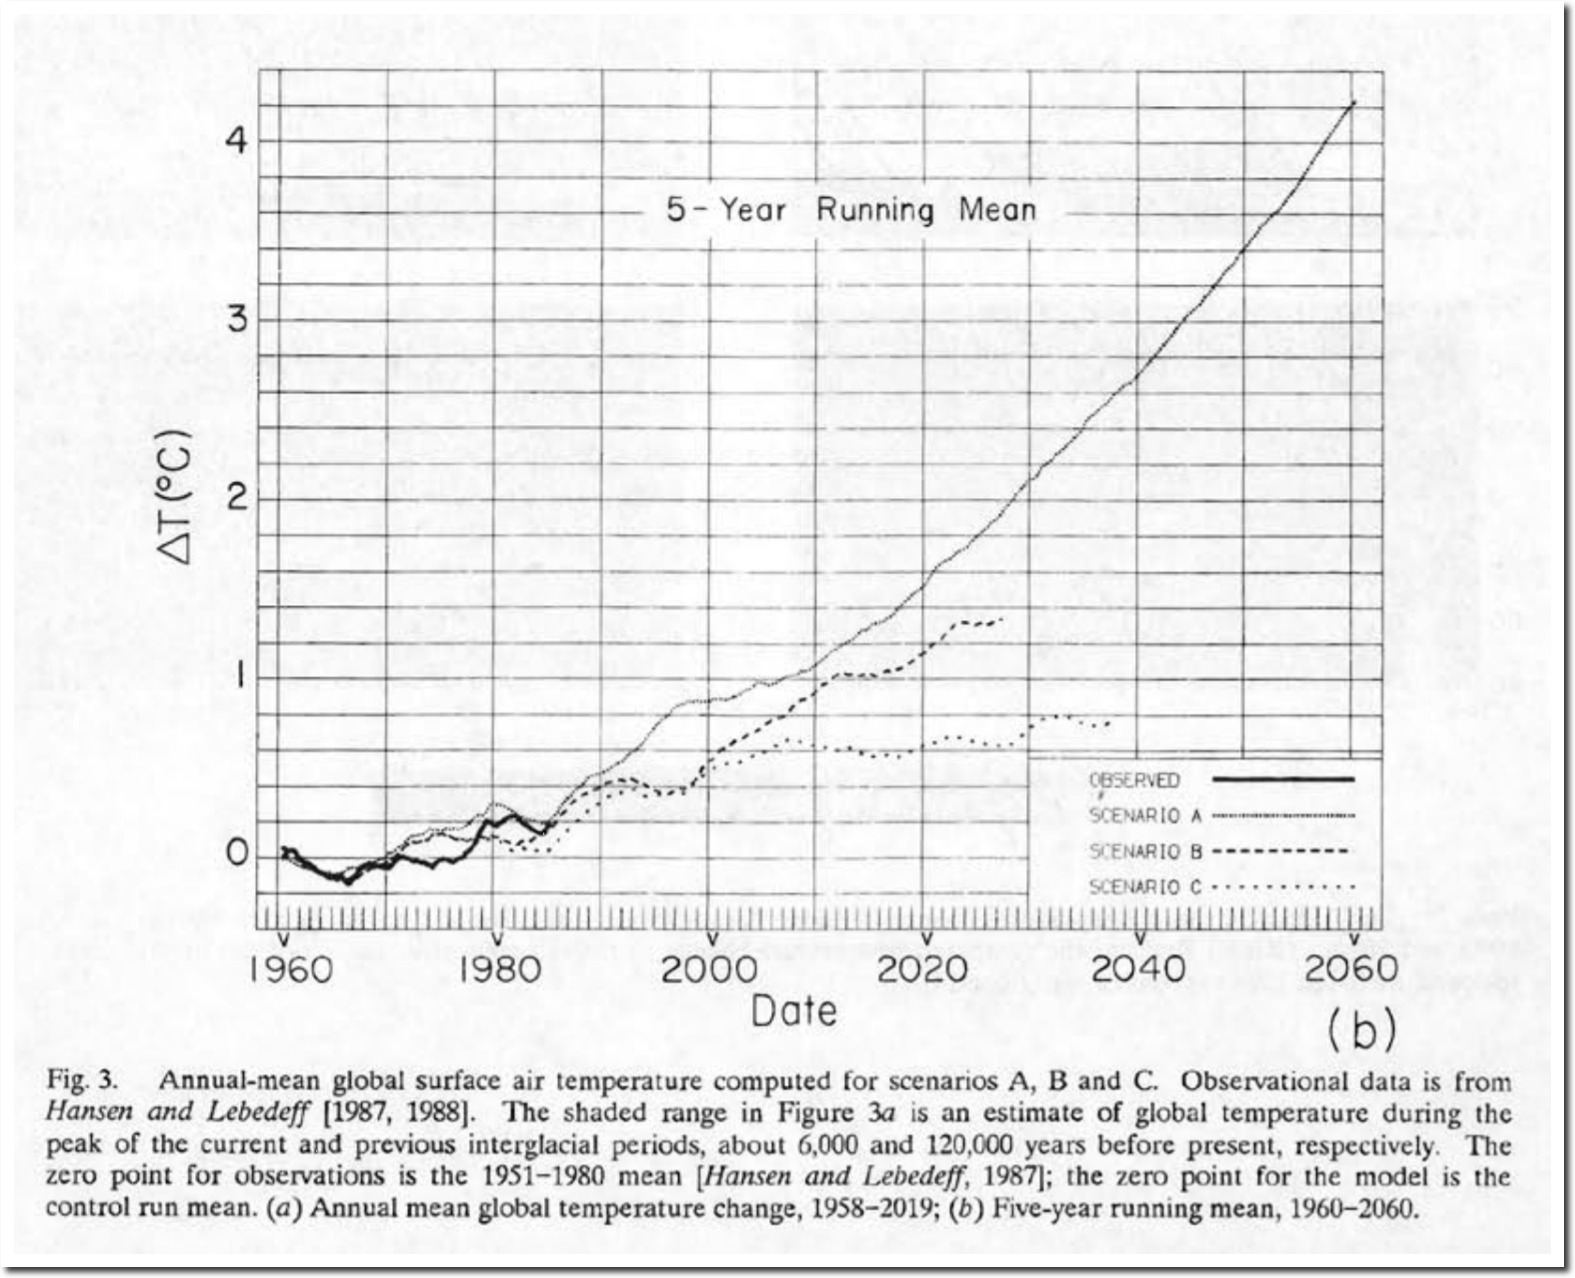
So how did Hansen do? The graph below shows the five year mean of lower troposphere temperatures measured by satellite.
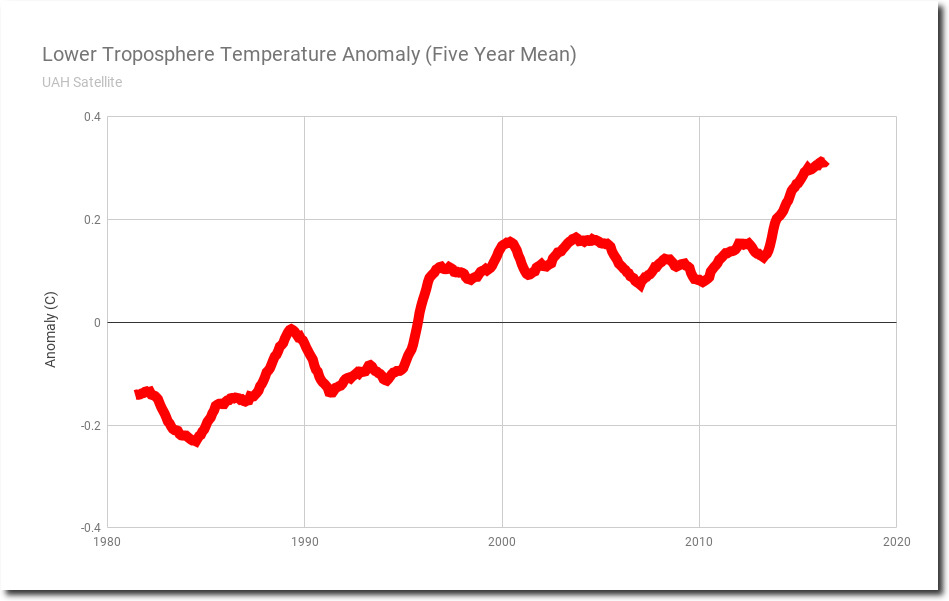
Wood for Trees: Interactive Graphs
The next graph overlays the satellite lower troposphere temperatures in red, on Hansen’s 1988 forecasts – at the same scale and normalized to the early 1980’s. Lower troposphere temperatures have tracked Hansen’s zero emissions scenario.
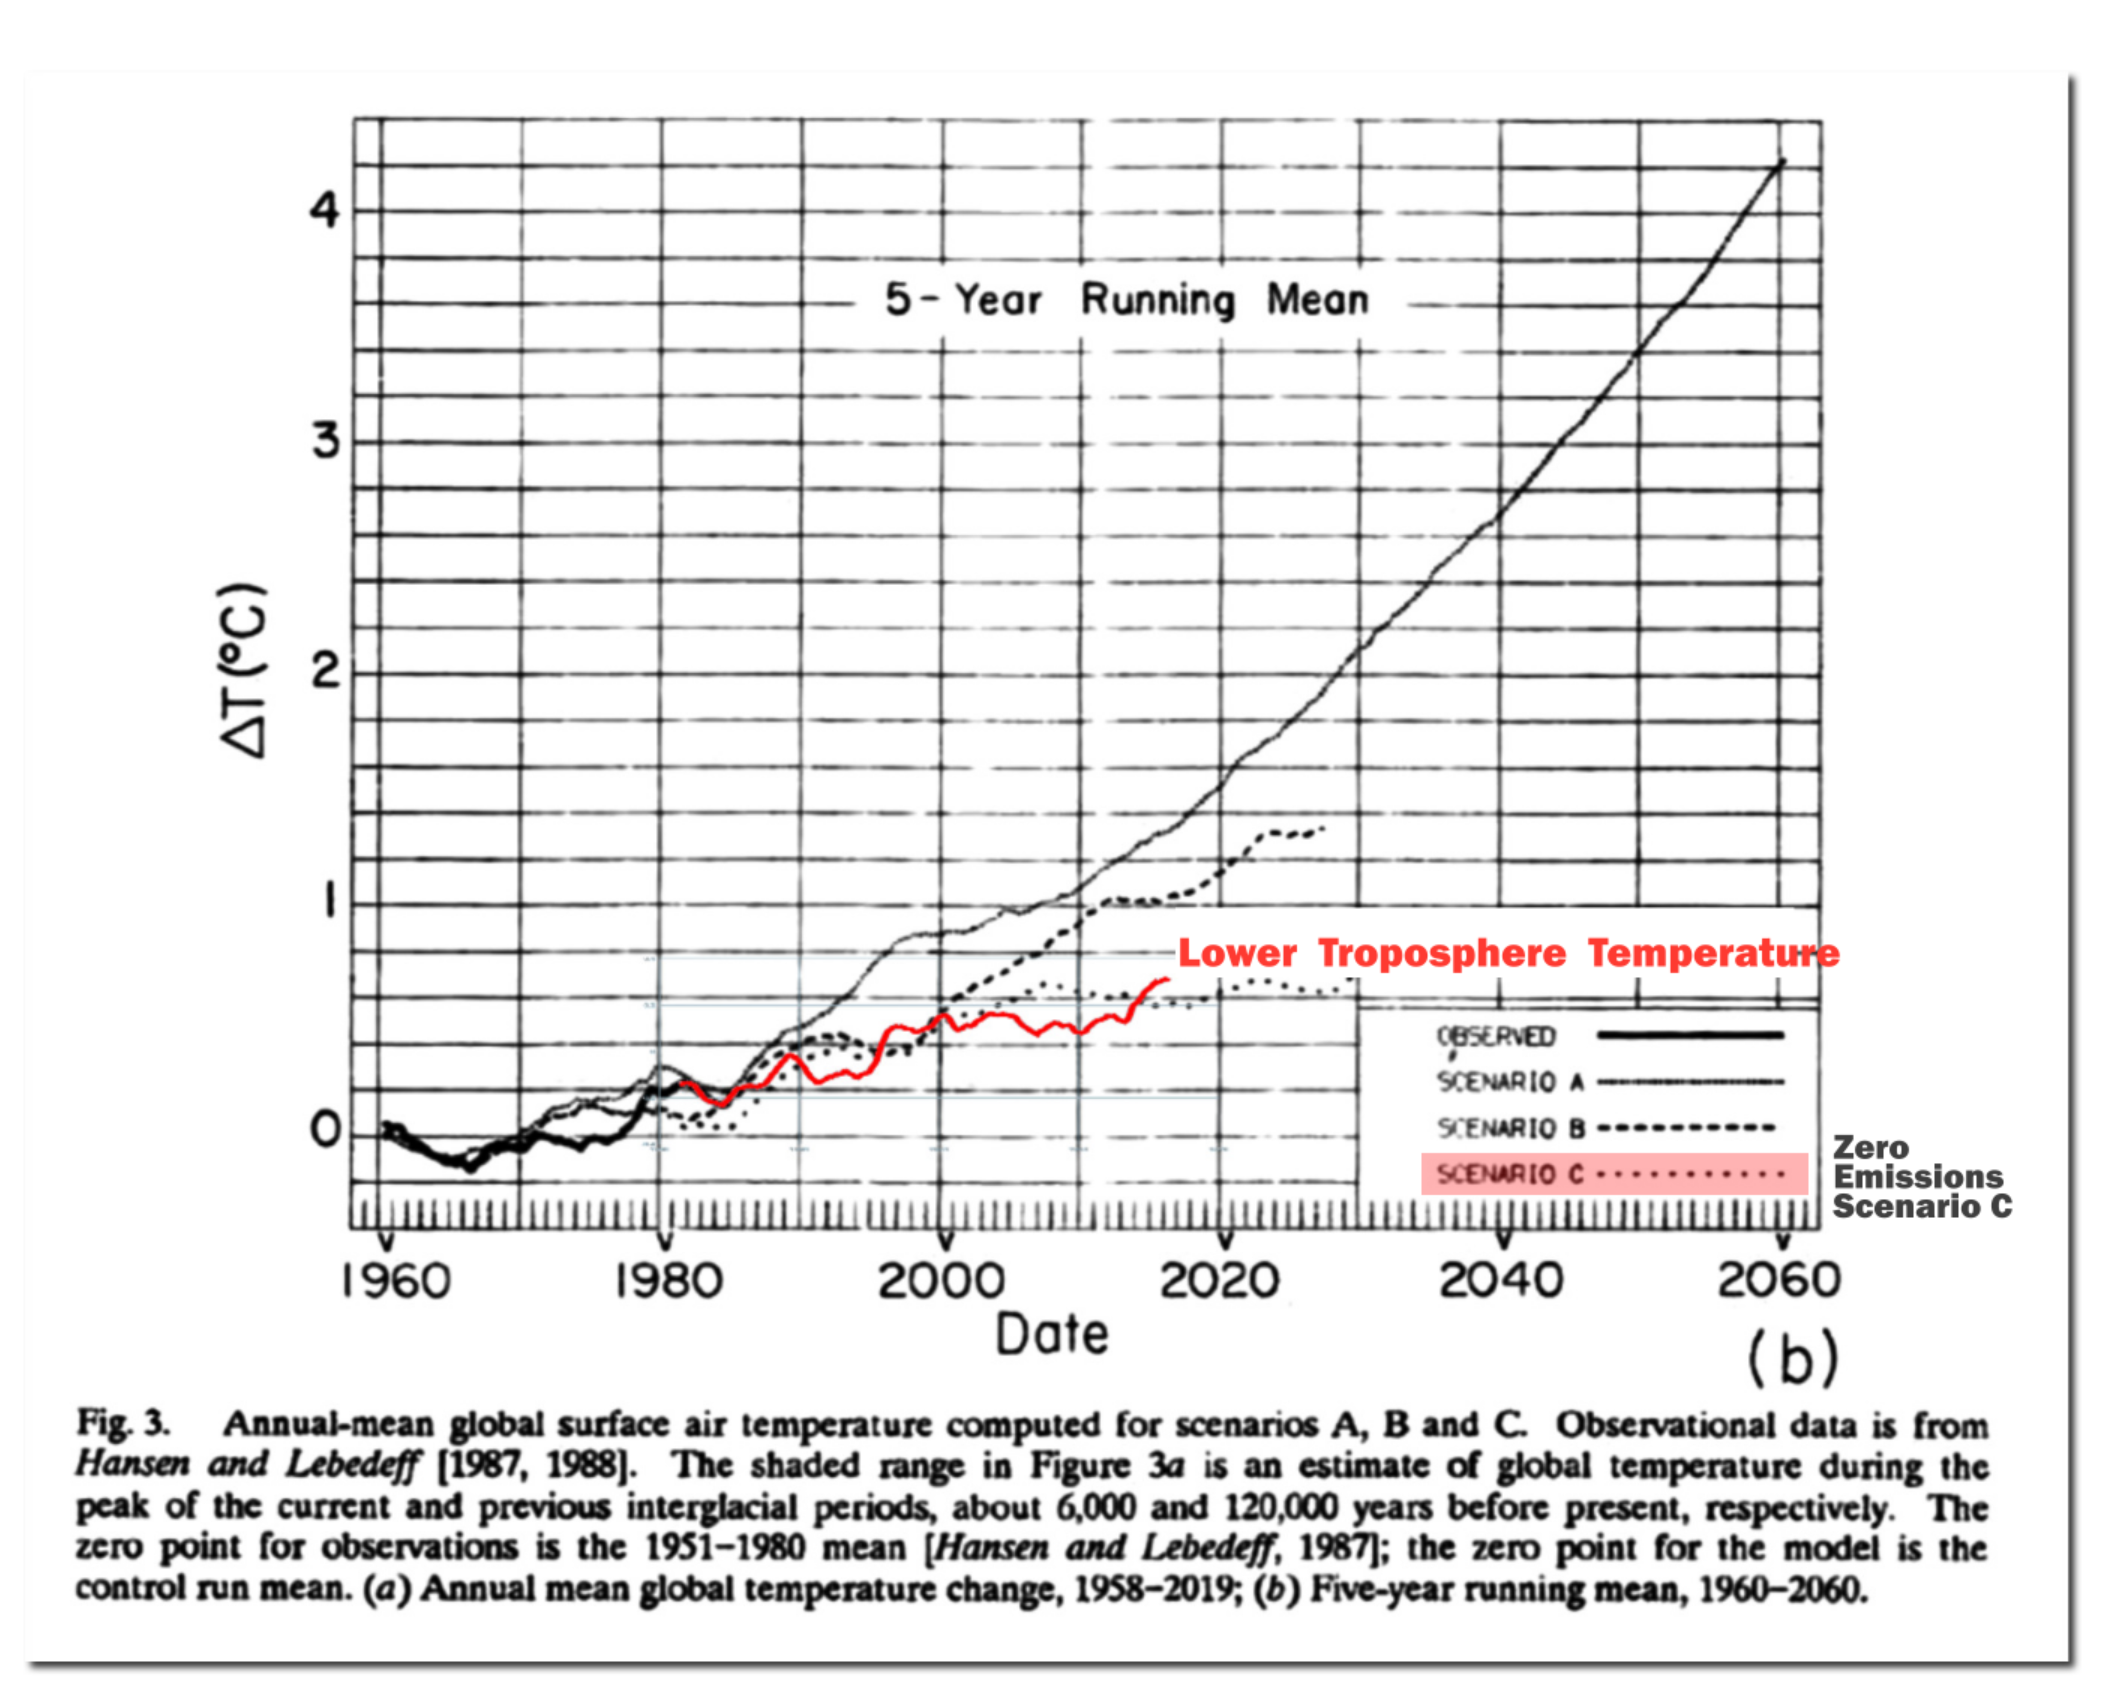
The press quite predictably responded to Hansen’s massive failures, by declaring them to be correct.
Posted in Uncategorized
Leave a comment