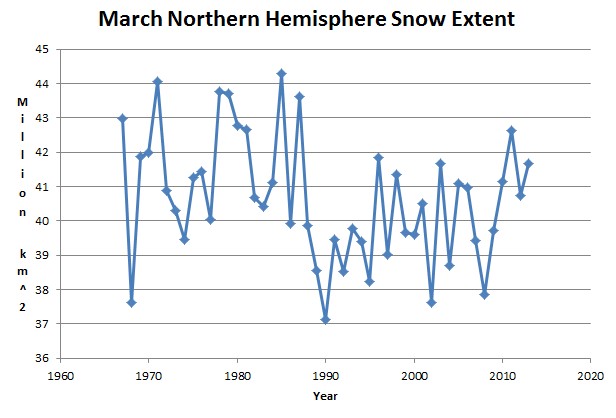
One of the more popular global warming fantasies was declining spring snow cover. Looks like that canary in the coal mine has flown south.
Disrupting the Borg is expensive and time consuming!
Google Search
-
Recent Posts
- Analyzing The Western Water Crisis
- Gaslighting 1924
- “Why Do You Resist?”
- Climate Attribution Model
- Fact Checking NASA
- Fact Checking Grok
- Fact Checking The New York Times
- New Visitech Features
- Ice-Free Arctic By 2014
- Debt-Free US Treasury Forecast
- Analyzing Big City Crime (Part 2)
- Analyzing Big City Crime
- UK Migration Caused By Global Warming
- Climate Attribution In Greece
- “Brown: ’50 days to save world'”
- The Catastrophic Influence of Bovine Methane Emissions on Extraterrestrial Climate Patterns
- Posting On X
- Seventeen Years Of Fun
- The Importance Of Good Tools
- Temperature Shifts At Blue Hill, MA
- CO2²
- Time Of Observation Bias
- Climate Scamming For Profit
- Back To The Future
Recent Comments
- Bob G on Analyzing The Western Water Crisis
- Mike Peinsipp on Analyzing The Western Water Crisis
- Bob G on Analyzing The Western Water Crisis
- Robertvd on Analyzing The Western Water Crisis
- Bob G on Analyzing The Western Water Crisis
- conrad ziefle on Analyzing The Western Water Crisis
- Bob G on Analyzing The Western Water Crisis
- arn on Analyzing The Western Water Crisis


Kinda matches multidecadal-long natural cycles.
Also the 1957-1987 period were unusually snowy, at least in the US. Probably the period from 1927-1957 would be closer to the years around 2000. So nothing profound about that chart.
I have made similar charts with data from a local ski area…they show increasing snow and precipitation for March, and dramatically so for April and May