
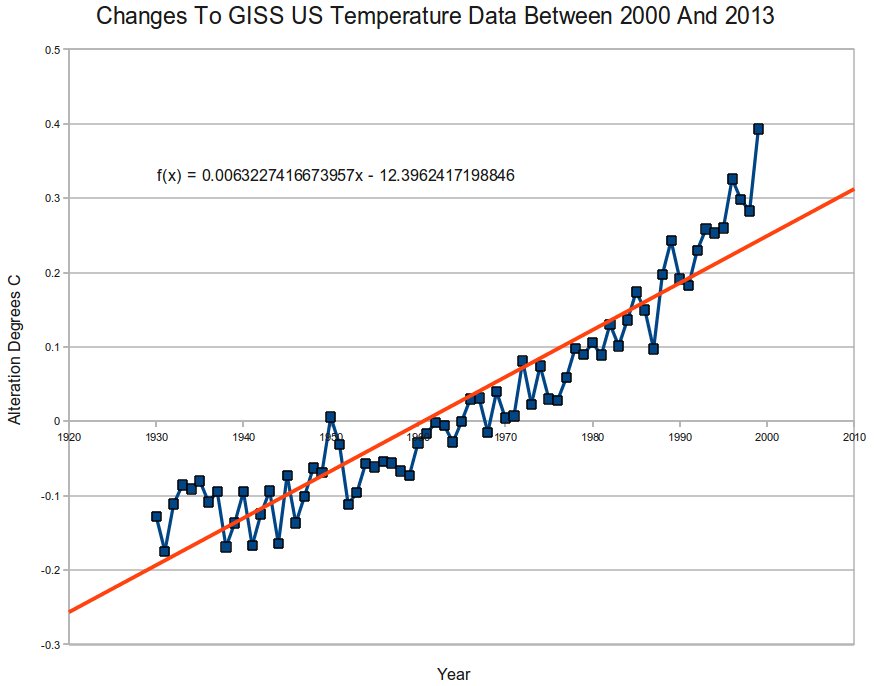
GISS used to show that the US cooled from 1930 through 1999, and that 1934 was much warmer than 1998. But they changed the graph to create the appearance of a non-existent warming trend.
http://web.archive.org/web/20120124014257/http://www.john-daly.com/usatemps.006
data.giss.nasa.gov/gistemp/graphs_v3/Fig.D.txt
GISS is tampering with US temperatures at a rate of 0.6ºC per century.

Reblogged this on The Firewall.
I noticed a curious association of the NASA GISS entrance with Columbia Business School:
http://postimg.org/image/tboyszfu5/
That’s just their standard logo on the side street entrance, not ten feet from the back of Tom’s Diner. The plaque does not appear in Google Street View so is new.
I also humorously note that Jim Hansen’s new personal web page now lists his address in a different off-campus building, namely a theology building next to church, near Riverside Park.
They just need to keep the scam going a few more years so they can qualify for their big fat government pensions. Once they are retired the next crew can have long careers and get their pensions by fixing the tampered data.
Good scam, they get paid either way.
Fraud, plain and simple.
Keep up the good work, Steven. These charts are precious.
That’s 0.6°/century / 1.3 decades = 0.46°C per century of tampering PER DECADE!
Winston Smith works as a clerk in the Records Department of the Ministry of Truth, where his job is to rewrite historical documents so they match the constantly changing current party line.
Once over his initial left-wing foolishness George Orwell (aka Eric A. Blair) understood the madness of lefty socialist mentality.
He foolishly believed that his books were warnings about possible futures. Unfortunately the lazy leaders of today use his writings as blueprints.
Question – Isn’t it true that GISS gets its climate data form NOAA, who also “adjusts” the numbers as well? Would it be fair to say that there are a couple layers of tampering going on?
I never have figured out the justification for the data tampering. Has anyone ever given an understandable answer? Then station siting is so important. Just putting the thermometer in a low pocket can make it 5-10 degrees colder on a still night, not to mention exposure to sun, presence of asphalt, concrete,etc. Vegetation, trees and water as well. There is an obvious art to station siting that can easily make 3-4 degrees difference in the same general location. Since NOAA controls ths siting, they control that aspect completely and we know they have an agenda.
The right-wing thermometer readers of the past were always reading temperatures too high. This was due to their erroneous optimism that deluded them into continuously thinking it was warmer than it really was.
These were low temperatures in the Washington, DC area this morning.
National Airport 29
Quantico 24
Patuxent 23
Dulles 23
Andrews AFB 23
BWI 22
Fredericksburg 22
Fort Belvoir 21
You can see that aside from National Airport, the temperatures are very uniform, but average more than 6 degrees colder than National Airport. Yet National is the “official” station.
It is not hard to have heat records when your station is so unrepresentative. No doubt deliberately so.
Yea… It’s probably right at the beginning of the runway where it can get a nice warm jet blast …
Nice looking CO2 curve there…
Runaway temperature tampering.
If you like your temperature fraud you can keep your temperature fraud.
Over the last week, Northern Australia experienced 2-4 inches of widespread drought with peaks of 12 inches, 100% in line with Australian Bureau of meteorology forecast of catastrophic and horrific drought this summer. Complete F***wits!
http://www.bom.gov.au/jsp/awap/rain/index.jsp?colour=colour&time=latest&step=0&map=totals&period=week&area=nat
Of course they had to alter the data… The 30’s were inconveniently Hot… As Stephen’s demonstrated repeatedly right here using Hansen’s data, IPCC Data, UHCN data.. In other words charting real Temp measurements … Not “normalizing” then pooping out a chart …