It looks to me like the AMO temperature rise for the last thirty years or so has followed the same pattern that it did in 1920 to 1950 or so — before CAGW was a factor. If the current AMO pattern is just another repeat of the earlier natural variation, then how has CO2 done anything noticeable?
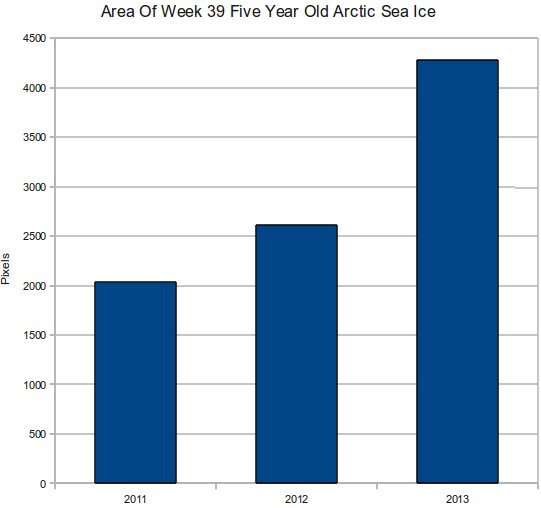
As for the change in Arctic ice, we do not have so much verifiable info on what it did during the last AMO rise of 1920ish to 1950ish. Anecdotal, there was a similar shrinking of ice, followed by a rise when the AMO went negative.
So, of the two charts, the AMO shows nothing unusual. Unfortunately, the ice chart is not comparable to the AMO chart because it does not have data for comparison.


A potentially dumb question, but how one measure the age of ice? Is this a measurement of ice thickness from which one infers age?
The University of Colorado tracks specific floes of ice from week to week.
Nah nah nah, it’s gotta be 10^H^H20^H^H30 years of ice to be a legit trend.
What do you think Steve?
Look about right?
I am no climate scientist, just an arm chair denier.
https://twitter.com/NJSnowFan/status/396274679897260032/photo/1
It looks to me like the AMO temperature rise for the last thirty years or so has followed the same pattern that it did in 1920 to 1950 or so — before CAGW was a factor. If the current AMO pattern is just another repeat of the earlier natural variation, then how has CO2 done anything noticeable?
As for the change in Arctic ice, we do not have so much verifiable info on what it did during the last AMO rise of 1920ish to 1950ish. Anecdotal, there was a similar shrinking of ice, followed by a rise when the AMO went negative.
So, of the two charts, the AMO shows nothing unusual. Unfortunately, the ice chart is not comparable to the AMO chart because it does not have data for comparison.
Barrow Alaska is cold today -4F, Flash freeze of ocean, Barrow will not see open water till next summer after this weekend. My call
http://seaice.alaska.edu/gi/observatories/barrow_webcam
Why don’t you do another one where you compare 2000 to 2013.