
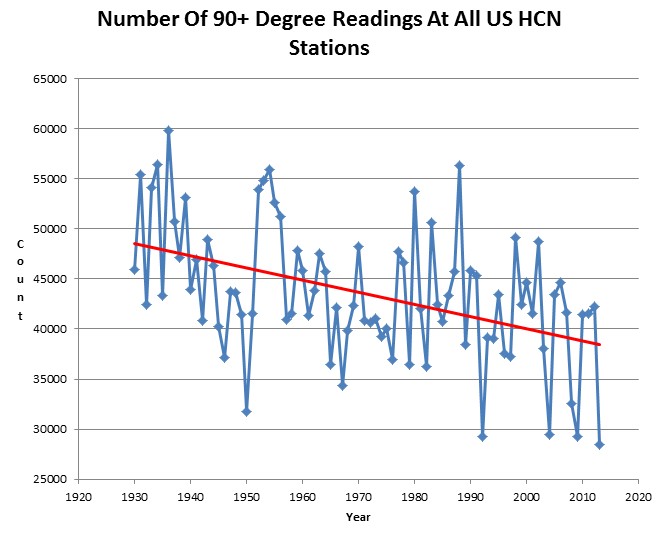
The number of 90ºF readings in the US has been steadily declining, with 2013 recording the fewest in the modern record.
There have been 2,489 daily record minimums this year, compared to 2,193 daily record maximums at all US HCN stations.
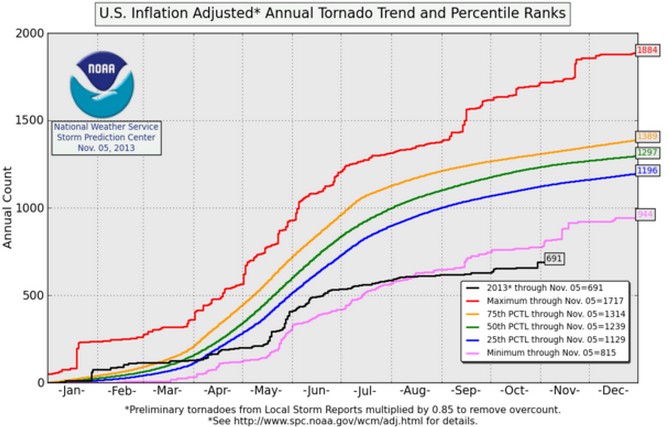
The US was hit by no hurricanes in 2013, and suffered the fewest tornadoes on record.
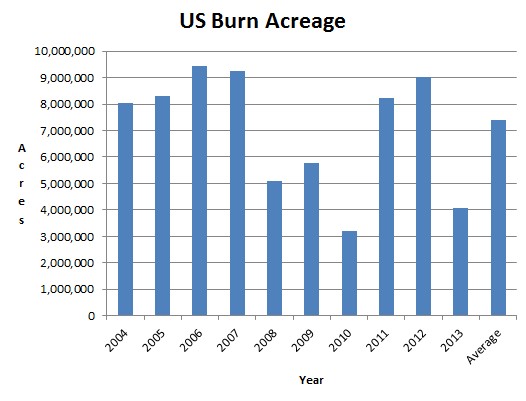
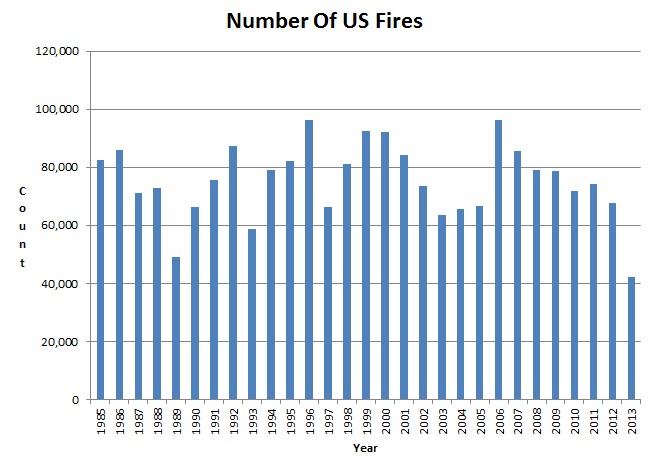
Forest fire burn acreage was the second lowest in a decade, and the number of fires was lowest since 1984.
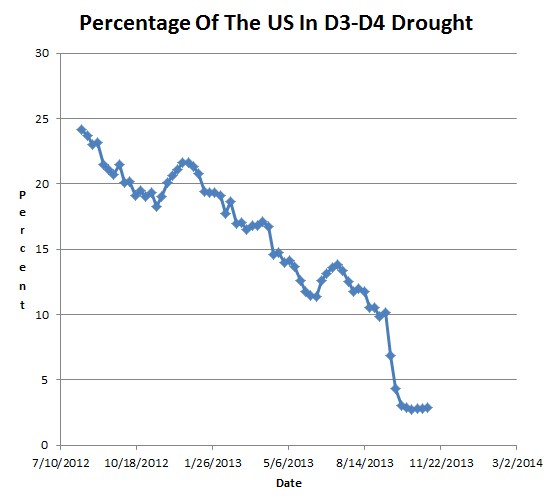
The drought has nearly ended
United States Drought Monitor > Data Archive > Tables
Obama believes global warming is getting worse because apparently he’s sweating a lot more during his second term
– Jay Leno


Yes it was quiet. Too quiet.
But… won’t they just claim that is Extreme? Just like the mild winter last year, was extreme.
Almost two months left in the year and a big-ass cold front has pushed though and is blanketing most of the continental US with cold temperatures — it’s in the 30s in Georgia, Alabama, Mississippi, Arizona… we ain’t gonna be setting many more high temp records but plenty of low records still to come.
It’s all global warming, of course, but people ain’t as stupid as they’re given credit for. I think it’s going to be a hard sell.
Steve, can you shed some light on the first graph, which reads, “at all US HCN stations”? This is for 90 degree plus readings. In the past your charts going back this far stated for all ,”continuously active US HCN stations”, meaning that the chart was for the same number of stations for each year. If this is not for the same number of stations, how does that affect the chart?
It is very similar