According to USHCN docs, the V2 TOBS adjustment hasn’t changed since V1
This net effect is about the same as that of the TOB adjustments in the HCN version 1 temperature data (Hansen et al. 2001), which is to be expected since the same TOB-adjustment method is used in both versions.
ftp://ftp.ncdc.noaa.gov/pub/data/ushcn/v2/monthly/menne-etal2009.pdf
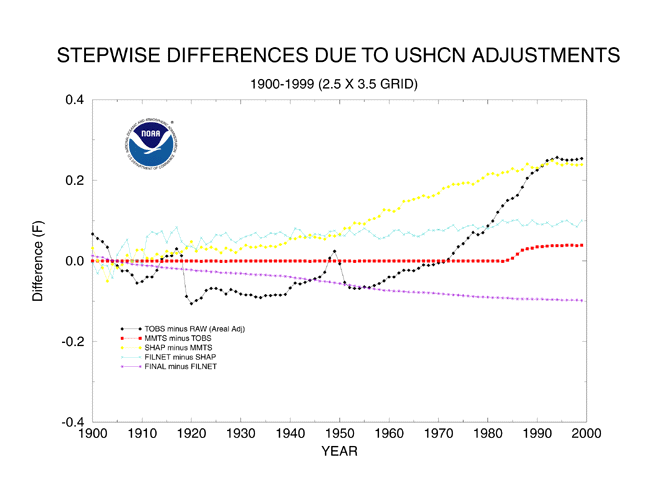
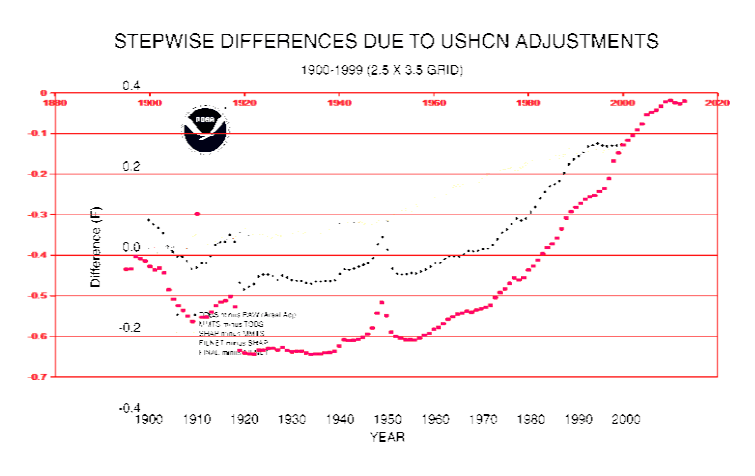
The V1 TOBS adjustment was + 0.3F, and went flat after 1990.
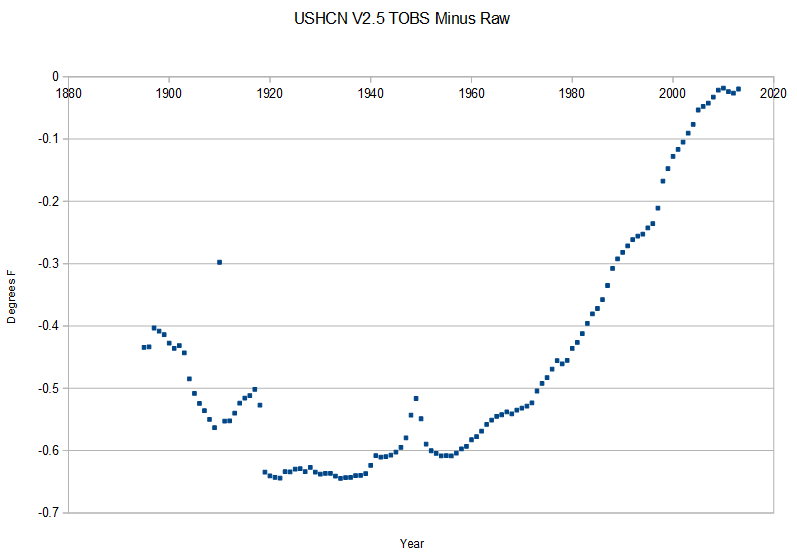
But the V2 adjustment (which is supposed to be the same) is twice as large, and negative.
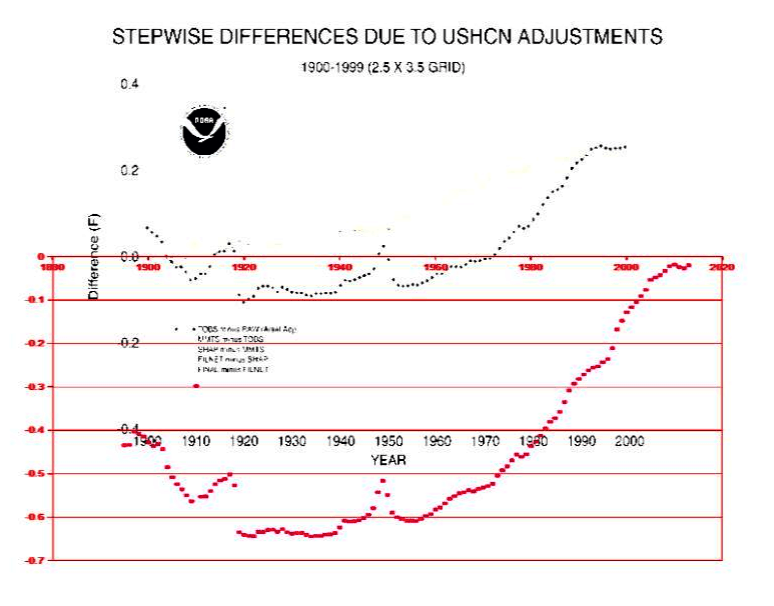
The next graph overlays the V2 adjustments in red, on the V1 adjustments in black. They claim that it is the same algorithm and nearly the same data.
Below, I normalized the two data sets to 1940, and you can see that there is a large divergence between V2 and V1 after 1950, and particularly after 1990. In V1, TOBS goes flat after 1990, but in V2 it rises exponentially.
Here is their claim again.
This net effect is about the same as that of the TOB adjustments in the HCN version 1 temperature data (Hansen et al. 2001), which is to be expected since the same TOB-adjustment method is used in both versions.
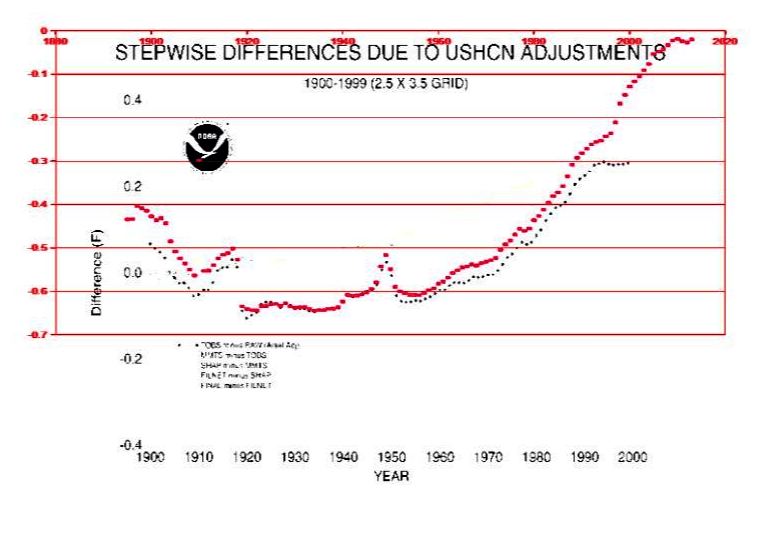
One more view shows the adjustments normalized to 1998. As always, cooling the past to create the appearance of warming.


Why the heck are they even doing Tobs adjustments? The min/max thermometer has been around for centuries!
The Six’s registering thermometer which can record the maximum and minimum temperatures was invented in 1782. The most that would happen is someone ‘Might’ get a reading for the day before. Given most people would read and record just after breakfast or after dinner, I doubt Tobs is a real issue. Anthony watts and Jones are looking into the issue.
http://www.jstor.org/discover/10.2307/531601?uid=3739776&uid=2&uid=4&uid=3739256&sid=21103445273577
Here are the relevant comments from a recent thread at WUWT:
IN THE USA:
And further down:
This is probably the most significant of Evan’s comments:
A organizational flow chart is needed to visually trace the path from raw data souces to the various global average plots. For instance, is NASA really using raw data and this creating their own burst in adjustments or are they just piggybacking on another archive? Is raw data being itself altered? After all these years I’m still confused for lack of a simple visual map of the territory.
When the house is bottom-dealing, prepare to lose all your money.
As an aside, Anthony Watts has been showing for years that their homogenisation methods for siting issues also results in a cooling of the past. In fact, the method does that even for the best sited stations available (ie. even where there is no reason to touch a rural station’s record for siting, their algorithms still adjust the past downwards at those stations):
http://wattsupwiththat.com/2010/01/27/rumours-of-my-death-have-been-greatly-exaggerated/
It is also no surprise to discover (via that same post at Anthony’s site) that their adjustment for the change from mercury to MMTS measurements is exactly the opposite of what it should be. From the post:
Menne et al 2010 mentioned a “counterintuitive” cooling trend in some portions of the data. Interestingly enough, former California State Climatologist James Goodridge did an independent analysis ( I wasn’t involved in data crunchng, it was a sole effort on his part) of COOP stations in California that had gone through modernization, switching from Stevenson Screens with mercury LIG thermometers to MMTS electronic thermometers. He sifted through about 500 COOPs in California and chose stations that had at least 60 years of uninterrupted data, because as we know, a station move can cause all sorts of issues. He used the “raw” data from these stations as opposed to adjusted data.
He writes:
Hi Anthony,
I found 58 temperature station in California with data for 1949 to 2008 and where the thermometers had been changed to MMTS and the earlier parts were liquid in glass. The average for the earlier part was 59.17°F and the MMTS fraction averaged 60.07°F.
Jim
A 0.9F (0.5C) warmer offset due to modernization is significant, yet NCDC insists that the MMTS units are tested at about 0.05C cooler. I believe they add this adjustment into the final data. Our experience shows the exact opposite should be done and with a greater magnitude.
Nick from NYC says ; An organizational flow chart is needed …….
Indeed it is, and complete with the names and titles so as to expose the perps responsible for all the “adjustments”.