Disrupting the Borg is expensive and time consuming!
Google Search
-
Recent Posts
- “Earlier Than Usual”
- Perfect Correlation
- Elon’s Hockey Stick
- Latest Climate News
- “Climate dread is everywhere”
- “The Atmosphere Is ‘Thirstier.’”
- Skynet Becomes Self Aware
- “We Have To Vote For It So That You Can See What’s In It”
- Diversity Is Our Strength
- “even within the lifetime of our children”
- 60 Years Of Progress in London
- The Anti-Greta
- “a persistent concern”
- Deadliest US Tornado Days
- The Other Side Of The Pond
- “HEMI V8 Roars Back”
- Big Pharma Sales Tool
- Your Tax Dollars At Work
- 622 billion tons of new ice
- Fossil Fuels To Turn The UK Tropical
- 100% Tariffs On Chinese EV’s
- Fossil Fuels Cause Fungus
- Prophets Of Doom
- The Green New Deal Lives On
- Mission Accomplished!
Recent Comments
- Bob G on “Earlier Than Usual”
- MLH on “Earlier Than Usual”
- Gordon Vigurs on Perfect Correlation
- Jack the Insider on “Earlier Than Usual”
- Bob G on “Earlier Than Usual”
- John Francis on “Earlier Than Usual”
- John Francis on “Earlier Than Usual”
- Terry Shipman on “Earlier Than Usual”
- arn on “Earlier Than Usual”
- Gordon Vigurs on “Earlier Than Usual”
Comment Of The Day
This entry was posted in Uncategorized. Bookmark the permalink.


“with a rise in the average global temperature of more than 7 degrees Fahrenheit possible by 2100”
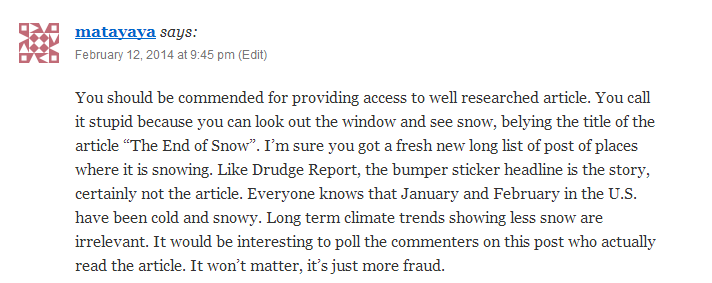
Everything flows from that made up number. Ipso facto, the article is fantasy.
I’m a commenter on this post who actually read the article. Matayaya’s last comment is correct: “It’s just more fraud.”
Steve,
Let’s start keeping a tally of how many of Matayaya’s posts become “Comment(s) of the Day.” I may have missed a few, but I think (with this post included) he’s up to 3?
Congrats matayaya! Chief climate ethicist/admitted fraudster Peter Gleick must be so proud of you.
I wonder if Matayaya will come to this thread and say Rutgers Lab is lying and a fraud.
So, it looks like the idiot who wrote the article is claiming that the 2013 coverage minus the 1967 coverage is a long-term trend. Matayoyo, is that you?
For instance, week 6 snow coverage appears to vary from a high of 53.9Mkm² (1978, go figure) to a low of 42.6Mkm² (1990). So, we “lost” 11.3Mkm² in 12 years, woo! Panic! For week 6, the greatest year to year difference appears to be 1977-1978 when we “gained” 10.9Mkm². The greatest single year to year “loss” (again, for week 6) appears to be 1980-1981 when we “lost” 5.6Mkm².
Yet somehow we still have snow. Good job, fellow deniers, we can’t even use our evil thoughts to melt a little snow.
Even if M is right about we heating up the Earth, building wind and solar farms and government taking over control would not be the solution. Big government is never the solution .History has shown that Big government only brings misery. Big government is unsustainable ,like a cancer.
None of it matters when you’re clinically insane.
Spring coverage isn’t looking anywhere near as variable as weeks 4, 5, & 6, so I wonder why the ijit picked Spring.
Week 12 (the first week that would have a day of Spring in it) varies from 43.4Mkm² (1987, & note that by week 12, 1978 has lost more than 14Mkm² of its peak snow cover: this is 10× the supposed long-term loss quoted in Matayoyo’s article) to 35.1Mkm² (1989).
Week 13 (the first full week of Spring) varies from 42.5Mkm² (again 1987) to 31.2Mkm² (1973, which had a one-week melt-off of 8.2Mkm²! Either that or somebody miscounted some snow.) Matayoyo, Lazarus, whatever you’re calling yourself this week, take note: the long term trends claimed in your ridiculous article are well within the variation of a week in snow cover. Time to panic!
Maybe he meant late Spring, you know, that time of year when our precious ski resorts don’t guarantee they’ll be running, but whatever. Most of your western resorts are goin to be closed by May, so lets see if there’s anything frightening happening in climate then: Week 18! The lowest NH snow cover year is 2011 at 20.0Mkm² (it just noses out 1990 by 0.3Mkm²! Shocking losses, guys. Shocking.) & the highest is 1979 (again, not 1978, despite the massive snow cover in weeks 5 & 6) at 28.2Mkm².
Conclusion: Matayoyo is an idiot who can’t even read a NYT article well enough to figure out it’s patent bullshit.
Stark – In the western US, alarmists love to point out short-term trends in the size of the April 1 snow pack in the western mountains. If you look at the underlying data, you will see that this is at the peak of the spring snow melt and so very sensitive to small perturbations in when the snow melting occurs. Most of the difference is whether the melt has advanced a week or so into March. It’s the same thing as what you found globally.
I’m writing a new climate paper (to be pal reviewed) on the relationship between alarmism and foot in mouth disease. There is no doubt that FIM disease is rising exponentially with the profligacy of Hysteria (pH).
My climate theorem is this:
FIM = f(Alarmism pH)**2 + K x M x T (global)
K = the constant Kook
M = the variable Matayaya which is directly proportional to CO2 ppm.
T (global) = number of daily media releases from Alarmists
My grant just came through.
“The future ain’t what it use to be.”
-Yogi Berra
If you start with this winter, and wait until the first REALLY HOT day in the upcoming summer, then you have the ideal way to draw your warming trend-line! (and remember to ignore the sun’s diminishing output)
Should the post also include the a link to the “Our children just won’t know what snow is” prediction as a service to other readers who may not get the joke? http://www.independent.co.uk/environment/snowfalls-are-now-just-a-thing-of-the-past-724017.html
“However, the warming is so far manifesting itself more in winters which are less cold than in much hotter summers. According to Dr David Viner, a senior research scientist at the climatic research unit (CRU) of the University of East Anglia,within a few years winter snowfall will become “a very rare and exciting event”.
“Children just aren’t going to know what snow is,” he said.
Scratch the above. I had not seen the New York Times article. I always think of Viner when I hear the end of snow line which gets me laughing as a Pavlovian response to the phrase.
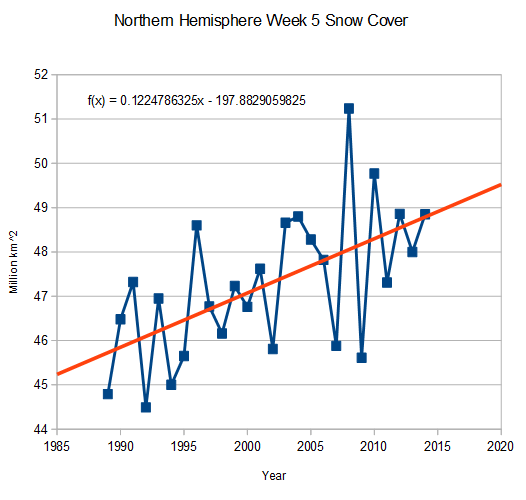
Looking at the data, you can also do this graph going all the way back to 1967 and have an increasing trend-line for each of the four areas monitored.
Specifically we see these for the first and last 5 years listed
Year … Week … N. Hemisphere … Eurasia … N. America … N. America (no Greenland)
1971 … 5 … 46.50 … 29.39 … 17.11 … 14.96
1970 … 5 … 46.95 … 29.94 … 17.01 … 14.86
1969 … 5 … 48.80 … 30.85 … 17.95 … 15.84
1968 … 5 … 46.14 … 29.23 … 16.91 … 14.93
1967 … 5 … 46.76 … 29.79 … 16.97 … 14.82
5YR Avg … 47.03 … 29.84 … 17.19 … 15.08
Year … Week … N. Hemisphere … Eurasia … N. America … N. America (No Greenland)
2014 … 5 … 48.85 … 30.20 … 18.65 … 16.50
2013 … 5 … 48.00 … 30.03 … 17.97 … 15.82
2012 … 5 … 48.86 … 32.80 … 16.06 … 13.91
2011 … 5 … 47.31 … 29.02 … 18.29 … 16.14
2010 … 5 … 49.77 … 30.50 … 19.27 … 17.1
5YR Avg … 48.56 … 30.51 … 18.05 … 15.90
That is overall growing 5th Wk snow cover everywhere for the past 48 years (roughly +0.5-2.0 for the annual 1967 to 2014, +0.5-1.5 for each of the 5Yr averages)
…and it doesn’t end there…
I also did the 5Yr Averages for the other weeks
1967-1971 … Wk 1 … 47.67 … 29.32 … 18.35 … 16.20
2010-2014 … Wk 1 … 47.67 … 29.51 … 18.16 … 16.01
1967-1971 … Wk 2 … 48.16 … 29.68 … 18.48 … 16.33
2010-2014 … Wk 2 … 47.89 … 30.13 … 17.76 … 15.61
1967-1971 … Wk 3 … 47.17 … 29.53 … 17.64 … 15.49
2010-2014 … Wk 3 … 48.69 … 31.04 … 17.65 … 15.50
1967-1971 … Wk 4 … 47.75 … 30.20 … 17.55 … 15.40
2010-2014 … Wk 4 … 47.97 … 30.59 … 17.38 … 15.23
1967-1971 … Wk 5 … 47.03 … 29.84 … 17.19 … 15.08
2010-2014 … Wk 5 … 48.56 … 30.51 … 18.05 … 15.90
All of that leads to
67-71 … Wk 1-5 Avg … 47.56 … 29.71 … 17.84 … 15.70
10-14 … Wk 1-5 Avg … 48.16 … 30.36 … 17.80 … 15.65
That doesn’t look absolutely anything like “The End Of Snow” to me. In fact, it looks like Snow Fall could straight give a crud about their perceived little “Catastrophic Anthropogenic Global Warming” theory – it has increased its overall reach in the Northern Hemisphere over the past 48 years (specifically increasing in Eurasia and staying steady in the N.America/Greenland areas)
Matayaya is such a “smart guy”, isn’t he?
The trend obviously shows more snow, steadily, but if you go to the 60’s-70’s, there would be similar highs then as we have now,
http://icecap.us/images/uploads/Screen_shot_2013-05-30_at_9.42.56_AM.png
The local peaks coincide with solar minimums, but of course, he calls fraud anything that doesn’t agree with the deception he’s promoting.
Winter snowfall extent in the Northern Hemisphere trending up since 1967.
http://climate.rutgers.edu/snowcover/chart_seasonal.php?ui_set=nhland&ui_season=1
Winter snowfall extent in North America trending up since 1967.
http://climate.rutgers.edu/snowcover/chart_seasonal.php?ui_set=namgnld&ui_season=1