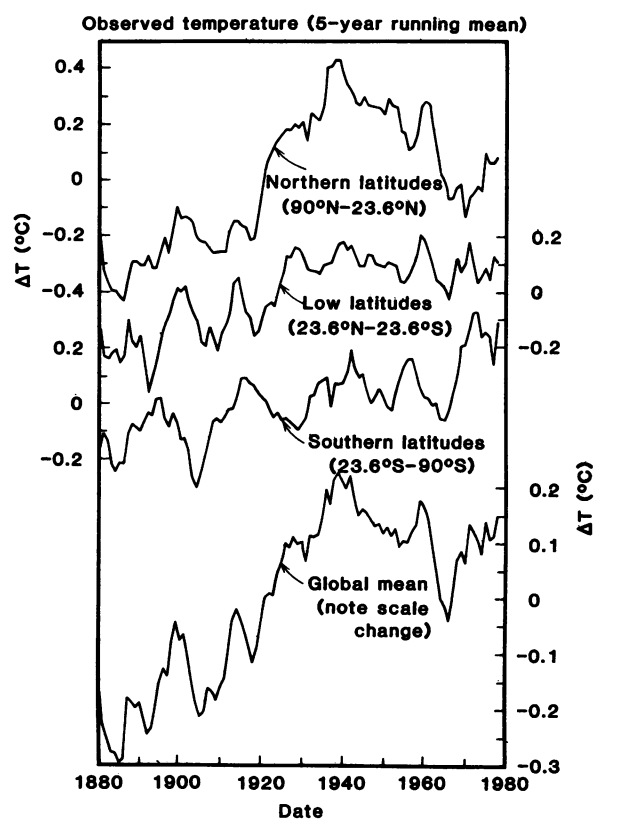
In 1981, James Hansen of NASA published these graphs of surface temperatures. Note that northern latitudes and global both showed 1940 as warmest, with a sharp global cooling to the early 1970’s.
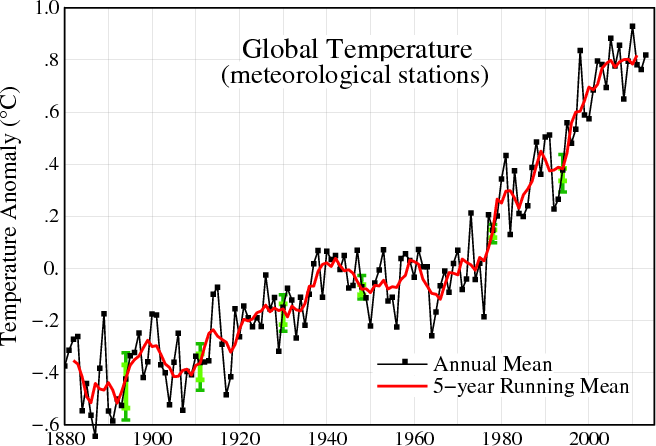
But the current NASA graphs don’t look anything like that. Global surface temperatures no longer show any cooling from 1940 to 1970.
Data.GISS: GISS Surface Temperature Analysis: Analysis Graphs and Plots
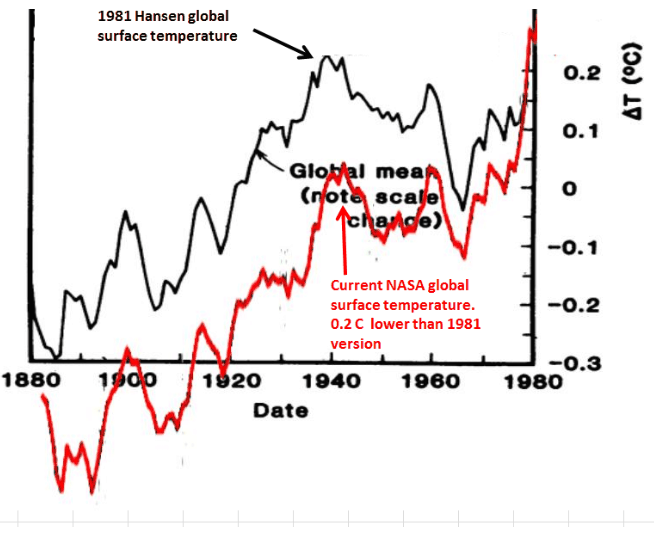
I overlaid current GISS global surface temperatures (red) on Hansen’s 1981 version. Hansen massively cooled his own pre-1980 data, and added a huge spike in 1979.
Also note that Hansen has nearly wiped out all of his own 1940-1970 cooling.
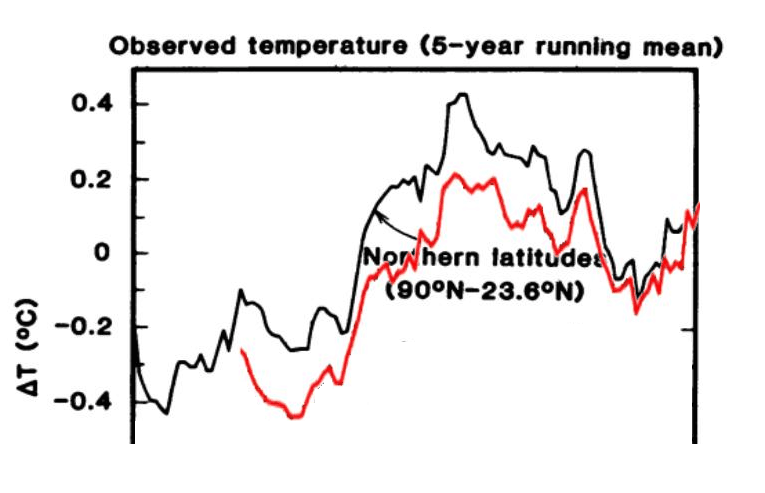
Now let’s look at just the 24N-90N temperatures, current data in red. Hansen has knocked 0.2C off his own 1940 temperatures. The shape of the data is nearly identical, but NASA now adds an increasingly larger cheat factor of cooling to progressively older data.
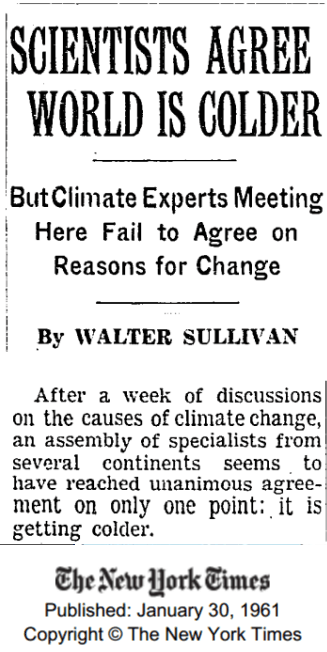
Everyone agreed about the post-1940’s global cooling at the time, including Hansen. But Hansen and now Gavin have deleted it from the temperature record.
Leading climate scientists discussed with each other how to get rid of the 1940’s warmth, which might have impacted their ability to extort taxpayer money.
From: Tom Wigley <[email protected]>
To: Phil Jones <[email protected]>
Subject: 1940s
Date: Sun, 27 Sep 2009 23:25:38 -0600
Cc: Ben Santer <[email protected]>

<x-flowed>
Phil,

Here are some speculations on correcting SSTs to partly
explain the 1940s warming blip.

If you look at the attached plot you will see that the
land also shows the 1940s blip (as I'm sure you know).

So, if we could reduce the ocean blip by, say, 0.15 degC,
then this would be significant for the global mean -- but
we'd still have to explain the land blip.
If the present refuses to get warmer, then the past must get much cooler.
* Mosher says this is all first rate science.


Cool research.
Thank you.
Climate fascism rewrite reality impose lies as facts. Control and command the peasants.
But Steve. What about the cause? He was only doing it for the cause. OUR cause. What’s a little data, a few numbers here and there…data, who cares about data….. when we have OUR CAUSE?
It’s a rubber teeter-totter.
I admire your courage, Steven, for calling a spade a shovel ! Pointing out when the force that controls Earth’s climate humorously exposes human arrogance.
Of the thousands of members of the UN’s IPCC, UK’s Royal Society, the US and other National Academies of Sciences worldwide, and the Swedish and Norwegian Nobel Prize Committees cited as part of the scientific consensus, . . .
Not one has challenged the data in Figures 1-3 (pages 17-29 of Chapter 2 of my autobiography) or the conclusion that the Sun’s core is a pulsar remnant from the supernova birth of the solar system.
https://dl.dropboxusercontent.com/u/10640850/Chapter_2.pdf
In the United States, NAS has operated like “a generation of vipers,” as a private, self-perpetuating organization that reviews the budgets of federal research agencies for Congress, with little or no limit on conflict of interest.
The climate scientist discovered a new critical variable to include in the analysis:
dT = f($$)
I’ve been searching for that mathmatical relationship and you had it all along!!
I submit that:
f(N sheeple) x f($$ carbon tax) x f(global carbon production tpa)
dT = f($$) = —————————————————————————————-
molar fraction of CO2 in atmosphere (i.e. 400/1,000,000)
Should equal OBF number!!
That is climate science in a NUT shell.
ROFL. Bloody spaces didn’t work. Anyway hopefully you get the picture.
dT = f($$) =
f(N sheeple) x f($$ carbon tax) x f(global carbon production tpa)
—————————————————————————————-
molar fraction of CO2 in atmosphere (i.e. 400/1,000,000)
What if the original research was wrong? Would you prefer it wasn’t changed?
Averaging out a bunch of thermometer readings isn’t exactly rocket science.
Are you seriously suggesting that the same generation who created the Manhattan project couldn’t read a thermometer?
You DO NOT touch the data. – Science rule number one!
There was a darn good reason laboratories used bound notebooks and the data was signed and dated each day with a second person witnessing the first signature.
If a change was made you draw one line through the data, corrected it with explanation, date and initial. It is exactly the same as for accounting.
Unfortunately with computers scientists have gotten very sloppy and this has allowed the present crap.
One of the biggest problems is NO data and NO method attached to science papers today. It has caused major corruption to the point that one journal is now demanding that the old method, no publication unless ALL data and methods included AND the statistical method for handling the data has to be approved by the journal BEFORE HAND!
(I was a lab manager /chemist before I retired)
You think average global temperature is just about reading thermometres? You think they don’t correct data in every single temperature record? What if a station breaks, do you just record a month of zeros? What if the transducer is wired backwards and records hot as cold? Just add it to the list because “under no circumstances touch the data”. What if someone builds an air conditioner next to a weather station and it consistently records 5 degrees higher because of the rejected heat? Add it anyway?
The stuff you are describing has nothing to do with the changes that have occurred since 1981.
I’m a skeptic. You are a blind defender of the faith.
What? what faith am I defending. I am describing how science is conducted and legitimate reasons to not include data points in a data set.
Don’t reply again please unless you are going to at least attempt to engage with the content.
I thought this my blog.
We did the Manhattan Project in the 1940’s. We went to the moon in the 1960’s. Do you actually think that James Hansen averaged invalid temperatures in 1981, and didn’t figure it out until after 2000?
The arrogance, ignorance and hubris of alarmists is astonishing.
How awesome of you to claim that my arrogance and hubris is astonishing with an incredible non-sequitor about the Manhattan Project. Sure thing mate, since some scientists invented the atomic bomb no one ever makes mistakes any more.
The changes that have occurred since 1981 have absolutely nothing to do with any of the obvious data errors you described. Do you actually believe that people are smarter now than they were in 1981? Quite the opposite.
That is why Anthony Watts and his volunteers decided to audit the US weather stations.
The Australians:
http://joannenova.com.au/2012/06/threat-of-anao-audit-means-australias-bom-throws-out-temperature-set-starts-again-gets-same-results/
New Zealand:
http://boballab.wordpress.com/2010/02/01/the-goat-ate-the-data/
Thanks Gail!
Interesting stuff on how compromised the BOM is.
And it used to be, with CSIRO, one of the most highly respected institutions in Australia. Sad.
Did somebody go back in time to find out what the real temperature was? If not, where is the evidence that the original measurements were wrong, or what the right ones were; and why did it take decades for anybody to notice the problem?
Hansen just wasn’t smart enough in 1999 to notice that the earth was heating out of control and having a planetary emergency. He didn’t realize that until a year later.
The bottom line evericket is that the “corrected” data has consistently only cooled the past and warmed the present. But don’t start rejoicing yet over the above ‘scientific’ concensus.
Not only science, but common sense (unfortunately all too uncommon today) should alert every person paying attention that such a consistent pattern of adjustments is statistically impossible.
I think someone should go through & edit your posts here to reflect the fact that you’re a moon-landing conspiracy nut. Because your original posts might be flawed if they don’t reflect that.
Gees, I wonder what happened around 1940 that might has spewed a whole heap of junk into the atmosphere, especially in the Northern Hemisphere, causing reflection of energy before it reaches the surface
The fact that the latter half of the 1900’s had a series of very solid solar peaks wouldn’t have anything to do with the small amount of warming from the 1970’s to 2000,, would it!.
Note that the alarmists are now trying to blame a quiet sun for the cessation of any warming since 2000, and for the start of the cooling.. well sorry guys., you can’t have it both ways.
I hope that some day, these guys get their comeuppance, and have all their ill-gotten assets frozen !
ps.. I think you will find that somewhere in Climategate 1 emails, Phil Jones made a comment about “getting rid of that 1940’s peak”… and lo and behold.. Giss and HadCrut.. peak all gone.
It must be pretty close to being criminal activity, especially if they received any sort of financial reward for that particular effort
“Phil, Here are some speculations on correcting SSTs to partly explain the 1940s warming blip. If you look at the attached plot you will see that the land also shows the 1940s blip (as I’m sure you know). So, if we could reduce the ocean blip by, say, 0.15 degC, then this would be significant for the global mean — but we’d still have to explain the land blip. I’ve chosen 0.15 here deliberately. This still leaves an ocean blip, and i think one needs to have some form of ocean blip to explain the land blip (via either some common forcing, or ocean forcing land, or vice versa, or all of these). When you look at other blips, the land blips are 1.5 to 2 times (roughly) the ocean blips — higher sensitivity plus thermal inertia effects. My 0.15 adjustment leaves things consistent with this, so you can see where I am coming from. Removing ENSO does not affect this. It would be good to remove at least part of the 1940s blip, but we are still left with “why the blip”.” – Tom Wigley, to Phil Jones and Ben Santer
http://di2.nu/foia/1254108338.txt
Thanks, I added it.
Ended up being well more that 0.15C though, didn’t it ! Something like nearly a WHOLE degree C after several CONsecutive adjustments.. (Steve would have the final actually adjustment calculated somewhere)
They got away with the first little adjustment, heck, why not just keep going until the whole peak is eradicated !
Helps sell the trend though, doesn’t it.
The really funny thing is, that because the warmist modellers accept it as ‘the truth’, they hindcast to an artificially created FAKE trend, so MUST always end up way over-estimating their projections. The only way any climate model has a chance to have any predictive accuracy is for them to hindcast to the un-adjusted data.
They are going to end up making massive fools of themselves, even more so than now.
ps.. sorry..
The SAD thing is that quite a few so-called skeptics also come up with things that match HadCrut or Giss pre-1979 ..
my initial reaction is .. sorry, you goofed. 🙁
hansen 1999
“The U.S. temperature increased by about 0.8°C between the 1880s and the 1930s, but it then
fell by about 0.7°C between 1930 and the 1970s and regained only about 0.3°C of this between the
1970s and the 1990s. The year 1998 was the warmest year of recent decades in the United States,
but in general, U.S. temperatures have not recovered even to the level that existed in the 1930s.”
http://pubs.giss.nasa.gov/abs/ha03200f.html
You can see that in this: http://www.sturmsoft.com/climate/suckling_mitchell_2000_fig2_3.gif
(look at the decades at 200X)
The Koppen system uses movement of plant boundaries to detect climate changes. The 1980s and 1990s are about in the middle of the pack. It is 1970s that is the ringer.
The middle of the continent is not going to show influence from the oceans either.
It is scary when government has already become that which Orwell predicted in 1984. They even have their sycophants that want to now rewrite science itself.
This is ridiculous analysis. And since you graduated from Engineering School, then you should know better and probably know that you are manipulating your readers. Both graphs are about CHANGE in temperature and neither vertical scale is absolute global mean temperature but a change in temperature. In Hanson’s 1981 paper the reference point (zero) was chosen to be the temperature in 1880. In the GISS graph the reference point is the mean temperature from 1880 to present. In the both cases the rate of change is the same which is what is being examined and so the reference point isn’t important and can be chosen to be anything you want.
Shame on you, Steven.
You have no clue what you are talking about
Oh, but Sixtwentytwo does know what he is talking about. The normalisation (baseline) of the red line in the 3rd chart is just plain wrong. Plus: you took the 5-year average including the years 1980-1982.5 and that causes the sharp spike up from 1978 onwards. And of course Hansen e.a. in 1980 were unaware of the temperatures from 1980-1982.5 – that is until you’d accuse them of being clairvoyant.
The baseline of the 1981 Hansen chart is the mean of 1880-1980. Adjusting the 2014 GISS data to that baseline, 1940 is still the maximum and at the same height as in the 1981 chart.