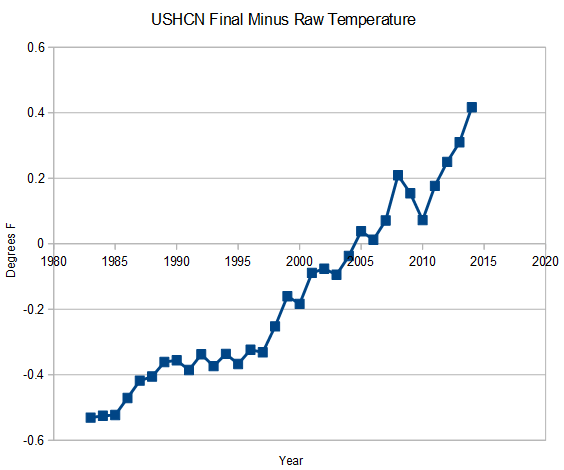
The FILNET adjustment is much worse than it seems.
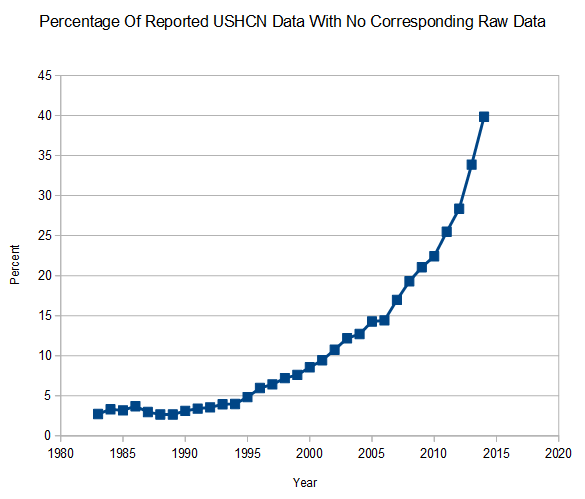
USHCN is losing station data a phenomenal rate since 1990, and they are filling in the missing data with temperatures higher than the station data which is not missing. The rationale for this would have to be that the missing station data was from stations which were warmer than average.
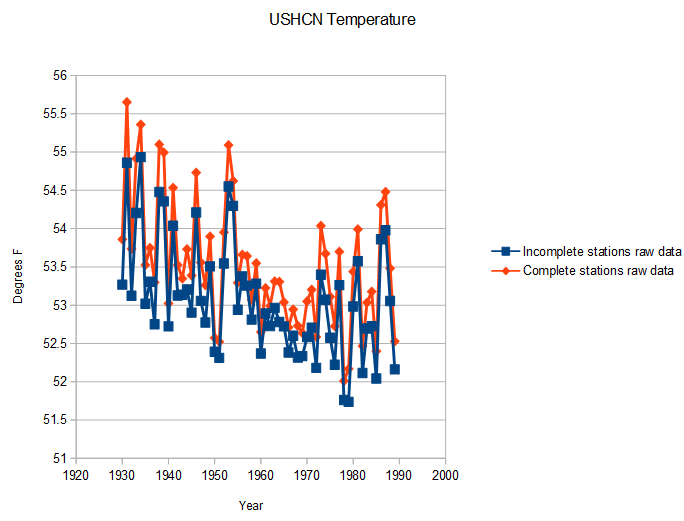
I put that to the test by comparing 1943-1989 data for stations which have missing 1990-2013 data, versus those with complete 1990-2013 station data. It turns out that the stations losing data are actually colder than the ones with complete records. So the FILNET adjustment is creating warming, when it should be creating cooling.
The big question is – is NOAA intentionally dropping colder station data, so that they can fill in fake warm data?


This is exactly what I’ve been wondering….. Since there are so many, what is the probability that all that missing data just happened to occur with the cooler thermometers? You may have landed on Climategate cubed.
Looks like more evidence of NOAA committing knowing fraud. So how will the CAGW true believers spin this, I wonder?
By the way, for anyone who says, “This does not PROVE knowing fraud — there may be some innocent explanation!” just ask yourself this: How many times does “innocent explanation” have to be invoked before it becomes ludicrous? Sure, any individual station adjustment to a warmer temperature might have an innocent explanation, but we have seen a long series of events, and the overwhelming majority seem to always cause warming to the record. People may argue about cycles and patterns in weather and climate — but one that that is unarguable is that there is a pattern for data to be lost, to be created from nothing, to be altered, to be mathematically mangled, and always with the result that the “climate scientists” tell us that “it is worse that we thought!” How many “innocent” plumes of smoke must be seen before the penny drops and a prudent person yells “FIRE!”
They don’t have to spin it. They can just ignore it.
Zeke and Mosher’s explanation should be comical. Cutting cold stations make so much sense when you are trying to find the “Climate Signal”.
It would be fun to see a chart graphing long term station average temperature vs probability of data going missing.
For what it is worth E. M Smith and Verity Jones did a whole bunch of posts on the subject.
Scout around this time frame (January 2010) in each blog.
https://chiefio.wordpress.com/2010/01/08/ghcn-gistemp-interactions-the-bolivia-effect/
http://diggingintheclay.wordpress.com/2010/01/04/climate-data-effects-of-station-choice-location/
http://diggingintheclay.wordpress.com/2010/01/21/the-station-drop-out-problem/
Thanks, Gail!
What would be the trend of “stations with complete data” be vs “stations with incomplete data”?
Stations with complete data during the 1990-2013 interval vs. those which did not have complete data during that interval
Yes.
How do the temperature trends for these compare over 1990-2013?
The complete stations warmed after 1990 and the incomplete stations cooled, but that may have been skewed by rapidly increasing data loss. It may also be a sign that their cheating is even worse than I thought.
FYI
https://sunshinehours.wordpress.com/2014/06/07/ushcn-2-5-how-much-of-the-data-is-estimated/
“For just California December 2013, 18 out of 43 are Estimated. The Estimated stations average 8.12C and the “Real” stations average 7.02.”
That’s great work Sunshinehours! How does one download that data? I’d like to do Arizona, New Mexico and Texas.
Never mind; I found it but thanks!
This is why 90% of NOAA’s future weather forecasts are wrong, often terribly wrong. Bad incoming data plus fake data=departure from reality. I have asked NOAA to apologize for grossly wrong forecasts. They won’t, of course.
Did the Met ever apologize? They had some numerically embarassing string of failures, all on the warming side natch.
I wonder if the Aussies apologized before the axe fell? That’s the only OECD government with a serious take on climate change.
Thanks for taking the time and effort to do these comparisons.
Maybe this is the long-last fingerprint of man-made warming. Truly man-made.
Whose fingerprints, and when will they be indicted?
that should be long-lost…
I like it! Truly it is ‘man made warming’. And fraud of a vast magnitude for $$$$$, thus actionable.
Sorry, can you explain the 40% graph? “Raw data” is easily understood (i.e. the value that was actually reported by a station), not sure about “reported USHCN data” which sounds like there is a list somewhere of values which purport to be from stations but are actually infilled data that was never directly recorded.
Does such a list exist (and can you link to it if so), or does this just fall out of their code?
Sorry, I see this was covered.
From the readme.txt file: ” ‘E’ indicates the data value is an estimate from surrounding values; no original value is available;”
Looks like the lists of values are at the bottom here.
http://stevengoddard.wordpress.com/2014/06/04/nonsense-from-both-sides-of-the-debate/#comments
Are 40% of those values really marked as E now? Seems easy enough to check.
OK, I think Steve means 40% of stations now have at least one missing recorded temperature. Will download and try later, time permitting.
40% of the monthly final data is marked with an E in 2014
Good Lord, that’s scary. Now I’ll have to verify that.
…OK, I’ve opened the files, looks like this is space or tab-delimited data, should be able to pull into excel pretty easily, but I’m tempted to write a parsing routine in Progress or something to hold all the data at once and play with it, it’s a pretty trivial effort, maybe an hour.
I can see the year in the format there… the files seem to be arranged such that each station has its own file. So I guess a script is definitely the way to go — specifically to validate/replicate your claim, looks like I want to pull the year 2014 from every file and look for the E.
The upside of a Progress script is that it’s 4GL and it’s relatively easy for nonexperts to understand what the script is doing, plus it has embedded database logic so you can do SQL if you want. The downside is that it’s a niche language that most people in IT have never heard of. SQL Server might be better, but DTS packages ugh.
Anyways I’ll probably try to do it tomorrow at some point.
OK… I wasn’t sure if all the values were in the right place so I checked… using space delimiter, there are zero 2014 lines that do not have -9999 in the 8th position. So the seventh value is always the final monthly value — at least, that’s my assumption.
I found 1,218 lines with 2014 in the second position. Of these, the value in the seventh position contained an E in 671 of them, or 55%.
So either it’s even worse than I thought, or I’ve done something wrong somewhere.
I’ll post code below.
OK, I think I see why I have a different number — when you said “40% of the monthly final data is marked with an E in 2014” I assumed you meant “the final month of 2014” but I think you actually mean “of all the months in 2014 that have been reported, 40% of them are marked E.”
Let me run that quick, it’s an easy change…
def var filenm as char format “x(77)”.
def var linedata as char format “x(77)”.
def var lineflds as char extent 57.
def var lv_delim as char.
def stream filestr.
def var i as int.
def var ctr_last_E as int.
def var ctr_lines as int.
def var ctr_bad_8 as int.
input through ls ushcn/ushcn.v2.5.0.20140609/*.
repeat:
import filenm.
input stream filestr from value(filenm).
repeat:
do i = 1 to 57: lineflds[i] = ”. end.
import stream filestr delimiter ‘ ‘ lineflds.
if lineflds[2] = ‘2014’ then do:
ctr_lines = ctr_lines + 1.
if lineflds[8] ‘-9999’ then do:
ctr_bad_8 = ctr_bad_8 + 1.
end.
if lineflds[7] matches ‘*E*’ then ctr_last_E = ctr_last_E + 1.
end.
status default substr(filenm,35,25) + ‘ ‘
+ string(ctr_lines) + ‘ ‘ + string(ctr_last_E).
end.
end.
disp ctr_bad_8 ctr_lines ctr_last_E (ctr_last_E / ctr_lines).
OK… so now I look at positions 3-7 and count them, and also count how many times ‘E’ appears in positions 3-7. I also counted the files just for fun.
So…there are 1,218 files, with 6,090 values for 2014, of which 2,620 contain an E, or about 43%.
?????????????????????????????????????????????
? ctr_files ctr_tot ctr_E ?
??????????? ?????????? ?????????? ?
? 1,218 6,090 2,620 0.43?
?????????????????????????????????????????????
Status of claim: validated. Or replicated, if you prefer.
Will append code below. Note that seems not to come across for some reason and all spacing is lost.
(greater and less than don’t come across because HTML)
def var filenm as char format “x(77)”.
def var linedata as char format “x(77)”.
def var lineflds as char extent 57.
def var lv_delim as char.
def stream filestr.
def var i as int.
def var ctr_E as int.
def var ctr_files as int.
def var ctr_tot as int.
input through ls ushcn/ushcn.v2.5.0.20140609/*.
repeat:
import filenm.
input stream filestr from value(filenm).
ctr_files = ctr_files + 1.
repeat:
do i = 1 to 7: lineflds[i] = ”. end. /*clear variables*/
import stream filestr delimiter ‘ ‘ lineflds.
if lineflds[2] = ‘2014’ then do i = 3 to 7:
ctr_tot = ctr_tot + 1.
if lineflds[i] matches ‘*E*’ then ctr_E = ctr_E + 1.
end.
end.
status default substr(filenm,35,25) + ‘ ‘
+ string(ctr_files) + ‘ ‘ + string(ctr_tot) + ‘ ‘ + string(ctr_E).
end.
disp ctr_files ctr_tot ctr_E (ctr_E / ctr_tot).