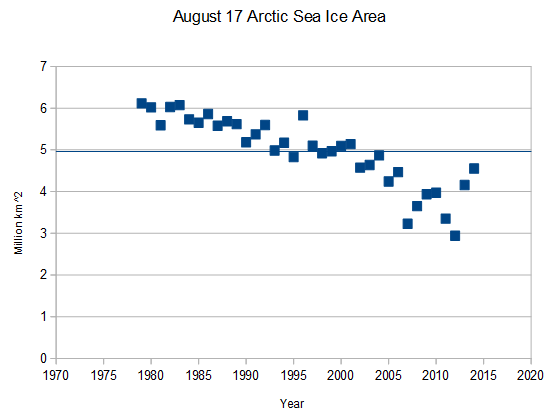
August 17 Arctic sea ice area is the highest since 2004.
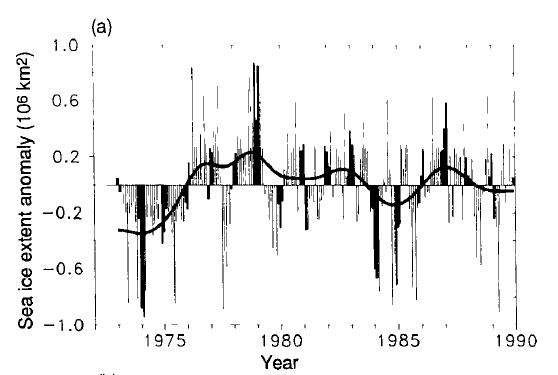
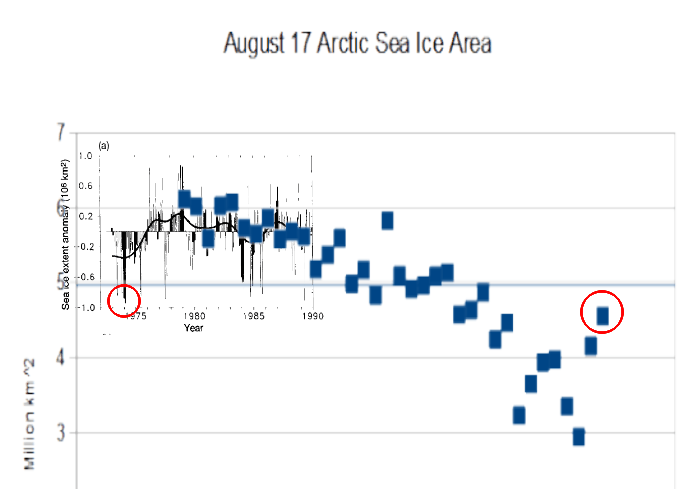
But it is worse than it seems. Arctic data is cleverly cut off at the 1979 peak, but the 1990 IPCC report showed that there was much less ice in 1974 than in 1979.
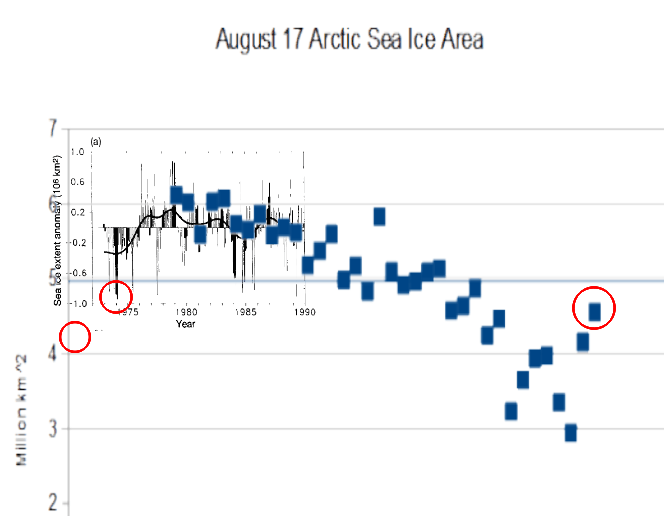
So I overlaid the current data on the 1990 IPCC graph, and it turns out that ice coverage now is similar to 1974.
Reports from 1974 also indicate that there was 12% increase from 1971 to 1974.
Another Ice Age?
Monday, Jun 24, 1974Climatologist George J. Kukla of Columbia University’s Lamont-Doherty Geological Observatory and his wife Helena analyzed satellite weather data for the Northern Hemisphere, they found that the area of the ice and snow cover had suddenly increased by 12% in 1971 and the increase has persisted ever since.
TIME Magazine Archive Article — Another Ice Age? — Jun. 24, 1974
So I drew another circle approximating 1971 conditions. It is possible that there is more ice coverage now than in 1971.
This is just a very rough comparison, as it is comparing extent vs. area. But it shows the cyclical nature of Arctic ice, as opposed to the mindless linear trends published by NSIDC.


No one knows this I would suggest a sticky post herein LOL
Something from the past now in summer.
http://news.sky.com/story/1320184/blast-of-wintry-weather-hits-parts-of-britain
‘The Met Office has issued severe weather warnings for northern England and Scotland, with Ireland also likely to be affected by gusts which “would not be unusual in the autumn and winter”.
Low pressure over Scandinavia is drawing cold Arctic air across Britain and Ireland with a breezy northwesterly flow.
Met office spokesman Calum Maccoll said there could even be frost in parts of Scotland as temperatures approach zero later in the week.’
http://www.noodweercentrale.nl/de/wetter/profiwetter/stroemungsfilm/europa.html
Very cool animation of how Norway’s mountains force the winds beneath and up the Baltic to the south coasts of Sweden and Finland. Quite the North Sea gale, considering it is still summer. Thanks for sharing.
Thanks Steven.
Nice to see some honest work done in highlighting what is realy happening in the Arctic.
Pity the so called scientific establishment can not do the same.
+1
So you’ve taken the lowest anomaly from 1974 and compared it to the highest anomaly of today and this is supposed to mean something? The trend is unmistakably down on every chart. Global scientists think in terms of much longer expanses of time rather than a single “off” year.
Listen here, mush for brains…
Fact A: 1974 had less ice than 1979. 1979 was a peak year. Of course the trend is ‘down’ from that…just like from 1974 to 1979 the trend was ‘up’.
Fact B: 2013 had more ice, at minimum than 2012. 2014 is shaping up to meet or beat 2013. No, 2 yrs doesn’t make an ‘official’ trend…but it does bear watching because it sure as hell isn’t ‘no ice’.
BTW the trends don’t become trends until they are several individual years doing the same thing in succession.
You really do need remedial work. 1974-79 was an anomaly of 4 years, not a trend. ’79-’02 (a period of 33 years!) is a trend. What we have now is another anomaly. It may last a few years or end next year. In case you’ve forgotten here is the definition of anomaly:
a·nom·a·ly (-nm-l)
n. pl. a·nom·a·lies
1. Deviation or departure from the normal or common order, form, or rule.
2. One that is peculiar, irregular, abnormal, or difficult to classify:
Before you attack anyone’s brain supply, make sure you have enough of your own.
Your thought process is an anomaly from sanity.
That’s funny, Steve, but you haven’t rebutted my comment.
Actually, there is ‘no data’, before 1979, so there can be no anomaly, either. The ‘official’ record starts in 1979. But unofficial data shows that the 20 yr period BEFORE 1979 was a definite trend of increasing ice.
And, IF that had been decreasing instead of increasing…4 to 10 yrs would most definitely be a trend…
Your define anomaly as anything which deviates from your preconceived notions..
Reality = Model + Anomaly
As Anomaly = temporary, in the long run we get
Reality = Model
Therefore the climate models get more correct the more we look into the future
DirkH…you’re not being serious, right?
Because I sure hope you aren’t that blind.
It is August 17, near the peak melt of the year. I hope you aren’t as stupid as you pretend to be.
We are probably less than 30 days until the Arctic “turn-around”. So Fish, better start thinking about you can “deny” the soon-to-be growth in sea ice.
Is “fish” the reincarnation of Reggie?
Even the very low levels of 2007, 2011 and 2012 could be explained by considering ocean cycles and the fact that the AMO has been in a strong positive mode recently, possibly more than in the previous two recorded oscillations,
http://upload.wikimedia.org/wikipedia/commons/thumb/1/1b/Amo_timeseries_1856-present.svg/672px-Amo_timeseries_1856-present.svg.png
including the detrend due to the warming of the XX century.
OTOH, in the early 1970’s both AMO and PDO were in very negative mode,
PDO:
http://jisao.washington.edu/pdo/img/pdo_latest.jpeg
therefore, despite the similar position in the various cycles the ice should be a little more stable in the 70’s than now.
Note how the late 30’s and early 40’s had both AMO and PDO positive, coinciding with the many reports that Steve posted here about very hot 30’s in the US and “warm years” in the Arctic during the WWII period, reported in other websites.
From the graphs I’d guess that the Arctic ice was even lower than 1971.
The AMO graphic of your first link IMO the 1930 till 1990 shows more warming than cooling.
The recent warm period (~1990-present?) has dumped the accumilated heat very fast, and looks like it has just about finished. Note how the recent warm period has been shortened so will the rest of the cycle (cooling) be longer (35 years or more)?
I agree, the present warming phase seems shortened in comparison with the previous ones and probably setting the stage for a longer than usual cool period when the oscillation definitively flips into negative mode.
Note also how the first “positive” AMO was sort of mixed with colder modes during the entire period, I believe this could be due to the relatively low solar cycles of that time.
One thing that I cannot understand though is why the meteorologists cannot see the quite obvious connection (IMO) with solar forcing.
I believe more meteorologists use the information but don’t let on to ensure employment.