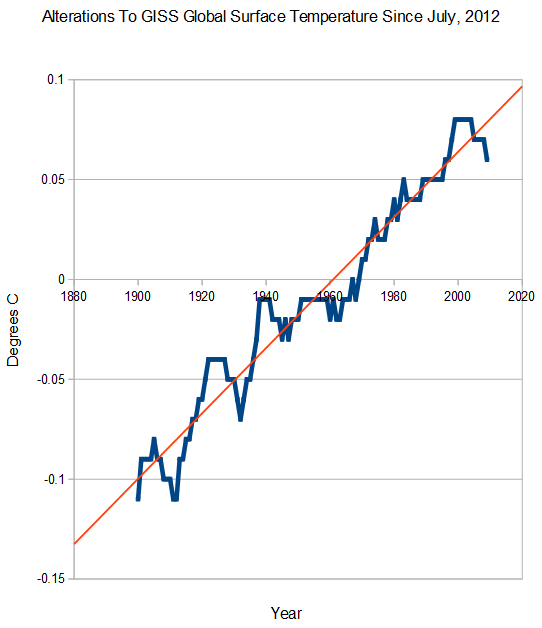
The graph below shows alterations to the GISS global surface temperature record, just since July 2012.

web.archive.org/web/20120724222431/……..Fig.A.txt
data.giss.nasa.gov/gistemp/graphs_v3/Fig.A.txt
The graph below shows alterations to the GISS global surface temperature record, just since July 2012.

web.archive.org/web/20120724222431/……..Fig.A.txt
data.giss.nasa.gov/gistemp/graphs_v3/Fig.A.txt
http://www.youtube.com/watch?v=zr_oXbLstyo
This is a fun read : An assessment of the NASA GISS urbanization adjustment method :
http://oprj.net/oprj-archive/climate-science/31/oprj-article-climate-science-31.pdf
Sure glad they identified and adjusted for that ‘urban cooling’ problem. Nice work there boys!