
I’ve been suspicious about sea surface temperatures since the bizarro Unisys incident a few weeks ago, when they suddenly replaced cold North Atlantic temperatures with warm ones, based on a completely incoherent explanation.
The claims of record 2014 heat are based on sea surface temperatures, which don’t make any sense. Look at the strip between Greenland and Iceland – they show sea surface temperatures about 6C above normal

Now look at the sea ice map. Ice extends all the way from Greenland to Iceland – far above normal.
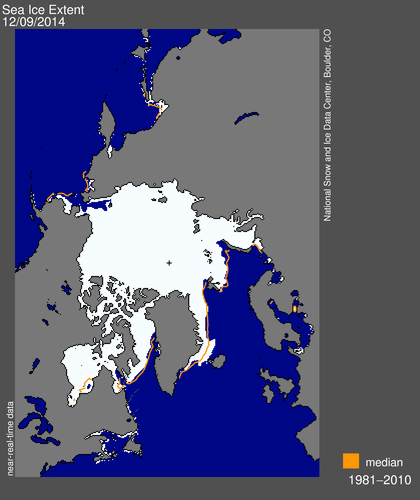
It is simply not credible that the seas between Greenland and Iceland are 6C above normal, and have excess ice. The excess ice indicates that sea surface temperatures there are below normal. Something is seriously amiss.

You just seeing this now? My face is Blue for a long time.70+% of world is covered with water and 70+% more influence on monthly climate maps. Noaa also just changed the climo period from 1951-1980 to 1961-1990 Dec 1 if you have not noticed. 1961-1990 was a colder period with the AMO.
http://polar.ncep.noaa.gov/sst/ophi/ click on bottom map to get closer.
Unisys relies on NOAA data. That would be the second most corrupt organisation in the world.
Nuff said.
Seriously wrong. The west coast of Alaska is ice, as is almost the entire arctic and Hudson Bay. They should be gray. They are instead, various shades of warm, not gray.
I also see positive anomalies in the antarctic ice. They could be giant leads, but I think not….
Les, everything north of Alaska is covered in yellow ice……..
Must be from the polar bears. More polar bears = more polar bear urine = yellow ice.
Rotten, young ice! 🙂
I see 2014 warmest year ever, in the same light as you can keep you insurance, you doctor and save 2500.00 a year. Here a song that tell it all we need to know about our current government and the people who are in it and run it! https://www.youtube.com/watch?v=rcjpags7JT8
Another crock of shit… Sea Ice wouldn’t be forming in 2014 at such a rapid pace were Ocean Water Temps 6 Degrees above Normal.
This is another Fraud… anyone on Land knows its been an exceptionally cold 2014 …. winter.. spring and summer were very cold in most places on land… thousands of “Coldest Ever” records set across America at USHCN Stations…
Yet these folks have the nerve to lie amidst the obvious? They’ve been busted with Data Fraud on Land … so now… they move out to Sea… what a joke, laughable were it not so serious….
awww come on now Phil, ‘everyone’ knows that’s just ‘weather’, not climate [*smirks behind hand*]
I can’t see them weaseling their way out of this one, unless the freezing point of water has changed by a few degrees.
“Something is seriously amiss.”
It’s called “desperation.”
A side note: My comment show the time posted as 12:31 AM, 12/11/14. I’m in Texas, it’s about 6:35 PM 12/10/14. Tony, you working from London, England these days?
WordPress uses GMT
I remember your posts about the sea surface temps, (and bob tisdale’s I think?) rebuttal but the amount of difference you guys were talking about didn’t seem like it was within any amount of reasonable error. Seems very fishy.
Libtards is not a solely amerikan phenomena…. scandinavia is crowded with such peoples and were they cluster you see and here the most stupid things…
Maybe that is where they stashed the diamonds from the diamond heist.
There has been a big storm with +100km/hr winds wander through that area over the last couple days. I suspect that the clouds, wind and waves have made some of the measurements go crazy.
The persistent errors in the reported SST anomalies and the regions covered with ice is a consistent problem. For example: The arch. is currently ice covered with vast areas of fast ice and the SST are shown as above average. Bogus. Similarly, other hot spots have shown up on some of the SST plots and can be traced back to a single unreliable sensor; but the model diligently smears the bad data across large areas.
The CT area plots consistently omit areas with new ice visible in the satellite images.
The HYCOM model data consistently shows ice moving through regions that are covered with fast ice.
There is a new SST analysis, the Group for High Resolution Sea Surface Temperatures (GHRSST) which uses as much data as it can get its hands on including all the satellites capable of analyzing ocean temperatures and the numbers produced by all the different SST datasets.
An ensemble mean is then produced and compared to the NOAA’s OI climatology (which I note as an aside has been changed in some manner in the last few years so that it is no longer accurate – it is deliberately low in the northern hemisphere and is even lower in the summer months).
But nevertheless, the GHRSST ensemble mean versus the NOAA climatology shows that something funny happened across much of the high north Atlantic in the last several days. Perhaps storms, perhaps fakeness. Animation of the last seven days.
http://ghrsst-pp.metoffice.com/pages/latest_analysis/sst_monitor/daily/ens/anim/ens-ncep_gbl.gif
This link might provide at really high resolution zoom-in to the area next to Iceland (I’m not really sure it will work).
http://ghrsst-pp.metoffice.com/pages/latest_analysis/sst_monitor/ostia/anom_plot.html?i=31&j=2
Bill, there is no way that Europe is surrounded by warm water. Europe is currently getting plastered with storms and cold.
I listed the events at the bottom of this comment
Something is seriously bogus with SST.
The NCDC/NOAA have deliberately changed the SST climatology. So 16.0C SSTs are normal for some particular ocean area at this time of year, but they have changed it to 15.5C so that the anomaly is now 0.5C higher.
Climatology is a very simple basic calculation that any high school student could do. Given how much off the NCDC/NOAA climatology is off now compared to the actual SSTs recorded in the 1970s, 1980s, 1990s, and 2010s, (which is what their “base period” is supposed to be), there is no way a simple “mistake” could have happened given how simple this calculation is.
It’s not warm water. It is water warmer than the average from their defined base period at the same time of year. The color tells you how much higher. Red in the arctic (for land) can still be -30C. Orange for sea surface may just mean some water a degree warmer than normal was pushed in from somewhere else by a storm.
Which is why the colored maps make such great tools to “prove” global warming. If the actual temperatures where posted, it would be obvious that it’s still cold. As you note, this just means the water may be warmer due to ocean currents, etc. The map really does little to make this clear.
Europe as a whole has been pretty warm this year. No doubt about that. I live in the CET region and I have no problem accepting that the 300 year CET record may be broken in 2014. In the past week or so the weather did turn a bit colder but this seemed to be due to air arriving from the colder continental land mass. It’s true that the weather has turned stormier particularly along western, Atlantic-facing coastlines in the last day or two but I wouldn’t say it was particularly cold. Some places have seen snow but it doesn’t seem to be hanging around. .
Denmark’s DMI also has a 30 day animation of this GHRSST product but they are using a different climatology than the NOAA is using now. They are using the Pathfinder satellite climatology from 1985 to 2001. It looks very similar to the above but they do not have the unusual high SSTs pattern in the high north Atlantic.
You have to use the buttons options to change the map to global SST anomalies because default is the Baltic SSTs.
http://ocean.dmi.dk/satellite/index.uk.php
Interesting
DMI is also showing ice around the bulge on the east side of Greenland where UNISYS shows hot temperatures.
Agenda=propoganda.
Amazing work Bill, well done.
+1
Also look at the long red streak along the east coast of North America. NO WAY.
Meanwhile, at 1214 am EST it is raining heavily across northern Maine and Nova Scotia. Earlier there was a rain band along the seaboard nestled against that snow. So that part of the chart may be correct.
Bolungarvik Dec Tmax climatology is +3C. Here is the 1-4 day weather forecast: http://www.weatheronline.co.uk/Iceland/Bolungarvik.htm
Yes, it is snowing here in NY state. The coast is getting mostly heavy rain.
This has been a miserable cold 15 months so far with one month, late September to early October, that was warm…warmer than summer which was very cool.
The wamists have gone quite mad. They can make all the charts and graphs and claims they want but the people shivering to death will turn on them eventually. The sooner, the better. Brrrr….this is one cold November and December!
Cryosphere today isn’t showing ice go all the way to iceland.
http://arctic.atmos.uiuc.edu/cryosphere/NEWIMAGES/arctic.seaice.color.000.png
And that goes back to 2008, when I discovered that they don’t show ice below 30% concentration. They still haven’t fixed their scale after six years.
The NCEP anomaly map has been showing warmer than normal temperature in the N.E. Atlantic for some time…
http://www.nhc.noaa.gov/tafb/atl_anom.gif
DMI ocean anomalies show the entire central Atlantic and S. Pacific colder than Unisys
http://ocean.dmi.dk/satellite/plots/satanom.gbl.d-00.png
in particular, the warm region between Greenland and Iceland is displaced NE, to the north of Iceland, and more coherent with the Arctic ice of NOAA’s map.
The hot regions on both coasts of US, and at the coasts of Uruguay and Argentina, are also present, but have different intensities, probably due to different periods used as basis for the averages.
These four regions have been warmer than average for many months.
A possible explanation is that they could be related with the (mild) El Nino, that still remains a little positive. In fact, the intense red at Iceland in the DMI map seems to be fading in the last couple of weeks, and the yellow of the ENSO region also seems less intense, probably indicating the beginning of its reversal into La Nina mode.
I believe DMI sst anomalies have been more reliable than Unisys, since the glitch of a few weeks ago.
Note that the ice in Alaska and N. Canada is also present in the DMI graph, while in Unisys it’s partially “yellow” (rotten! 🙂 ).
What I’d like to know is how they are going to hide the ice once the polar bears start walking to Iceland.
Until polar bears start walking to Chicago they’ll figure a way out. LOL
The Dust Bowl was not acknowledged until the dust cloud hit Washingon, DC. Head in the sand behaviour is not new. Though you appear to be sarcastic, you’re probably right. It will take a month of ice to Florida before anyone will begin to admit there MAY not be warming.
I saw a Black Bear booking it down the commuter rail right of way headed towards Boston. I have always wondered if he arrived….
They don’t have to walk there Tim. In 2008 the first PB in 15yrs turned up in Iceland after swimming about 200km and was promptly shot by wildlife officers.
Tim, Polar Bears have come to Iceland. Two of them came about 6 years ago — one at a time. They were promptly shot and killed by the authorities.
Very pragmatic, those authorities!
Polar bears ride the ice floes down the eastern side of Greenland to Iceland, and come ashore in the north. There they raid the stock and are shot by angry stockmen, according to what I have read.
So what if the ‘anomaly’ is 2-6 C ‘high’…what is the ACTUAL temperature? Especially when mucking around with the baseline.
Will you survive more than a few minutes if dumped into the area that is so ‘hot’?
http://www.dmi.dk/hav/satellitmaalinger/havtemperatur/
Around +6 degrees!
North Atlantic current in contact with air temperatures cools efficiently.
Dubious practices will continue for as long as those producing dodgy data are allowed to self-certify their output. The lack of external & independent policing to whom these people can be held professionally accountable in the event of malpractice is an open door to propaganda and outright fraud, and surprise surprise, that’s precisely what we’ve been seeing for years.
To compound the treachery the refusal to act goes to the very top of the greasy pole.
+100
“Now is the winter of our discontent.” 😉
“And all the clouds that lour’d upon our house
In the deep bosom of the ocean buried.”
That’s how they get all that heat into the ocean!
“Made glorious summer by this son of York”
Old Bill knew a thing or two.
Would that son of York be Bloomberg. {:>D
There is no excess ice around southern Greenland, it’s a false positive signal caused by the monster storm currently in the area. Areas of choppy water frequently show up as false low-concentration ice – anyone like Steven who regularly looks at the data should know this.
Go here and look at the images for 9th Dec and click through the various wavelengths – it’s pretty easy to see what’s ice and what isn’t. The data set will get cleared up in time when it’s manually curated, but the automatic algorithms used for the near-real-time data have some problems with thick cloud and choppy water, particularly in combination.
http://www.ijis.iarc.uaf.edu/cgi-bin/seaice-monitor.cgi?lang=e
Norwegian chart, shows ice and actual sea surface temps, updated daily Mon-Fri
http://polarview.met.no/regs/general_20141210.png
Until we get rid of “data” designed to look like a kindergarten coloring book, it’s going to be difficult to know what is going on. Colored maps are the simpliest way to convey an idea and avoid any problems with the actual data being examined. Those maps are the biggest propoganda tool out theres.
This is interesting. I’ve wondered why the real reason why we haven’t had strong Atlantic hurricanes the last few years is that Atlantic waters were cooling instead of warming. Do the satellite measurements show this?
Bob Clark
Remember the oceans are a HUGE heat sink and therefore take a long time to respond to changes. One change you can see is the lack of strong El Ninos after 1998. A quiet sun supposedly means more La Ninas. Time will tell.
The first thing that needs to happen is that the oceans actually need to stop accumulating heat and there appears to be no evidence for this at the moment. The fact that strong El Ninos have become less of a feature since 1998 is a bit of a concern since, however you look at it, there hasn’t been an associated decline in global temperatures.
It looks very much to me that we are in a cold ocean cycle phase similar to that experienced between 1945-75 – but without the cooling. I’d be willing to bet that the next movement of global temperatures is upwards.
You are forgetting where the oceans get their heat. During solar minimums the UV drops, and cycle 24 has been very anemic as REN has been showing.
http://www.klimaatfraude.info/images/sverdrup.gif
Also the amount of out going radiation changes with the temperature of the earth and that has been measured from space.
Temperature Dependence of the Earth’s Outgoing Energy
” You are forgetting where the oceans get their heat. ”
I’m not forgetting anything. I am merely stating the fact that the oceans are continuing to gain heat.
Re: your link. Yes we know there is a correlation between temperature and OLR,. The real question, though, relates to the imbalance between incoming solar radiation and OLR. If energy is continuing to accumulate in the oceans while surface temperatures remain broadly the same then it suggests there is an imbalance.
I truly do not understand why it is assumed/believed that the earth’s energy budget should balance. For all of history, the earth has warmed and cooled. Where’s the balance?
So you are claiming the current imbalance is part of a natural cycle. Fine – that’s possible but the sun is claimed by many to be a driver of these natural cycles and the sun, currently, is in a slump.
Why must people immediately jump to the “the sun is claimed to be”. I didn’t make that claim. I made no claim at all as to what caused the imbalance. I asked when the earth’s energy budget was in balance. You didn’t answer that question for me.
Reality check
Ok. The imbalance is due to natural variability and has nothing to do with the sun.
More than 25 years ago a few scientists were predicting that the earth would warm. They happen to have been right. It could be down to luck – who knows – but it has warmed. Lots of scientists disagreed with them. They were wrong. Now we can argue that warming has not been as steep as predicted by, e.g. Hansen, but I’m not sure it’s fair to criticise Hansen too much because he over-estimated the warming.
Since AGW theory predicted warming and we have had warming – which hasn’t been followed by cooling – I think it’s reasonable to consider the possibility that the increased
CO2 in the atmosphere might be responsible for the warming and to give some thought as to how this ply out in the future.
The energy imbalance is key to answering these questions.
Except there is no “energy imbalance”. Warming is due to increased insolation.
John Finn says:
“I’m not forgetting anything. I am merely stating the fact that the oceans are continuing to gain heat.”
>>>>>>>>>>>>>
Obviously I did not make it clear .
1. Visible light penetrates to 10 meters
2. UV light penetrates to 100 meters.
This energy warms the ocean.
OK I think we agree on that part.
#2. The visible and especially the EUV have dropped in strength during the minimum between cycle 23 and cycle 24 AND HAS NOT RETURNED to the levels of cycle 22 or Cycle 23. This means LESS heat is going into the oceans so long term the oceans will cool.
Solar cycle 24 is ‘unusual’ compared to the other cycles observed since the satellite era. In 2009 (at the minimum between cycles) NASA’s David Hathaway said “This is the quietest sun we’ve seen in almost a century.”
So cycle 24 started out in a deep minimum.
This change in the UV/EUV affect ozone and the oceans.
A round-up of the possible mechanisms of solar effects on the climate: Solar Changes and the Climate Note that flares and other features of the sun also affect earth’s climate.
This means LESS heat is going into the oceans so long term the oceans will cool.
But – the OCEANS ARE NOT COOLING. They are WARMING.
If there is less heat going in to the oceans then (since the oceans are warming) there must be less heat leaving the oceans and lost to space. In other words we must have an imbalance between incoming solar energy and Outgoing LW energy.
No, The MAPS are ‘showing’ warming after the Argo data was adjusted.
A NASA article by the same Josh Willis in 2007
NASA: Correcting Ocean Cooling
There was a follow up paper in 2009 by:-
“In Situ Data Biases and Recent Ocean Heat Content Variability” – Willis et al. (2009)
The important point here is that the ARGO corrections had already been done as described in the 2007 paper when Willis admitted the “slight cooling” in the NPR article in March 2008!
However, if we look at the ARGO data as it is presented in 2011 by NOAA, the “slight cooling ” from 2003 to 2007 has been replaced by a slight warming.
https://tallbloke.files.wordpress.com/2012/02/20k62yq.png
Yet an earlier graph showed the cooling:
https://tallbloke.files.wordpress.com/2012/02/loehle_ocean_heat_content.png
NONE of the data I have looked at in Climastrology has been free of the ‘Adjustments’ needed to MAKE the data go along with the political rhetoric. The last was Svaallgard ‘Adjusting’ the sunspot records to get rid of the pesky Modern Grand Solar Maximum.
Oh, and the political rhetoric has become abundantly clear.
We need a world wide COMMUNIST TOTALITARIAN GOVERNMENT to protect the environment. We need to reduce the middle class back to the level of poor serfs.
There are plenty of quotes out their from the elite who are making a power grab to back that statement up.
And do not forget Communism’s contribution to Science – Lysenkoism. Climastrology is just another version of Lysenkoism being used to drive people back into serfdom if not slavery.
Again, I did not say it has nothing to do with the sun. Please stop making things up when responding. See: “I made no claim at all as to what caused the imbalance.” The discussion will be easier if you actually read and pay attention to what I write.
Yes, 25 years ago a few scientists were predicting warming. If you are saying that a lot of scientists disagreed that it would warm, then yes, those scientists were wrong. It is perfectly fine to criticize Hansen for overestimating–it indicates a problem with his models/hypothesis/theory. When the predictions do match reality, one MUST criticize the science. It would be wrong not do so.
Again, I made no claim as to what caused the warming and you have not answered my question. No where did I state that CO2 could not be responsible. Also, “might” is irrelevant—is it how probable something is that what we need to know. There are many, many things that MIGHT cause the warming.
So–back on track:
When was the earth’s energy in balance?
Until you answer the question, I am finished responding to you.
There are many, many things that MIGHT cause the warming.
Name 5 of the “many, many things”
Landscape changes, wind patterns changing, ocean currents changing, reflectivity of the earth’s surface, lack of volcanic eruptions. (You asked for what “might” be involved. I am NOT saying any of these are the sole cause or even partial causes, though several are acknowledged as factors in climate. There is no single factor in climate that has ever been identified. Climate is a combination of factors.)
Changing wind patterns cause regional changes, i.e. some regions get warmer some get cooler. Earth’s net energy budget doesn’t change. Actually I’m not sure why I’m responding. The best 5 causes you’ve come up with are either totally irrelevant over the relevant time period or they have no affect on the incoming/outgoing energy balance.
The only thing you mention which COULD be of interest is “reflectivity of the earth’s surface”. Ok – you fail to show how this might have taken place but we’ll let that pass. It is possible – just possible – that cloud cover has changed over the past century or so, but even that wouldn’t affect the energy balance since more solar energy would be reflected.
Volcanic eruptions – maybe – but we’ve had periods of low volcanic activity before and not seen the warming of the past 30 odd years. The effect of volcanic eruptions is no more than a couple of years anyway.
I am NOT saying any of these are the sole cause or even partial causes,
Good – because, if you were, I’d ask you to provide just a smidgin of evidence to support your case. Meanwhile we do know, from emission spectra plots, that CO2 does absorb LW radiation emitted from the earth’s surface and we do know that as CO2 accumulates in the colder, drier regions of the upper atmosphere that the rate of emission to space will slow.
If you’re going to have a bet on a horse in this race – I’d go for CO2.
John: I’m in the habit of betting on losers, so no bet on the CO2 explanation.
Interesting that you still fail to understand the meaning of the word “might”. It means that it is POSSIBLE, not PROBABLE and you specifically asked for things that MIGHT. Then you try and rip my answer apart as “irrelevant”. It’s time to go to my standard response for people who tell me my information is “irrelevant”.
John, you are now irrelevant to me.
We’re in the skinny portion of a planetary historical condition (aka an inter-glacial period), and the states, conditions and stimulus that occur in set cyclical timeframes which switch our climate are unknown. The abrupt changes from inter-glacial to glaciation and back again continue on and a trace lagging greenhouse gas would have to be categorized as a “major contributor” (at least 11% of the volume), before the working hypothesis of AGW to be true.
The CAGW true b’llver brethren’s LAST HOORAH before the 2015 Paris Fiasco !!
in every Ponzi Scheme the critical factor has to keep increasing to support the lie, in this case the temperature data
So–back on track:
When was the earth’s energy in balance?
The point is the earth climate system will attempt to achieve a balance. If we get more energy coming in than going out then the earth will warm – and it will continue to warm until a balance is re-established. Similarly, if we get less coming than going out the earth will cool.
The earth’s energy must have been in balance sometime between the cooling/warming crossovers. .
Until yonswer the question, I am finished responding to you.
Suits me since your point is irrelevant.. We appear to have an imbalance now despite reduced solar activity. You might not think this is important but Gail Combs and lots of others do. This imbalance cannot always have existed else the oceans would be much warmer than they currently are.
No, the ocean would not have always been warmer than it is now. You are assuming that the imbalance would have always been in the warmer direction for that to be true. But the imbalance can go both ways. You correctly stated that it was in balance “somewhere between the crossovers”. That is my point. There is no magical energy balance—it changes over time whether humans are involved or not. If we cannot explain why it happened without humans involved, we can’t know if humans are affecting it or not. It’s straight out science—if you don’t understand all parts of the system and can not explain why changes occurred, then you can’t say some “new” factor is the cause. It’s not scientifically correct. My point is very relevent.
(I am familiar with Gail’s beliefs and those of others. You are using an appeal to authority to try and prove your point. I could list people who side with me, but that’s not science, that’s voting.)
Yours is the classic argument of thinking that because we don’t know everything we don’t know anything. Science actually deals with probability, i.e. the likelihood that an effect is due to a particular cause.
Look, pal, I’m not a “warmer” in the usual sense of the word. I can point you to online links where I’ve challenged a number of leading AGW proponents – including Michael Mann (on the HS reconstruction in Dec 2004 – FIVE YEARS before Climategate). However, I have looked at the AGW issue in some detail and I’m convinced that the majority of post-1970 warming is due to the increase of greenhouse gases in the atmosphere. I’m not saying this will be a problem but it is happening.
Re: Warming/Cooling crossover – see my response above to your earlier post. I’m not sure there has been a significant long term GLOBAL imbalance in the last 10,000 years but if you’v e got a single example – let’s have it.
Nonsense. The warming since 1970 is a rebound from the earlier cooling
https://stevengoddard.files.wordpress.com/2014/12/screenhunter_5127-dec-11-05-58.gif
Steve/Tony
The post 1940 cooling looks to be a response an ocean cycle cool phase (PDO – if you like). Now this might have created an imbalance since cooler SST (and land surface). would emit less OLR but from mid-1970s that should have changed.
The post-1976 warming was also the result of an ocean cycle – the 1977 PDO flip.
John Finn: You are irrelevent to me.
The 9 Dec map shows some patches of yellow [ +0.5C] around the Antarctic coast as well.
A bit odd as NSIDC map shows it all as sea ice [http://nsidc.org/arcticseaicenews/]
Read
Greenland Theory
Apocalypse Now by David Chase Taylor
Just released and free to download. Over 500
Pages of staggering material.
This will clear all arguments and give insight
To so much more …
Warm regards
Nat