That’s why I didn’t realize you had to pay for it. Being South Park, youtube wants to verify your age. They do that by making you log in. I don’t have a youtube account, so I didn’t notice you had to pay until I tried to play it through this page.
I was of course referring to the Paris climate scammer’s conference later this year, where they will try to force countries to hand over as much of their money and control as possible to the UN in preparation for unelected world bureaucratic government.
Yes Andy, we are with you on that. The AGW scam will only exacerbate towards the Paris Conference given their Predictions have failed & the current Cooling trends further challenge their doctrine ; without their “evil lies” the end game would fall over / fail.
This post really gets to the point I can’t understand. How do you continue an argument knowing that you’re wrong for 20 years? And by “you”, I mean liberals. I think I just answered my own question. But even as a liberal, something is outta whack here.
MrX
Nothing out of whack. If the satellites show warming, the satellites are correct. If they don’t show warming, they’re incorrect. If it’s warm, it’s CO2; if it’s cold, it’s CO2, the man-made variety of course. You can’t win.
How long before we can no longer ignore the 21st century global warming crisis? I suppose it depends on how ignorant the believer is. If we went into an ice age tomorrow there would be a large contingent of people who would still hold the firm view that we are just a hairs breath from burning up from the insignificant increase in a trace gas.
Perhaps the global warming crisis could indeed kill most humans, if the actual climactic future is a quick return to ice age glaciation, and “the crisis” prevents proper preparation.
Perhaps, though such inability to react and prepare would not be the actual cause but rather a symptom of the real crisis: the spiritual and intellectual decline of the Western Civilization.
“Remember the nineties, when we we’re put in a panic;
Global warming was coming, it would all get quite manic.
The temperatures would rise like never before,
Doom and disaster for us all, of that they were sure…..’
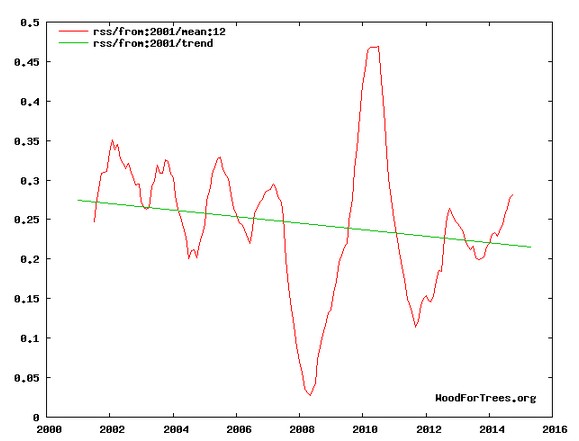
I am a bit more worried about cooling than warming as in reality RSS satellite data for lower troposphere down as opposed to theory up, shorter growing season, more deaths due to cold, I am a green person and more CO2 is good for the plants (100 ppm in other direction would kill off 1/3 of plant life on planet). Do not worry, this scam of global warming, now morphed to climatic change, could morph again back to global cooling/ice age like 70s. While massive money wasted on propaganda these days chasing research dollars and bad gov. policy, one side effect is more data and a better understanding of climate and dozens of natural cycles, too bad some cherry pick. CO2 and global warming is utter scientific nonsense, but if was true would be better for mankind than a mile of ice over Chicago. Can you imagine future gov. promoting CO2 and fissile fuels to save planet from cooling?, in a theater near you, and will be same BS as today.
A decade or two from now I think they will be looking at this AGW like we look at prior lobotomy revolution to cure mental heath, what were those idiots thinking?
Do you have any links to comparisons between USCRN and USHCN data? What I’m mostly interested in is the difference in trends between the two. I’d expect the actual numbers to be different, since measuring the average air temperature of a large country is impossible. But the trend differences should have some meaning.
I would think that if the USHCN adjusted temperature trend matched the USCRN trend, that fact would be trumpeted as vindication for the adjustments. Instead, they utterly ignore what is universally recognized as the most accurate data (ground based) set.
Thing is, there is absolutely no way that two totally different systems could get this close a match without one of them being “adjusted” to match the other. The only reason I can think why they would be doing that is to be able to say that prior to 2005, USHCN data is correct.
I also haven’t been able to determine if the USHCN values on that page are what gets fed into the climate data for other purposes.
That’s not what two actual data sets look like. The correlation must be approaching .99. That doesn’t happen in real life. That’s just someone altering one data set (or both) to match the other.
Honestly, I can’t think of any way that chart could be more disappointing. They don’t even understand statistics well enough to fake the data convincingly. I was still holding on to the hope that this scam was mostly driven by confirmation bias. That chart says they know full well that they’re lying. And they’re lying so badly that I can’t help wondering if they’re even capable of doing the science, if they tried.
On the other hand, what would happen if we were to accept this absurdity? It would prove that NOAA has fully perfected it’s adjustment algorithms. It seems to me that if they ever re-adjust any of the 2005+ US data, they got some splainin’ to do.
It does look like it matches the other NOAA graphs:
But there’s no way to tell whether or not that data is further adjusted before it’s used for global calculations. My understanding is that everyone has their own tweaks, and their own weightings, which is why none of the data sets completely matches any of the others. But that just makes the USCRN-USHCN correlation even more absurd.
I though it would be one of the African countries to be the next one waking up to coal fired electricity being the way to forward their country’s prosperity.
In Galaxy Quest the count-down clock stopped at one second because that’s the way it always was in the TV show. So, the answer is obvious: we have 5 YEARS!!! to fix this. After that, like On The Beach, we sit around and wait for our inevitable doom as clouds of radioactive CO2 drift our way. This means JoNova will be last person on earth.


Two days before the day after tomorrow.
https://www.youtube.com/watch?v=siD4cGgnLak
Sorry, I didn’t realize that was a pay link. Here’s one of the better scenes from it:
https://www.youtube.com/watch?v=AiPUjGNTi24
Mine’s disabled.
That’s why I didn’t realize you had to pay for it. Being South Park, youtube wants to verify your age. They do that by making you log in. I don’t have a youtube account, so I didn’t notice you had to pay until I tried to play it through this page.
Watch full episodes at South Park site:
http://southpark.cc.com/full-episodes/s09e08-two-days-before-the-day-after-tomorrow#source=cd81ff40-5cc1-4eb7-87a9-49f00e30a76a&position=13&sort=!airdate
The answer is obvious.
PARIS !!!
Hilton! 🙂
Yes, there is a correlation with the way it’s got a use-by-date…
I was of course referring to the Paris climate scammer’s conference later this year, where they will try to force countries to hand over as much of their money and control as possible to the UN in preparation for unelected world bureaucratic government.
That is the end game.
Yes Andy, we are with you on that. The AGW scam will only exacerbate towards the Paris Conference given their Predictions have failed & the current Cooling trends further challenge their doctrine ; without their “evil lies” the end game would fall over / fail.
http://www.mynewmovies.net/images/2011/01/cities-destroyed-movies-10.jpg
80 is the new 70…. literally…
Don’t be surprised if the thermometer you bought at Walmart got adjusted as part of this SCAM… the LIES…
http://canadafreepress.com/index.php/article/72251
This post really gets to the point I can’t understand. How do you continue an argument knowing that you’re wrong for 20 years? And by “you”, I mean liberals. I think I just answered my own question. But even as a liberal, something is outta whack here.
Marxists. Wrong since 1848. Still going strong.
Differently organized brains. Can’t be understood. Only accepted as a fact of life.
https://www.marxists.org/archive/marx/works/1848/communist-manifesto
MrX
Nothing out of whack. If the satellites show warming, the satellites are correct. If they don’t show warming, they’re incorrect. If it’s warm, it’s CO2; if it’s cold, it’s CO2, the man-made variety of course. You can’t win.
How long before we can no longer ignore the 21st century global warming crisis? I suppose it depends on how ignorant the believer is. If we went into an ice age tomorrow there would be a large contingent of people who would still hold the firm view that we are just a hairs breath from burning up from the insignificant increase in a trace gas.
Perhaps the global warming crisis could indeed kill most humans, if the actual climactic future is a quick return to ice age glaciation, and “the crisis” prevents proper preparation.
Perhaps, though such inability to react and prepare would not be the actual cause but rather a symptom of the real crisis: the spiritual and intellectual decline of the Western Civilization.
“Remember the nineties, when we we’re put in a panic;
Global warming was coming, it would all get quite manic.
The temperatures would rise like never before,
Doom and disaster for us all, of that they were sure…..’
Read more: http://wp.me/p3KQlH-6X
Gray shows ECS as 0.3 : http://tropical.atmos.colostate.edu/Includes/Documents/Publications/gray2012.pdf .
Panic cancelled.
Obama to bomb Alaska instead of Isis for Global Warming http://yournewswire.com/us-to-heavily-bomb-alaska-in-war-games-exercise-lasting-5-years/
I am a bit more worried about cooling than warming as in reality RSS satellite data for lower troposphere down as opposed to theory up, shorter growing season, more deaths due to cold, I am a green person and more CO2 is good for the plants (100 ppm in other direction would kill off 1/3 of plant life on planet). Do not worry, this scam of global warming, now morphed to climatic change, could morph again back to global cooling/ice age like 70s. While massive money wasted on propaganda these days chasing research dollars and bad gov. policy, one side effect is more data and a better understanding of climate and dozens of natural cycles, too bad some cherry pick. CO2 and global warming is utter scientific nonsense, but if was true would be better for mankind than a mile of ice over Chicago. Can you imagine future gov. promoting CO2 and fissile fuels to save planet from cooling?, in a theater near you, and will be same BS as today.
A decade or two from now I think they will be looking at this AGW like we look at prior lobotomy revolution to cure mental heath, what were those idiots thinking?
USCRN (new network) is also cooling at about 0.5º F/ decade.
Do you have any links to comparisons between USCRN and USHCN data? What I’m mostly interested in is the difference in trends between the two. I’d expect the actual numbers to be different, since measuring the average air temperature of a large country is impossible. But the trend differences should have some meaning.
I would think that if the USHCN adjusted temperature trend matched the USCRN trend, that fact would be trumpeted as vindication for the adjustments. Instead, they utterly ignore what is universally recognized as the most accurate data (ground based) set.
Actually Ted, USHCN since 2005 is cooling at 0.8F per decade according to this page.
(Notice that USHCN stops at August last year, very odd)
http://www.ncdc.noaa.gov/temp-and-precip/national-temperature-index/time-series?datasets%5B%5D=uscrn&datasets%5B%5D=cmbushcn¶meter=anom-tavg&time_scale=p12&begyear=2005&endyear=2015&month=5
Thing is, there is absolutely no way that two totally different systems could get this close a match without one of them being “adjusted” to match the other. The only reason I can think why they would be doing that is to be able to say that prior to 2005, USHCN data is correct.
I also haven’t been able to determine if the USHCN values on that page are what gets fed into the climate data for other purposes.
Actually, correct required, I was going from memory from a few months ago.
I have just updated my calcs.
Since it was established in 2005, USCRN is cooling at 0.31ºF/decade
From 2005 to the last USHCN reading, USHCN is cooling at 0.9º/decade
Thanks for the link, Andy.
That’s not what two actual data sets look like. The correlation must be approaching .99. That doesn’t happen in real life. That’s just someone altering one data set (or both) to match the other.
Honestly, I can’t think of any way that chart could be more disappointing. They don’t even understand statistics well enough to fake the data convincingly. I was still holding on to the hope that this scam was mostly driven by confirmation bias. That chart says they know full well that they’re lying. And they’re lying so badly that I can’t help wondering if they’re even capable of doing the science, if they tried.
On the other hand, what would happen if we were to accept this absurdity? It would prove that NOAA has fully perfected it’s adjustment algorithms. It seems to me that if they ever re-adjust any of the 2005+ US data, they got some splainin’ to do.
It does look like it matches the other NOAA graphs:
http://www.ncdc.noaa.gov/cag/time-series/us
But there’s no way to tell whether or not that data is further adjusted before it’s used for global calculations. My understanding is that everyone has their own tweaks, and their own weightings, which is why none of the data sets completely matches any of the others. But that just makes the USCRN-USHCN correlation even more absurd.
Glad someone else sees the real problem with the “too close” correlation of the two data sets. 🙂
I have mentioned it several times here and on other forums, but it gets no traction.
Darn it, I got it wrong.
I though it would be one of the African countries to be the next one waking up to coal fired electricity being the way to forward their country’s prosperity.
Seems I was wrong !
https://notalotofpeopleknowthat.wordpress.com/2015/05/26/turkey-to-double-coal-power/
Yes, you did, Andy, but for a different reason. Nobody will do it. Not the Africans. Not the Ottomans. We will all be “self-extincted” by 2020.
https://notalotofpeopleknowthat.wordpress.com/2015/05/26/turkey-to-double-coal-power/#comment-43713
Is this prediction “for the record”?
In Galaxy Quest the count-down clock stopped at one second because that’s the way it always was in the TV show. So, the answer is obvious: we have 5 YEARS!!! to fix this. After that, like On The Beach, we sit around and wait for our inevitable doom as clouds of radioactive CO2 drift our way. This means JoNova will be last person on earth.
Aaagghhh! Nevil Shute! AUGH! NO.
The obvious answer is ~84.5 years. At that point it will be the 22nd century global warming crisis, which will last roughly 100 years.
Where’s the eleventh, progressive and idiotic “hair on fire” choice? That would be “all of the above”