
Since 1979, Antarctic sea ice has increased by the same amount as Arctic sea ice has decreased
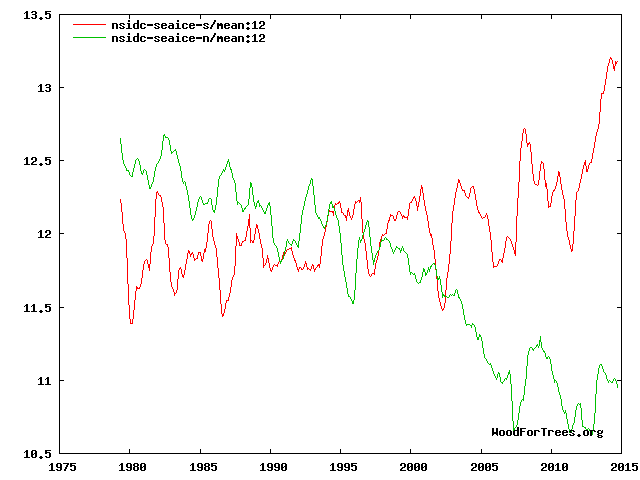
Prior to 1979, Arctic sea ice increased by the same amount as Antarctic ice decreased.
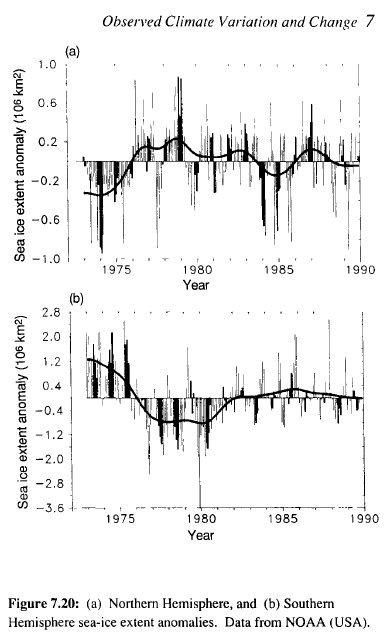
NSIDC cleverly truncates the pre-1979 data, because it wrecks their fake global warming theory. The poles are cyclical and move opposite each other. Actual scientists would try to understand it, rather than simply denying that they know about it.
The Earth is not warming, and hasn’t been for almost 20 years.

From the two graphs, it appears that Northern Hemisphere sea ice has decreased from about 12.7 to about 11.0, while Southern Hemisphere sea ice has increased from about 12.3 to about 13.2. Therefore, the total sea ice has decreased from about 25.0 to about 24.2. I presume that that is in millions of square kilometres.
The global sea-ice trend since 1979 is zero, flat, neither significantly up nor significantly down. Global sea ice extent is essentially identical this year to what it was 35 years ago. Sure, if you cherry-pick one region or another, you can show a slight trend, either up or down, but the global trend is essentially flat:
http://arctic.atmos.uiuc.edu/cryosphere/IMAGES/global.daily.ice.area.withtrend.jpg
Arctic sea ice is decreasing because of warming. Antarctic sea ice is increasing, also because of warming. The way warming increases ice is easily explained, and was even predicted by scientists:
1. wind
2. rain
3. saline stratification
4. ozone
5. freshening from glacial meltwater
6. dialectic materialism
7. voodoo
8. the Koch brothers
9. George Bush
10. George Bush
11. George Bush
12 Rush Limbaugh
13. George Bush
14. Rush Limbaugh
15. George Bush
…….
Reblogged this on Climatism.
It’s not about the sea ice, it’s about the land ice.
Right. Because if the earth were actually warming, it would melt land ice but have no effect on sea ice.
Land ice is melting, and the earth is warming. The physics is simple and clear – more energy is being absorbed by the earth than being reradiated into space. This is because of the earth’s albedo and the atmospheric composition. It’s not controversial, it’s a fact.
How long and how much John? Resulting in how much of an increase in the rate of sea level rise? Water from melting terrestrial ice sheets goes into the oceans. Thus MUST cause an increase in the rate of sea level rise globally. There has been no such increase. So where’s the water?
“and the earth is warming.”
No, it isn’t.
The “albedo” argument hasn’t withstood the tests of time. The years when there was the least sea-ice in the arctic should have had an immediate and obvious effect, but it simply failed to happen. In fact, the sea-ice recovered so promptly, and with such vigor, that a new hypothesis appeared: Some suggested that open water caused the arctic to lose more heat, rather than less.
The sea-ice has increased in the southern hemisphere, and has done so at latitudes north of sixty degrees, which should involve higher albedo, because the sun is higher and brighter at those latitudes. Here is another test of the albedo arguments. In this case the total light reflected would be greater than the light “absorbed” by ice-free northern waters. As you say, “the physics is simple and clear.” If, over the earth as a whole, you add up the amount of energy “absorbed” and compare it with the amount “reradiated into space”, and you see less is absorbed and more is reradiated, there should be some sort of immediate and obvious response. Sorry. It hasn’t happened.
You shouldn’t say, “It’s not controversial, it’s a fact,” because what we are witnessing is very controversial, which is what makes it so interesting. If your mind is too made up, too early, you’ll miss all the fun.
Andy,
Even Steven Mosher says the earth is warming!
http://berkeleyearth.org/team/steven-mosher/
What is it you know that he doesn’t?
Picka a date, and you can claim warming or cooling. The Earth warms and cools. No big deal unless it is another ice age.
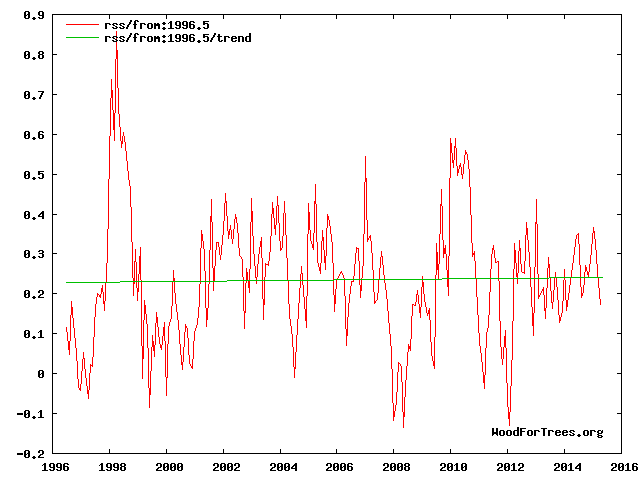
Yes there is slight warming at the surface according to most data bases. But the upper troposphere where the models predicted that the effects of human produced gases would appear is NOT warming. The FACT is that the satellite data just does not bear out what was predicted. Not even close! And many in the climate science world have admitted that thus we have about 70 different excuses (they call them hypothesis) for where the expected warming went.
Temperature Lower Stratosphere (TLS) – Brightness Temperature Anomaly – 1979 to Present
ftp://ftp.ssmi.com/msu/graphics/tls/plots/rss_ts_channel_tls_global_land_and_sea_v03_3.png
Remote Sensing Systems (RSS) – Microwave Sounding Units (MSU) – Base Period 1979-1998 – Click the pic to view at source
http://www.drroyspencer.com/wp-content/uploads/UAH_LT_1979_thru_April_2015_v61.png
The UAH graph shows an increase in temperature from about -0.3 C in 1979 to +0.07 C in 2015.
Nothing can dissuade Jim from believing global warming propaganda because he wants to believe,
Even the fact that none of the predictions made by the Lords of Global Warming came true. There’s zero evidence of AGW yet Jim steadfastly refuses to acknowledge this.
He’s left with nothing but a marginal increase in temperature after the last cooling period and fluctuating annual Arctic sea ice (which was supposed to have disappeared decades ago).
Jim is precisely the kind of person AGW propaganda is targeted towards.
“Richard Mallett says:
May 31, 2015 at 1:43 pm
The UAH graph shows an increase in temperature from about -0.3 C in 1979 to +0.07 C in 2015.”
That certainly is an indication of the run away global warming caused by man now isn’t it? Couldn’t possibly be withing the range of normal variation now could it? /sarc off. The trend line for the upper troposphere at the linked graph is flat! And That is where the run away warming was supposed to start according to the alarmists from the UN to the MET.
The trend line is not flat. The line on the graph is a zero anomaly line. If you calculate the trend, it is +1.08 C per century. It’s a bit of a clue that most of the points before the El Nino are below the line, while most of the points after the El Nino are above the line.
And so your point is what?
It should be a flat line or trending downwards?
The main point lost in all the talk is temperatures haven’t come close to what the models predicted … and all the predictions based on the models have been false. Everything forecast was based on models that failed.
I think your still referring to the UAH graph: This is the one I’m referring to for the upper troposphere:
Temperature Troposphere / Stratosphere (TTS) – Brightness Temperature Anomaly – 1987 to Present
ftp://ftp.ssmi.com/msu/graphics/tts/plots/rss_ts_channel_tts_global_land_and_sea_v03_3.png
Remote Sensing Systems (RSS) – Microwave Sounding Units (MSU) – Base Period 1979-1998 – Click the pic to view at source
That is why I was said it was referring to “the linked” graph. It’s trend line running from 1980 to present. The point being the upper troposphere temps are not warming and that is exactly where the UN and MET and other “authorities” said that AGW would first show up.
Either way, no matter what graph of satellite temperature data one looks at from any of the major sources at ANY level there is not a one that shows a signal outside of normal variation. The bottom line? CAGW is not happening. Period. And all the Kings horses and all the Kings men can’t change that.
Can you name a single prediction of catastrophic ice melt, sea level rise, reef destruction, severe weather, severe drought, or any other such thing that has actually occurred out of the many predictions of such disasters that should have befallen us by now?
Our president just blamed the violence in Nigeria on warmer than normal temperatures. “During his speech at the Coast Guard Commencement ceremonies, President Obama warned that climate change was part of the reason behind increasing violence in countries around the world.
Obama pointed out that under his administration, the Pentagon had begun identifying climate change as a “threat multiplier” in world conflicts, although he was careful not to put all the blame on changing weather patterns.
“Understand, climate change did not cause the conflicts we see around the world, yet what we also know is that severe drought helped to create the instability in Nigeria that was exploited by the terrorist group Boko Haram,” he said.”
If you check the records you will find that Nigeria and in fact all of Central Africa have had both cooler and wetter than average weather for a couple of years now! Heck, you don’t even have to check but I wish you would. But if you don’t then just think about it! Where do Atlantic hurricanes spawn? They start as massive thunderstorm cells coming out of North Central Africa! How many Atlantic Hurricanes have we had the last three years? Way below average. Right!
Three points :-
(a) the upper troposphere temperature according to UAH and RSS is increasing by 1.13 degrees per century and 1.21 degrees per century, respectively.
(b) how do you know that the signal is outside normal variation ? What is the range of normal variation ?
(c) where can I find temperature and rainfall data for Nigeria (which is in West Africa) and Central Africa that shows that they have had cooler and wetter than average weather for a couple of years now ? What matters is not a couple of years, but the overall trend over many decades.
Sigh; Try this for your question about Central African weather in the context that I stated it: http://www.weatherbell.com/saturday-summary-may-23-2015
Note: Per John Christy, RSS and UAH anomalies are not comparable because they use different base periods, i.e., “RSS only uses 1979-1998 (20 years) while UAH uses the WMO standard of 1981-2010.”
You do know who John Christy is?
As for normal variations?
What would you say?
Monthly Global Average Land Temperature – 1850 to Present
http://www.metoffice.gov.uk/hadobs/crutem4/data/web_figures/global_n+s_monthly.png
http://www.longrangeweather.com/images/gtemps.jpg