
For the third year in a row, near-polar temperatures have dropped below normal in May.
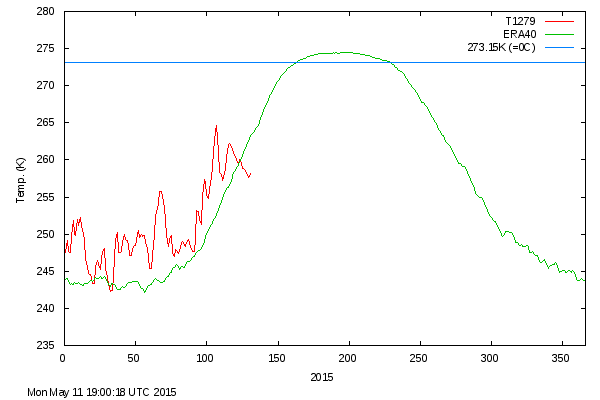
Both of the last two years, temperatures stayed below normal for the entire melt season.
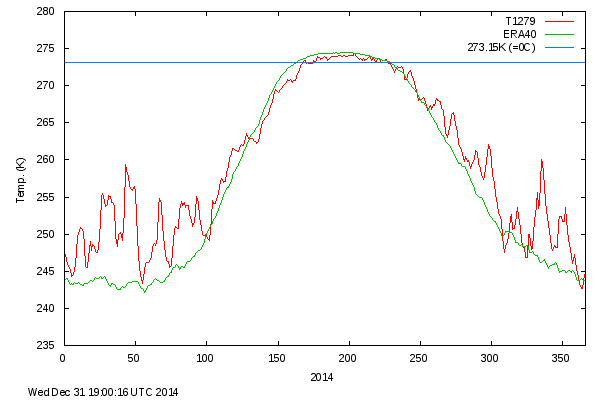
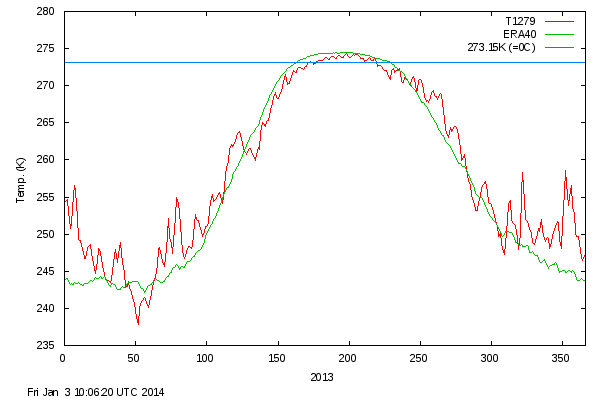
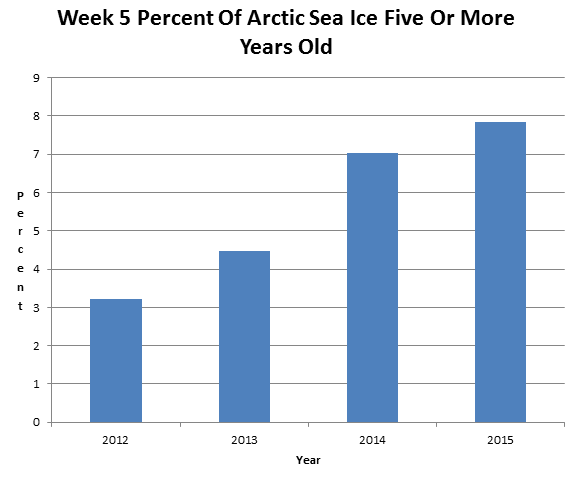
The below normal summer temperatures are keeping the ice from melting, and have led to a large expansion in the amount of thick multi-year ice
Alarmists don’t mention any of this climate scam-wrecking information, and instead focus on above normal (-25C) winter temperatures, which are the result of polar air plunging far south and freezing the Great Lakes with record ice.

OT … As of 11 p.m. EDT on Saturday, the NHC said TS Ana packed 60 mph winds. Each subsequent advisory had the storm weakening as it approached land. On Sunday, the NHC reported TS Ana made landfall with 45 mph winds. Three or four miles north of landfall is North Myrtle Beach’s Grand Strand Airport. Grand Strand recorded a max wind speed of 38 mph — on Saturday night. I know of no other ground station reporting winds in excess of 38 mph. Should we consider that Ana made landfall in the U.S. at tropical storm strength?
And Antarctic ice is at a record level. http://dailycaller.com/2015/05/11/antarctica-has-so-much-sea-ice-scientists-have-trouble-getting-there/
The chilliest air will settle over the region Wednesday night. Under clear skies and diminishing winds, temperatures will drop to frosty levels in parts of West Virginia, western and northern Pennsylvania, western and northern New York state and northern New England.
Frost is forecast neither in the Interstate-95 corridor to the coast nor in most urban areas farther inland.
http://vortex.accuweather.com/adc2004/pub/includes/columns/newsstory/2015/650x366_05111555_hd23-1.jpg
Meanwhile your favourite DMI 30% metric is at the lowest level for the date since their records began:
http://GreatWhiteCon.info/wp-content/uploads/2015/05/DMI-30_20150512.png
It is almost identical to 2006 – the year with the highest minimum.
Do you ever get tired of being an idiot?
As luck would have it my favourite JAXA 15% metric is also currently at the lowest level for the date since their records began. How do you explain that?
http://greatwhitecon.info/wp-content/uploads/2015/05/2015-05-12_JAXA-1024×533.jpg
I would say that only a complete moron would obsess over day to day variations of a couple of percent of ice extent.
You seem to be the one who’s obsessed though. In this case about the day to day variations of the temperature at the North Pole?
“Your favorite DMI 30% metric is at the lowest level for the date since their records began.” Of course “when the records began” might have some bearing on the discussion. Also, if it’s at the lowest level, it proves nothing as to why it’s at the lowest level.
Jim Hunt says, “You seem to be the one who’s obsessed though. In this case about the day to day variations of the temperature at the North Pole?”
=============================================
Was there some part of “Both of the last two years, temperatures stayed below normal for the entire melt season.” which you failed to read?
We are at the bottneck point where the difference between the recent highest and lowest amount of ice is very tightly packed. We will have to see what happens once we get to summer.
And the Antarctic isn’t particularly short of sea ice.
http://nsidc.org/data/seaice_index/images/daily_images/S_timeseries.png
I thought one of the climate alarmista drones said it would shortly be the only place people could live.
Arctic alarmists are capitalizing on extent numbers, and ignoring the concentration and growth in volume. Even PIOMAS shows precipitous growth in volume of sea ice since 2011.
I think the continued growth in volume and this concentration of sea ice is going to bite the warming alarmists in the butt in September. Again.
+1
-1.
Please can you provide some evidence for your assertion that “PIOMAS shows precipitous growth in [the] volume of sea ice since 2011”.
As for your subsequent thoughts, let’s meet here again in September to discuss them further!
http://psc.apl.uw.edu/wordpress/wp-content/uploads/schweiger/ice_volume/BPIOMASIceVolumeAnomalyCurrentV2.1.png
See you in September.
http://GreatWhiteCon.info/resources/gridded-piomas-graphs/piomas-regional-volume/#Delta
It’s a date!
Jim, why link to a bunch of different dates showing disparate regions in the arctic. The overall chart, dated 4-30-15, clearly show rapid OVERALL growth for the last four years.
If the AMO continues to turn, there is no reason this NH trend will not continue, just as it has in the past.
Because at this early stage in the melting season temperatures at the North Pole are irrelevant.
Those regional PIOMAS graphs show LESS volume than April 2013 (i.e. immediately post the record 2012 melt) everywhere that counts outside the CAB.
Have you ever heard of “albedo feedback”?
If Joe is right about the AMO shift then Jim will be out of a hobby for a time and can go find something else to worry about since anyone with sense will quit visiting his little blog. http://www.weatherbell.com/saturday-summary-may-9-2015
RAH,
It is going to be interesting to see what all that sea ice in the Antarctic does to the West Wind Drift (Antarctic Circumpolar current) and the repercussions in the Atlantic and Pacific oceans.
The West Wind Drift is wind driven and where it passes the tip of South America and Africa currents are diverted north towards the equator. Sea Ice, Ozone and the sun are going to have an impact on the strength of the winds driving that current and therefore the amount of cold water driven up the coasts.
IIRC the winds have started strengthening which will drive more water northward as it hits the restrictions.
“The Southern Ocean winds are now stronger than at any other time in the past 1,000 years,” Abram said. (The rest is hogwash)
The Arctic is pretty much land locked so it is the Antarctic that has the major influence on the world’s oceans.
So Jim, you do not like talking about the four years of arctic ice increase. you do not like talking about a 75 percent increase in arctic ice thickness over the past four years,
https://stevengoddard.files.wordpress.com/2015/04/myi-52011vs52015.gif
and you do not like talking about what looks to be the third year in a row of Arctic circle air T dropping and staying below normal for the entire melt season, the message of this post, which had zero to do with daily ice extent at this time.
Ok, well, we will see you in September, but the only burn you will likely feel is your pride. Perhaps you could borrow Reggie’s blow torch.
David – I’m very familiar with that animation. Here’s my version:
http://GreatWhiteCon.info/resources/arctic-sea-ice-videos/winter-201415-videos/#DAM
That’s why I understand that it shows sea ice AGE, not thickness. At the risk of repeating myself:
“Regional PIOMAS graphs show LESS volume than April 2013 (i.e. immediately post the record 2012 melt) everywhere that counts outside the Central Arctic Basin.”
It’s a date!
The great con..
How appropriate for a Jim link. !!
Jim knows. He’s part of it.
Seriously, this Jim Hunt guy is truly pathetic.
Started a blog, then closed comments after 4 comments… bloody hilarious. ! 🙂
BoltA would love the head tilt 😉
Jim should take a soap box up to the Arctic ice.
If he creates enough useless hot air, maybe he can reverse the current increasing trend.
agreed , claiming piomas is anything other than another climate modeler fantasy is hysterical . once again there will be no ice free arctic again this year . the countdown is on to the day jim hunt has to pay a charity of my choice £1000 . i look forward to that day.
yes jim, let,s . how funny when there is a lesser extent in winter all the lowest ever level guff gets trotted out once the melt begins , we will be hearing about lowest ever levels right up until the extent crosses the line once the low volume areas melt out.
this is when the rhetoric will increase from the idiot friv on the asif ,he has already begun his blowtorch bullshit ,though i see a couple of others have joined in this year.
you fancy doubling that bet to £2000 if you are so confident steve is so wrong 🙂
Hello again Chilly,
Further to our conversation over at Snow White’s, as far as I can tell the sum you previously mentioned was a mere $100. Do you any evidence to the contrary?!
you must be getting forgetful jim. it is $1000 not pounds, so my memory not so good either 😉 https://stevengoddard.wordpress.com/2014/08/21/arctic-is-screaming-at-mark/
Chilly – Having personally discussed the matter with Rear Admiral Jon White:
http://econnexus.org/the-economist-being-economical-with-the-truth-about-climate-change/
and having since publicly stated that I’m more pessimistic than him, how about $1000 in favour of ShelterBox on CT Area < 1 mio square kilometers by the summer of 2022 at the latest?
$1000 on ct area being less than 1million square kilometres at some point between now and 2022 sounds fine to me,we have a bet . remember ,this is where to send your $1000
http://www.chas.org.uk/how_we_help_families/our_hospices/rachel_house
no running away now jim 🙂
jim, i am happy for you to let all your fellow warmists know that i will take personal bets from every single one of them on the terms we have decided upon. let us see how many are willing to put their money where their mouths are
i doubt many will have the courage you have to do so.
cat got your tongue jim ? must be hard coming here and having deniers hit you with evidence time and time again 🙂
My tongue is happily wagging elsewhere Chilly:
http://GreatWhiteCon.info/2015/05/the-new-normal-in-the-arctic/#comment-209003
Well you choose the appropriate site for you to inhabit.. Great CON.
You know it is, so stop your childish propaganda.
You have no chance of fooling anyone here, except yourself.
obviously comment was aimed at Jim.
Andy – Which “4 comment” post are you referring to?
Not just the Arctic. Temperatures in the entire Great White North are dropping like a Climate Science Hysteric through rotten ice. 3 Degrees/century is Bring On the Next Ice Age rate of cooling.
Real, measured cooling, not some tweaked & torqued output from a GCM or one of Gavin’s spreadsheets.
The long underwear and toque industries in Canada are about to experience a boom.
https://sunshinehours.wordpress.com/2015/05/07/canada-is-cooling-since-1998-at-0-279cdecade/
The entire discussion is irrational. If the feared 2° rise were to happen, nothing but good would result. The Alarmist consequences are grossly exaggerated, and the benefits disregarded. From Arctic passages to expanded farmland to much reduced weather deaths, it’s all good. Increase of CO2 would have nothing to do with causing the warmth, but would compound the benefits of warming.
What is to be feared is the opposite, cooling, not least of whose harms would be a reduction of atmospheric CO2. It would also cause storms, droughts, expansion of the deserts, and loss of food supply. Weather deaths would begin rising again. And it’s cosmologically much more likely, probably overdue.
So absolutely true. You have just expressed what I was planning to write later.
Extra CO2 = toatlly beneficial, life-giving plant food.
A bit warmer = helps plants grow, feed the world.
Andy, you do not go far enough when you say “…. extra CO2 = totally beneficial, life-giving plant food….”
Carbon dioxide starvation as the world gets cooler is a much more real problem than CAGW and it is a problem that is ignored
The atmosphere is too CO2 limited to allow growth of trees on tropical mountains above certain heights and as the climate cools and the oceans suck up more and more CO2 (Henry’s Law ) that height becomes lower and lower until during the depths of the Wisconsin Ice Age trees at La Brea tar pits ( Elevation 164 ft (50 m) trees were in starvation mode.
Now that is what I call a real environmental problem!
Carbon starvation in glacial trees recovered from the La Brea tar pits, southern California. – http://www.ncbi.nlm.nih.gov/pubmed/15642948
The Royal Society: Carbon dioxide starvation, the development of C4 ecosystems, and mammalian evolution.
http://rstb.royalsocietypublishing.org/content/353/1365/159
And here is a real killer:
Impact of lower atmospheric carbon dioxide on tropical mountain ecosystems
During the Holocene Optimum temperatures were up to 3C higher in the Arctic and the arctic was ice free.
Ice free Arctic Ocean, an Early Holocene analogue
New insights on Arctic Quaternary climate variability from palaeo-records and numerical modelling
If you bother to look at the solar energy in the Arctic it is easy to see why the temperature was higher and the sea was free of ice during the Holocene Optimum.
The Holocene is 11,700 years so the earth came out of Ice age when the insolation was 522.5 Wm?2 (12,000 years ago) The depth of the last ice age was 464 Wm?2 (23,000 years ago) so the insolation changed 58.5Wm?2 (the 60°N June insolation)
The ClimAstrologists are saying that solar insolation change is going to be trumped by CO2 forcing when the entire CO2 forcing is 32 to 44 W m–2 [cf., Reid, 1997]. and all but 5 to 6 W m–2 of that forcing occurs in the first 200 ppm CO2 (modtran) A CO2 concentration where plants barely survive.
Some how 60 W m–2 trumps 6 W m–2 in my book and that is using THEIR numbers!
……..
Or you can look at it another way.
The Holocene is 11,700 years old. That is 200 years past half precession cycle. (Milancovitch)
According to Dr Brown (and the IPCC) the earth’s climate is a choatic system. For the past five million years the climate has been bi-stable with a warm phase, interstatials and Dansgaard-Oeschger events and a cold phase, the default condition of glaciation. The 60°N June insolation was close to or AT PEAK before the earth flipped to an enduring warm phase, the Holocene.
All the INSOLATION VALUES are from NOAA.
http://www1.ncdc.noaa.gov/pub/data/paleo/climate_forcing/orbital_variations/berger_insolation/insol91.jun
11,000 years ago — 523.16 Wm?2 (insolation peaked)
Holocene inception occured within three years per Dr Alley
12,000 years ago — 522.50 Wm?2
http://jonova.s3.amazonaws.com/graphs/lappi/Five_Myr_Climate_Change_Rev.jpg
Right now the solar insolation is 476 Wm?2 only 12 Wm?2 above the insolation during the depths of the Wisconsin Ice Age. In other words while the Younger Dryas (`13000 years ago – 519.85 Wm?2) happenned during a time when the earth was in the warm stable state of high solar insolation, right now the earth insolation regimen is in a metastable state. One good kick and we are in the glaciation phase for the next 65,000 year or so. One thing is certain the earth is not going to warm catastrophically for another 65,000 year. The solar energy (that CO2 only retards escaping) is just not there.
So we had better pray CO2 is the Magic Gas it is purported to be and can keep us out of glaciation, because CAGW is of course laughable. Or at least hope we humans can pump out enough to keep C3 plants from starvation as the climate gets colder during the next cycle phase.