
The Arctic was the last remaining hope of the climate criminals to maintain any credibility, and that story has completely collapsed.
As we approach mid-summer, southern Greenland is still covered with snow. This is a land where Vikings farmed 1,000 years ago.
The melt season on Greenland is the slowest on record. Normally about 30% of Greenland is melting by now, but this year less than 10% is melting.
Greenland’s surface has gained more than half a trillion tons of snow and ice since September.
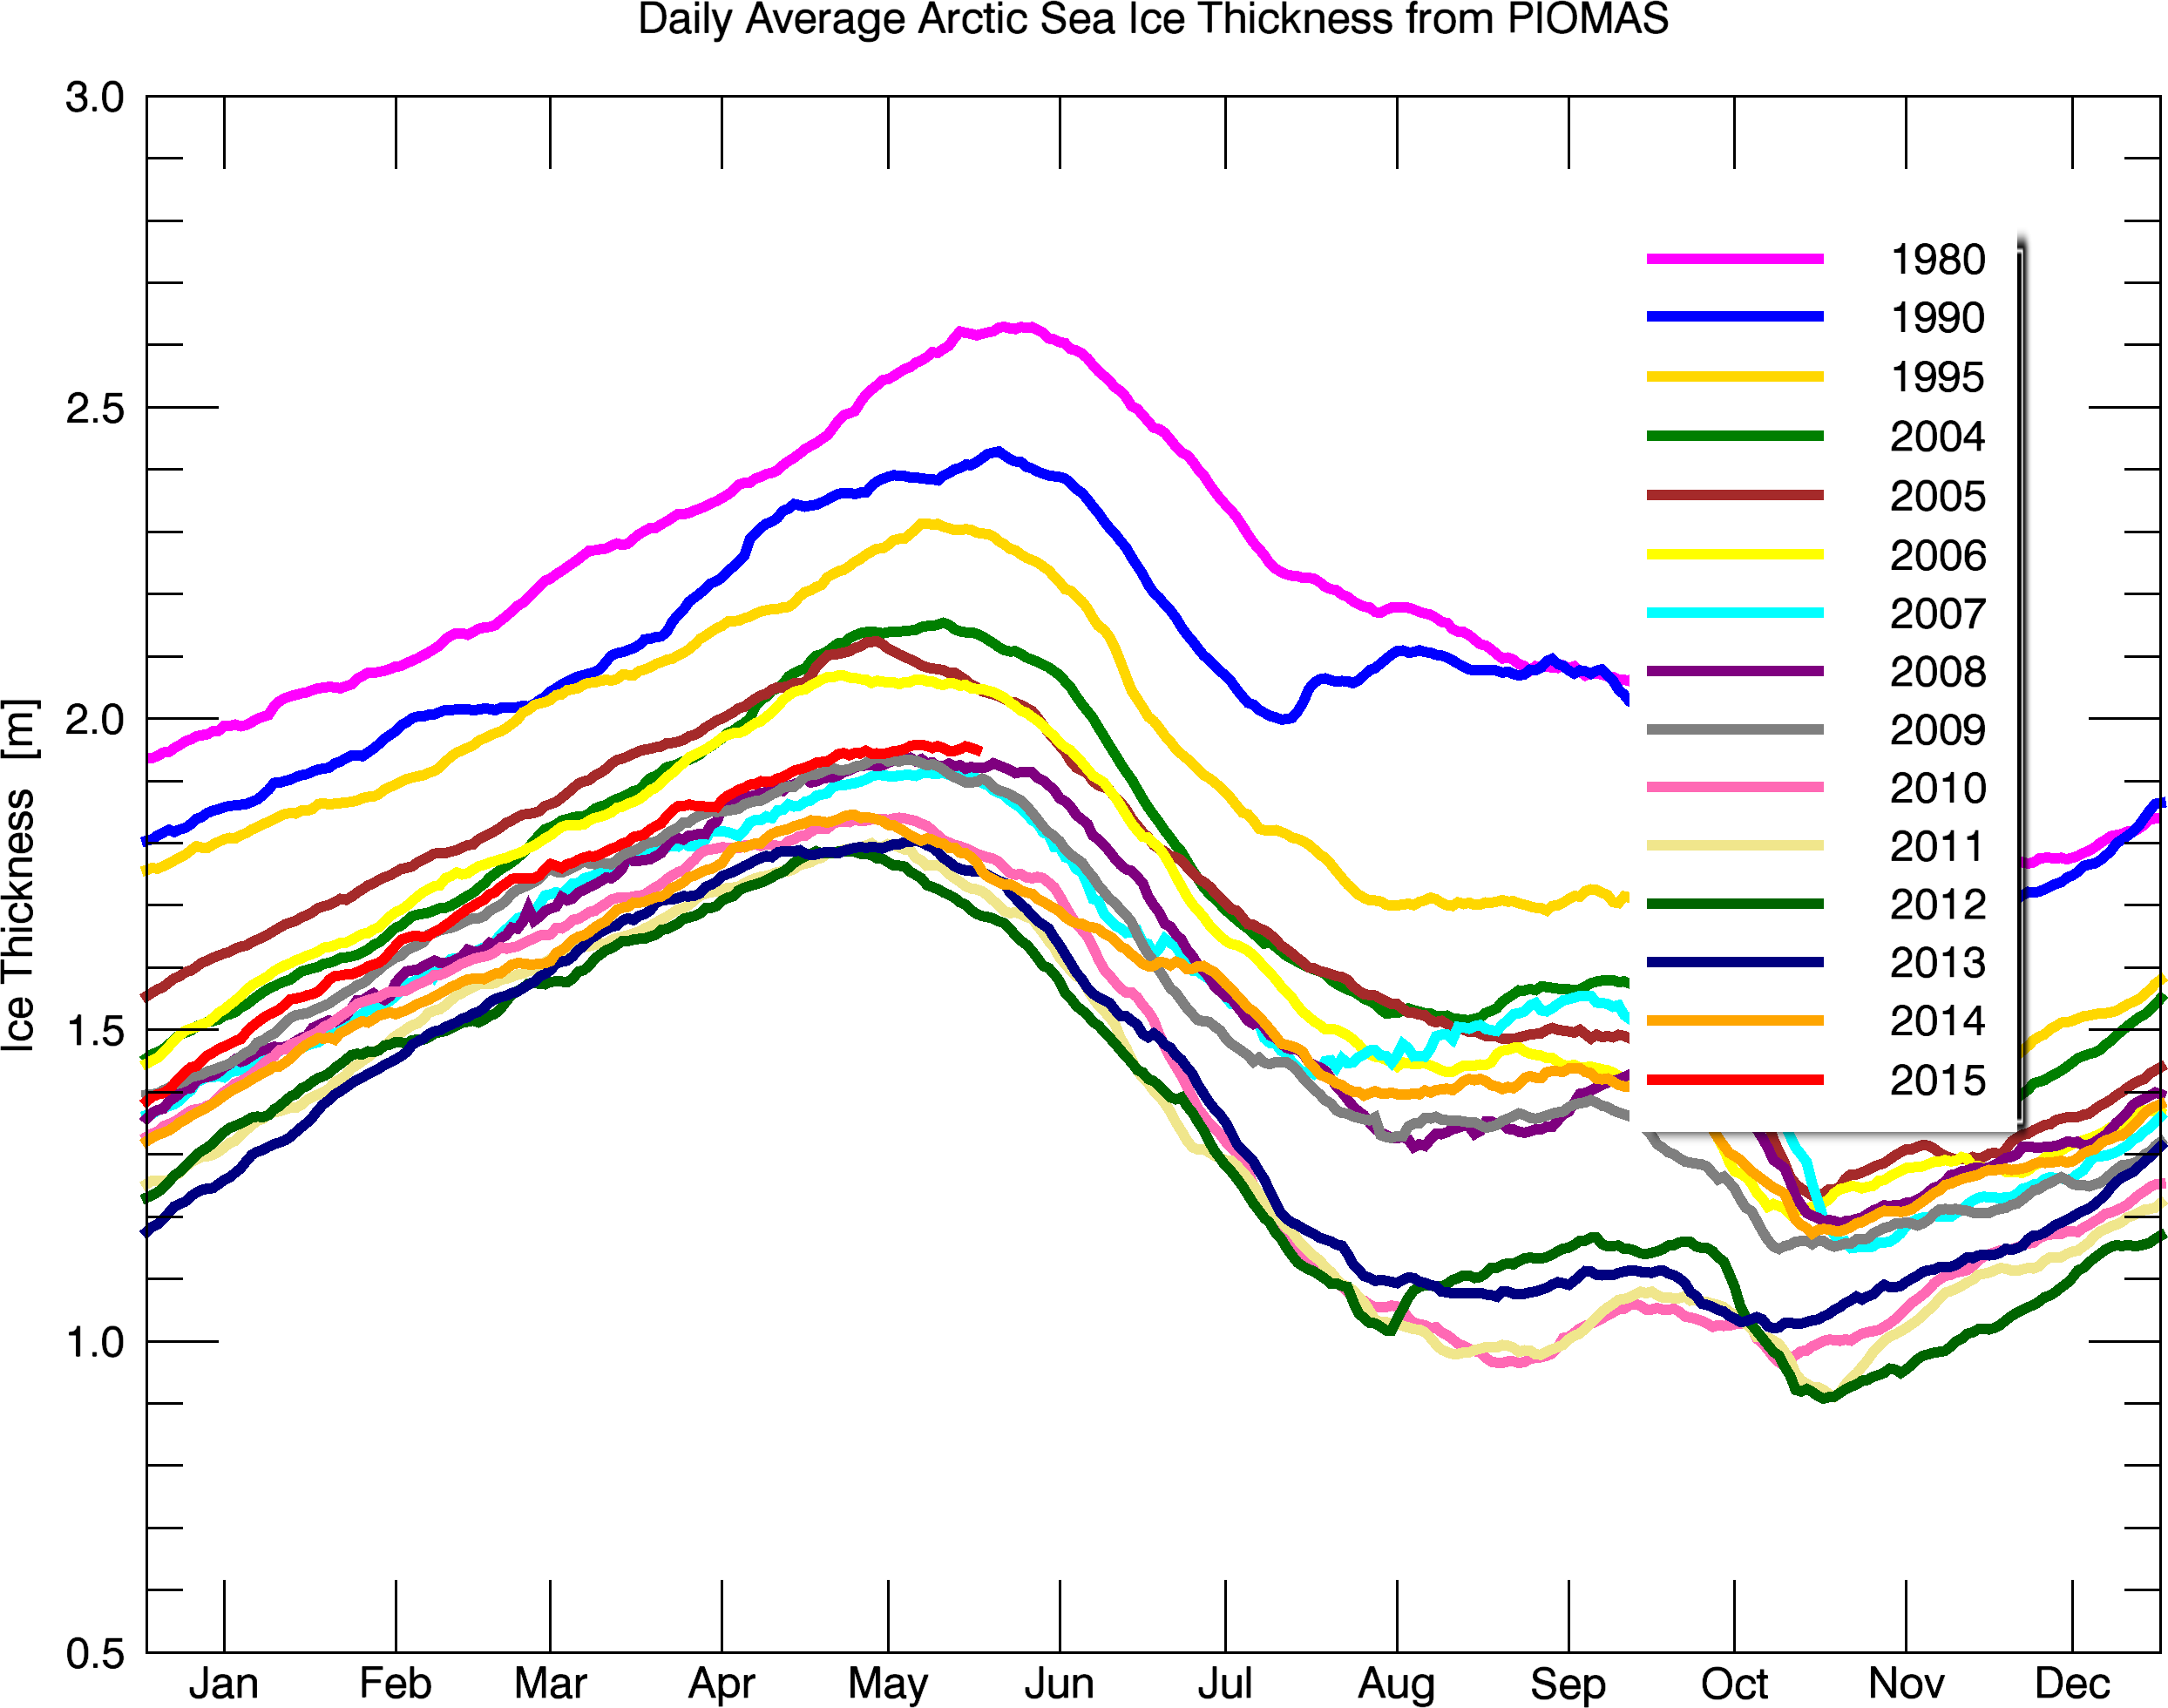
Near the midpoint of the melt season, Arctic sea ice is closely tracking 2006. That was the year with the highest summer minimum of the past decade.
Arctic sea ice is the thickest it has been since 2006.
Ahead of the Paris conference, the White House and climate scientists are ramping up their spectacular lies – telling the exact opposite story of what is actually happening.
Arctic sea ice disappearing at record rate – Al Jazeera English

May the rest of the post-WWII consensus science scam collapse with the Artic climate scam and the President of the National Academy of Sciences, Dr. Ralph Cicerone, get full credit for directing public funds to deceive the public.
Members of the Royal Society, the National Academy of Sciences, the news media (BBC, NPR, NYT, etc.), the Parliaments and Congresses have failed to grasp that spectular collapse of the Artic climate scam will confirm in the minds of the public that government science is as TRUSTWORTHY AS THE COMMUNITY LIAR.
A Professor of Philosophy at UC-Berkeley and the National Public Radio (NPR) are already trying to do damage control: “SHOULD WE TRUST SCIENCE?”
http://www.npr.org/sections/13.7/2015/06/12/413607947/should-we-trust-science
That PR campaign for restoring public confidence in documented science liars will be a difficult promotion.
The NYT also tried to help the Pope, the UN and the NAS prevent collapse of the global climate scam,
http://mobile.nytimes.com/2015/06/14/world/europe/pope-to-explore-climates-effect-on-worlds-poor.html?referrer=
but the SCIENTIFIC FACTS are that a fountain of energy in the center of the Solar System
1. Made the chemical elements
2. Birthed the solar system five billion years (5 Ga) ago
3. Sustained the origin and evolution of life after 3.5 Ga ago
4. Still controls every atom, life and planet in the solar system today, and
5. Cannot be hidden from the public by combined forces of the Catholic Church, the United Nations and the national academies of science (NAS) united into a giant, worldwide “Orwellian Ministry of Consensus Scientific (UN)Truths.”
The pseudo-science fiction
Is quite scary stuff,
Thankfully real world observations
Are calling their bluff.
http://rhymeafterrhyme.net/the-ghost-of-real-science/
STEVEN: Read THIS at the top of the NOAA Graph:
“National USHCN monthly temperature updates have been discontinued. The official CONUS temperature record is now based upon nClimDiv. USHCN data for January 1895 to August 2014 will remain available for historical comparison.”
http://www.ncdc.noaa.gov/temp-and-precip/national-temperature-index/time-series?datasets%5B%5D=cmbushcn¶meter=anom-tavg&time_scale=p12&begyear=2005&endyear=2015&month=12
While I do not agree with many of his ideas, especially his social and political philosophy, Stefan Molyneux recently did a good video on youtube calling out the complete sham of one major study on global warming claiming there was a “97% consensus” on it.
It should be noted that while there is a lot of religious fervor for “proving” global warming among climatologists that other scientific fields, namely geology, have large professional associations who seem to have their own consensus’ that there really isn’t anything abnormal about the climate patterns we see today or any strong evidence that they are being affected by human actions.
At the end of the day, science is about evidence, in this case testable predictions, and not about consensus.
Greenland is the critical balance for the Northern Hemisphere with nearly 10% of the Worlds Ice.
Various sources are indicating greater Ice mass of recent months & delays in Summer melting ;
I can state with confidence ; there is more Ice on Planet Earth than for more than a decade !
Perhaps you forgot how much mass both Greenlandic and Antarctia ice sheets have lost during the last decade. Are you following the science nor not?
Have you forgotten just how much ice mass was gained in the lead up to the LIA.
And the only part of the Antarctic that has lost mass is the very localised volcanic West Antarctic peninsula, the rest has gained mass.. as far as measurements can determine.
You obviously think that science started only 10 years ago. DOH !!!
Wrong again.
According to NASA’s Land-Ice Study published in 2012, from 1992-2008:
“Mass Gains of the Antarctic Ice Sheet Exceed Losses.”
During 2003 to 2008, the mass gain of the Antarctic ice sheet from snow accumulation exceeded the mass loss from ice discharge by 49 Gt/yr (2.5% of input).
The net gain (86 Gt/yr) over the West Antarctic (WA) and East Antarctic ice sheets (WA and EA) is essentially unchanged from revised results for 1992 to 2001.
http://ntrs.nasa.gov/search.jsp?R=20120013495
Increases offsetting losses:
…“The recent 90 Gt/yr loss from three DS (Pine Island, Thwaites-Smith, and Marie-Bryd Coast) of WA exceeds the earlier 61 Gt/yr loss, consistent with reports of accelerating ice flow and dynamic thinning.
Similarly, the recent 24 Gt/yr loss from three DS in the Antarctic Peninsula (AP) is consistent with glacier accelerations following breakup of the Larsen B and other ice shelves.
In contrast, net increases in the five other DS of WA and AP and three of the 16 DS in East Antarctica (EA) exceed the increased losses.”
http://ntrs.nasa.gov/search.jsp?R=20120013495
GRACE is an error ridden platform, that never had proper calibration, and whose data is then run through models, until the grantologists get their desired results.
What’s a TRF error? That stands for Terrestrial Reference Frame, which is basically saying that errors in determining the benchmark are messing up the survey. In land based geodesy terms, say if somebody messed with the USGS benchmark elevation data from Mt. Diablo California on a regular basis, and the elevation of that benchmark kept changing in the data set, then all measurements referencing that benchmark would be off as well.
In the case of radio altimetry from space, such measurements are extremely dependent on errors related to how radio signals are propagated through the ionosphere. Things like Faraday rotation, refraction, and other propagation issues can skew the signal during transit, and if not properly corrected for, especially over the long-term, it can introduce a spurious signal in all sorts of data derived from it. In fact, the mission summary shows that it will affect satellite derived data for sea level, ice loss, and ice volume in GRACE gravity measurements.
http://wattsupwiththat.com/2012/10/30/finally-jpl-intends-to-get-a-grasp-on-accurate-sea-level-and-ice-measurements/
And the Earth’s gravitational field is not uniform, or constant. GRACE measure gravity, and not ice or water.
http://wattsupwiththat.com/2010/07/20/graces-warts-new-peer-reviewed-paper-suggests-errors-and-adjustments-may-be-large/
You guys are full of rubbish! Last year was the warmest year ever! I know because I read it in the newspapers and everyone agrees, and all the scientists, and yeah, so there.
97% of “scientists” who are paid to lie about every year being the warmest on record say that every year is the warmest on record. Even though their very own satellites say there has been no warming for at least 18 years. Even though raw data from US stations away from cities says there has been no warming since the 1930’s.
I though the rubbish comment was being facetious ; at least your answer wasn’t rubbish.
Actually, 97% said no such thing. Cook’s reviewers ranked everything not an explicit “denial” as full-bore agreement. When you look for explicit agreement, you get about 0.3%. Overstatement by 97/0.3 = 323X = 32,300%. Typical CAGW margin of error.
The Arctic seems to be a top subject these days. I suggest you to leave behind the skeptics and the alarmists and take a look here – http://www.arctic-heats-up.com/pdf/chapter_2.pdf – to find more about the general picture and the arctic in climatology. There are some very interesting aspects which should be taken into considertion when analysing our days climate.
Namely, at no point during any Ice Age was all of Alaska or even much of Alaska outside of the mountains, ever covered by massive glaciers whereas nearly all of Canada and the Great Lakes/New England parts of North America were under a mile of ice.
Just looking at that web site ; although there are interesting points in the mix, I get concerned when ever it involves a nonsense hypothesis. For example, to even factor in WW 1 Naval battles as potentially contributing to the warming of Ocean currents into the Arctic Circle?? Sorry, in my understanding of proportional heat load “that’s crazy stuff”,,, it was worth a look from another perspective, despite the wild assertions…
Yea, I have checked that out a few times and think it’s nuts. There was really only one great naval battle between big ships during WW I but it did involve more capital ships than any naval battle in the history of iron/steel ships. Back then all those large ships were fired by coal. When they poured the coal to the boilers in those ships, as they would in combat, it could create quite a nasty noxious smoke screen downwind.
A nasty noxious smoke screen that would have virtually no effect on ocean temperatures or circulation patterns.
From Chapter 8 http://www.arctic-heats-up.com/pdf/chapter_8.pdf this excerpt is taken: The situation became dramatic when U-boats destroyed more ships than Britain could build in early 1917. In April 1917, the same total rate of the previous annual rate of 1916, ca. 850,000 tons, was destroyed by U-boats. In April 1917, Britain together with the Allies lost 10 vessels every day. During the year of 1917, U-boats alone sank 6,200,000 tons, which means more than 3000 ships, and, during the war months of 1918, another 2,500,000 ship tonnage.
Andy my note about coal was just for general knowledge. As I said, I think the whole idea that ships or war cause real climate change is nuts.
Along the same lines. During WW II there were several times that attacks by American submarines were thwarted because of coal smoke acting as an inadvertent smoke screen for Japanese ships at night. But actually the older ships using coal cost the Japanese far more ships than coal smoke saved because the coal smoke coming out of the stack of a ship could be seen when the ship was far below the horizon and when it was well outside of radar range. Thus during the daytime such smoke acted as a beacon for a sub to make an approach.
How are you explaining the sudden warming in the Arctic since 1919? I wonder where you read about “the naval war contributing to the warming of Ocean currents”. As I understand the thesis, that naval war changed the water structure (temperature and salinity) around GB, all flowing northwards, contributed to a shift in the water profile around the Fram Strait and Arctic Ocean.
U-boats actually sunk a million more tons in WWII, 14.1 million vs 13 million in WWI. Oceans are vast, and that is a drop in the bucket.
@gator 69: The only period of global cooling since the LIA started in autumn 1939, few weeks after WWII begun, first causing extreme winters in Europe, and subsequently lower temperatures world wide for 30 years. People who know that the oceans have an average temperature of +4°C, and a very complex structure would not be too surprised if the war at sea brought about a lot of changes and chaos into the system, suggesting reading the booklet at: http://www.1ocean-1climate.com/.
So like CO2, naval warfare causes warming and cooling. Got it.
smamarver: you’re implying that a few million tons of warm sunken ships and coal could have ANY impact on the Tra-Zillions of tons of ass cold ocean water?? Really??
Rather than focus on and debate the ridiculous… why not just accept the KNOWN and well documented period called the “little Ice Age”… after that bitter cold.. YES! Things warmed up a bit!!
Facepalm.
@Phillippe Jones: If all is so clear, why discussing climate change at all? As long as the warming period 1919-1939, and cooling period 1940-1970s are not thoroughly understood and explained, I am curios what climate science is talking about, and skeptics do not challenge them on these events!
Correlation is causation…
http://www.tylervigen.com/spurious-correlations
smamarver,
Are you aware that from the 1940’s – 1970’s, there was global cooling? How does that fit into your conjecture?
All that CO2 and smoke should have caused global warming, no?
Conversely, the rapid rise in CO2 over the past few decades should have caused lots of of global warming. But it didn’t; global warming stopped almost twenty years ago.
I think your conjecture needs some work.
smamarver, The ClimAstrologists can’t even explain the Dansgaard-Oeschger events. During full glaciation you get abrupt warmings. Between this interglacial and the last one back, the Greenland ice cores show 24 Dansgaard-Oeschger oscillations. These abrupt warmings occurred from just a few years to mere decades that average between 8-10C rises (D-O 19 scored 16C). The nominal difference between earth’s cold (glacial) and warm (interglacial) states being on the order of 20C.
If they can not explain NATURAL temperature swings of that magnitude then CAGW is nothing more than blowing smoke at the rubes the elite want to fleece.
@gator69: Any evident causation has a correlation!
That is a meaningless statement.
“Water is wet”. 😆
@ Gail Combs: Our interest should – at least my – focus on the question whether and how man can and has changed climate. The Arctic warming 1919-1939 saw an extreme rise in winter temperature, which indicates that the sea was the source, and naval war during WWI brought a lot of changes as already outlined above:“….. naval war changed the water structure (temperature and salinity) around GB, all flowing northwards, contributed to a shift in the water profile around the Fram Strait and Arctic Ocean.”, that is anthropogenic climatic change.”
@Smokey: The mechanism was indicated above: “The only period of global cooling since the LIA started in autumn 1939, few weeks after WWII begun, first causing extreme winters in Europe, and subsequently lower temperatures world wide for 30 years. People who know that the oceans have an average temperature of +4°C, and a very complex structure would not be too surprised if the war at sea brought about a lot of changes and chaos into the system, suggesting reading the booklet at: http://www.1ocean-1climate.com/.” An anthropogenic contribution is evident. Even if only by 1 percent, it should have been discussed since long, and thoroughly explained!
If I lived in the areas of east TX and west LA right now I would paying attention to this:
http://www.nhc.noaa.gov/xgtwo/two_atl_2d0.png
Joe gets right into this in his new Saturday Summary: http://www.weatherbell.com/saturday-summary-june-13-2015
Says it will hold together as it arcs to the NE coming in over my neck of the woods in Indiana late this week.
Been kept busy lately driving last week but yesterday had a day off. No way to get the yard mowed but between rains I did manage to get my hedges trimmed. Accuweather is miserably inaccurate when it comes to forecasting short term with pop up thunderstorms.
That NHC map is dated May 12??????
Still there over the Yucatan. Here is the most current:
http://www.nhc.noaa.gov/xgtwo/two_atl_2d0.png
http://www.nhc.noaa.gov/xgtwo/two_atl_2d0.png
Now this is weird: The map that is posting is not exactly the same as the one shown at the site: Try this link: http://www.nhc.noaa.gov/gtwo.php?basin=atlc&fdays=2
Thanks for the reminder.
During hurricane season I normally check that site every day.
I just don’t think it registered that it’s June already.
Going to the site now. I live in South Central Louisiana.
The disturbance is showing up on the NOAA site now
MASIE shows the Arctic sea ice extent is tracking closely to last year, despite the Blob:
https://rclutz.files.wordpress.com/2015/06/masie-day-163.jpg?w=1000&h=381
https://rclutz.wordpress.com/2015/06/02/arctic-ice-watch-june-daily/
If I remember correctly. blob or no blob, conditions in Alaska last year were similar to this year with warmer than average temperatures.
Interesting that UAH shows North Pole TLT air temperature is down slightly this May vs. May 2014.
Looks like at this particular time this years sea ice level is nearer 2008 than 2006. Of course that could easily change before long.
Hopefully this will display:
https://rclutz.wordpress.com/wp-admin/admin-ajax.php?action=imgedit-preview&_ajax_nonce=0846290797&postid=591&rand=93565
Nope! Even in a new window it just displays a single zero.(IE11)
Reblogged this on Centinel2012 and commented:
After over 30 years of it being drummed into us the the planet was going to melt and kill all of us we have lost the battle the under 45 people most all of them think we are crazy for not believing what we are being told. very few under 45 people i know think Al Gore is wrong and they will not believe anything to the contrary even when you show them Charts like these. I am told that I made them up when i try! Like this insane trade deal (which will pass) COP21 will result in an agreement!
We have become a land of Grubers.
So how come the seas have been warming up at 0-2000m and are consequently rising, without any hiatus, if there’s indeed a “pause” in warming? The skeptics are eerily silent on this one…perhaps their narrative is flawed?
The rate of sea level rise since the LIA has not accelerated at all.
There is ZERO evidence of extra thermal expansion above the general, thankfully, warming trend of the last couple of hundred years.
no they have not. there is no physical evidence for this whatsoever.
SILENT? I guess I have to post this again.
TEN STUDIES PROVING SEA LEVEL IS NOT RISING
STUDY #1
Mid to late Holocene sea-level reconstruction of Southeast Vietnam using beachrock and beach-ridge deposits
Translation the sea level was up to 1.5 meters higher than today in a tectonically stable area ~5000 years ago to 2000 years ago.
STUDY #2
Sea-level highstand recorded in Holocene shoreline deposits on Oahu, Hawaii
This study shows a sea level highstand ~1.6 meter above the present level from ~5500 years ago to 2000 years ago.
STUDY #3
Late Quaternary highstand deposits of the southern Arabian Gulf: a record of sea-level and climate change
This study shows a sea level highstand ~1 to 2 meters above the present level about ~5500 years ago.
STUDY #4
The Quaternary Geological History of the Santa Catarina Southeastern Region (Brazil) 1999
The first part discusses drilling in several locations and analyzing samples. They mention dating prior to that was guesses. “…. A drilling campaign done in the domain permitted the sampling of material for 14C datings, and the obtained data confirmed some previously assumed ages. The sequence of events, that originated the Holocene deposits, has been also reconstructed through drilling and 14C dating of the collected peat and shell samples…”
In the body of the text is this:
This study shows a sea level highstand ~ 4 meters above the present level about ~5000 years ago. With sea level oscillating since then. Not only has the sea levels have dropped since the Holocene Optimum the evidence shows that “warmer paleotemperatures were favourable for great proliferation of mollusks in the area”
Santa Catarina brazil is at latitude 27.2500°S.
STUDY #5
Holocene sea-level change and ice-sheet history in the Vestfold Hills, East Antarctica
The above is a RELATIVE sea level. The area is not tectonically stable because the area has isostatic uplift in response to deglaciation from the Wisconsin Ice Age. The same applies to the following study.
STUDY #6
A new Holocene relative sea level curve for the South Shetland Islands, Antarctica
nora(DOT)nerc.ac.uk/15786/
VALIDATION BY ALTERNATE STUDIES
STUDY #7
Ice free Arctic Ocean, an Early Holocene analogue
STUDY #8
Temperature and precipitation history of the Arctic
STUDY #9
A new approach for reconstructing glacier variability based on lake sediments recording input from more than one glacier January 2012
ANOTHER THIRD METHOD OF VALIDATION
STUDY #10
Sea Level Changes Past Records and Future Expectations
Gail, I would say, this shows up the “cfgj” narrative as being flawed !
Have the ClimAstrologists corrected for the 18.6-yearly Luna Nodal cycle? Linear trend lines on sinusoidal curves are very time dependent.
The Dutch who are the most concerned about actual sea level rise have found the cycle.
This graph at WIKI is often used to show sea level rise over the Holocene.
http://upload.wikimedia.org/wikipedia/commons/1/1e/Holocene_Sea_Level.png
One problem is the sea level data is not raw data but adjusted data.
The second problem is the earth has been cooling since the Holocene optimum, glaciers have re-established and the sea level has FALLEN as I showed in those ten studies above. The reason this fall of ~1 to 2 meters is not shown in the graph is because the Santa Catarina outlier, high above the graph is included.
Santa Catarina
The next question is Brazil tectonically stable?
The Brazilian Shield is tectonically stable. The last orogenic cycle to affect it occurred > 600 million years ago.
Any uplift is extremely slow.
Campo Formoso is in the state of Bahia in the North-East region of Brazil. Lagoa Santa is in the mid region inland and a bit north of Rio de Janeiro on the east coast and Santa Catarina is on the coast south of Lagoa Santa.
I am not the only skeptic who has not been silent:
spangled drongo said on April 29, 2015 at 12:47 am
Actually there was no sea level rise until, like the temperature data it was ‘adjusted’ to GIVE a RISE!
Dr. Niv Shaviv had “…a paper accepted in the Journal of Geophysical Research. Since its repercussions are particularly interesting for the general public, I decided to write about it…”
(Several graphs from the paper are shown and a link to the actual paper.)
chuckle..
You know that this putz won’t bother reading one single word of any of this, don’t you. 😉
He CANNOT let any facts interfere with his “belief”.
To add to Dr Shaviv’s ocean calorimeter study:
What he assumes the reader knows is that the sun, not CO2 warms the ocean.
http://lasp.colorado.edu/home/sorce/files/2011/09/fig01.gif
A closer look at the depths to which solar radiation penetrates:
http://www.klimaatfraude.info/images/sverdrup.gif
Note that the ocean is most affected by the shorter wavelengths of radiation.
Since I have already posted studies showing that glaciers are re-establishing over the last 800 years, that leaves thermal expansion due to energy from the sun. By insisting that sea levels are rising in the face of the increase in ice in Greenland and Antarctica, all the ClimAstrologists are doing is PROVING It’s the Sun Stupid!
A History of Solar Activity over Millennia
If you have no tread this paper, I would suggest you do so. for the following reason.
cfgj says:
“So how come the seas have been warming up at 0-2000m and are consequently rising, without any hiatus, if there’s indeed a “pause” in warming?”
Your premise is wrong. Oceans have not been warming (within the margin of error; AKA: exceeding the error bars).
Even if we accept the dubious number of 0.023ºC/decade warming, that is less than a quarter of a degree per century. Are you worried? Don’t be. That minuscule warming would be entirely beneficial.
Next, even the recent head of the UN/IPCC states that global warming has been in a “hiatus” for many years. Many other Warmists admit that global warming has stopped. So you are making a baseless assertion when you say “without any hiatus”.
Next, the sea level rise is not accelerating, as had been widely predicted. In fact, SL rise may be decelerating. It may even be non-existent.
Finally, here’s a question for you: what, exactly, would it take to convince you that the “dangerous man-made global warming” scare is a false alarm?
Would a full TWENTY YEARS of no global warming convince you?
Would you be convinced if Arctic ice exceeded its 30-year average?
Or, what if a great new Ice Age began, and like it has before, global temperatures declined by 2º – 3º within a decade or two?
Or could nothing ever convince you that “dangerous man-made global warming” is a hoax?
Just wondering where you draw the line…
UK Royal Society says 50 years of zero warming before they admit they were wrong.!
This religious zealotry is really quite bizarre !!
I doubt record Arctic ice would do it. The Arctic and Antarctic seem to mirror each other, with one rising while the other falls. Assuming that pattern continues, record northern ice would mean less southern ice, which would once again “prove” global warming. You’d just stop hearing about the Arctic, just like we don’t hear much about the Antarctic today. You’d even be called a kook if you mentioned the growing Arctic ice, because the “real” problem would then be at the other end of the Earth. From a practical perspective, the south has always been far more important. But from a religious perspective, it’s been committing heresy lately.
Seems like I need to repeat myself: The possible “hiatus” in warming is only in the atmospheric temperatures, while a LOT of extra heat has been heating the oceans without ANY kind of pause. The fact that the oceans and therefore the planet has been warming up without a pause indicates that there’s a small energy-imbalance between Earth and space, exactly as AGW predicts.
Your repetition of nonsense does not make sense. You have still not provided any proof of your refuted claims, only artifacts. We OTOH, have repeatedly shown your claims to be nonsense, with facts.
You are possibly the most blinkered and obtuse person I have ever encountered. Obviously you did not deign to notice, let alone read Gail Combs’s posts.
Your posts are as empty as your mind.
You have nothing.
The ONLY heat going into the oceans is from the sun.
And that extra energy from strong solar cycles in the latter half of last century has ENDED!!
Dear cjgj,
The greenhouse effect is in the atmosphere. By definition, the atmosphere must warm, or it’s not the greenhouse effect.
Love,
Morgan
“Obviously you did not deign to notice, let alone read Gail Combs’s posts”
David, Its not that he didn’t even try to read them..
He would never have understood them anyway. !
By the quality of his posts, he is barely out of low-end junior high.
Where’s Jim, complaining about missing ice cubes??
His employment as a mouthpiece for the Exeter Uni climate bletheren has either not started for this week…
…. or he has been sacked for blatant incompetence.
Well since the 2012 arctic ice is close to 2006 now he has slunk away. Sure he’ll show up again if we getting a spurt of melting.
Do you think I’ll ever get him to admit that the Arctic temperature is only just a little bit above the coldest period in the last 10,000 years, and that for most of the Holocene the Arctic was 2-3C warmer?
I means, it like he’s handing me a cosh and asking me to use it on him every time he pokes his head up.. sort of like wack-a-mole… bizarre !!
Jabber-the-Hunt is somewhat conspicuous by his absence.
Perhaps he’s occupied praying for an Arctic Cyclone to push a bit of the un-melted ice out of the Arctic basin.
Or, Jabber-the-Hunt might be providing some technical assistance with Reggie’s endlessly trouble-plagued, “Brawndo-Fueled Blowtorch of Arctic Ice Armageddon”….. That outta sort it.
He’s busy taking food out of the mouths of the poorest and most at risk. Millions to deny…
Well if things keep up the way they are at the other end of the earth mother nature will be taking food out of the mouths of scientists at some Antarctic research stations because of the increasing sea ice. Then they will have to move to another location so the fossil fueled ice breakers can get through to bring them food and the fossil fuel they need to keep warm so they can continue to write about how the ice at the southern polar regions is melting away. It’s looking like that climate refugee thing may actually happen after all!