
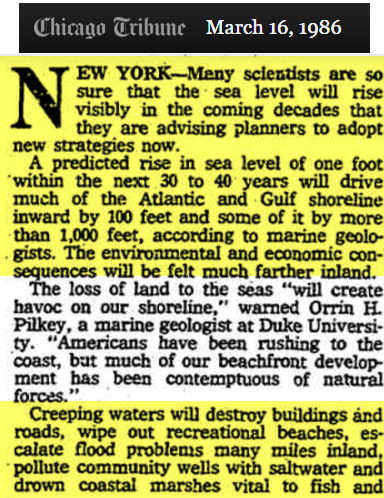
In 1986, scientists were “sure” that sea level would rise one foot on the East Coast in 30-40 years, and destroy beaches and buildings, receding shorelines by 1,000 feet.
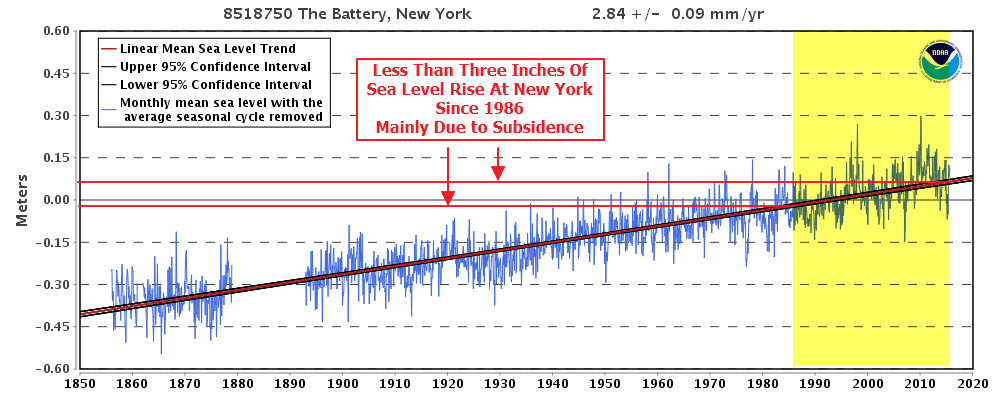
So how did they do? There has been less than three inches of apparent sea level rise, most of which is due to land subsidence rather than actual sea level rise.
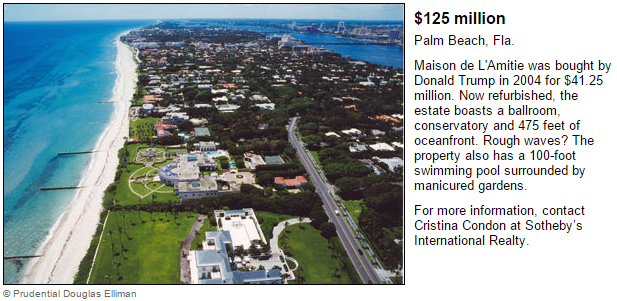
People are so worried about sea level rise in Florida, they are paying $125 million for beachfront homes.
Climate scientists have demonstrated repeatedly that they are completely incompetent buffoons. They have no idea what they are talking about, and have no business being involved in government, or being quoted by the press.

So how did they do? Doesn’t matter, they just keep on predicting bullshit. Here’s the top item on a Google News Search for “Sea Level”:
NASA’s Kennedy Space Centre under threat from sea level rise
http://www.abc.net.au/news/2015-11-04/kennedy-space-centre-sea-level/6842304
“NASA predicts that if the Antarctic and Greenland ice sheets continue melting at their current rate, sea levels off the coast of the Kennedy Space Centre will rise up to 60 centimetres by the 2050s and 124 centimetres by the 2080s.”
Really 60 cm by 2050? comes to 17 mm/yr every year for the next 35 years, and then 124 cm by 2080 requires an acceleration to over 20 mm/yr.
Do these people at NASA ever run the numbers.
Didn’t you just tout NASA’a research showing the Antarctic ice sheet growing more than it is shrinking? Why is NASA right about that but wrong about sea level?
I forgot to mention, the current rate at the TRIDENT PIER, PORT CANAVERAL tide gauge
http://www.psmsl.org/data/obtaining/stations/2123.php
station is 4.3 mm/yr.
Your ABC report got it wrong. This is what NASA said:
“In a review of the agency’s vulnerability to sea level rise, NASA’s Climate Adaptation Science Investigators (CASI) Working Group recently wrote:
Sea level rise of between 13 and 69 centimeters by the 2050s is projected for NASA’s five coastal centers and facilities…Even under lower sea level rise scenarios, the coastal flood event that currently occurs on average once every 10 years is projected to occur approximately 50 percent more often by the 2050s in the Galveston/Johnson Space Center area; 2 to 3 times as often near Langley Research Center and Kennedy Space Center; and 10 times more frequently in the San Francisco Bay/Ames Research Center area. NASA coastal centers that are already at risk of flooding are virtually certain to become more vulnerable in the future.”
http://earthobservatory.nasa.gov/Features/NASASeaLevel/
Why go to an Australian TV website to find out what NASA said? Why not go to NASA?
Your NASA quote says 69 cm by the 2050s. The ABC article says 60 cm by the 2050s. What’s your point?
I do a daily news search on sea level and report my findings on blogs and comment sections as appropriate. ABC.au is part of the “Main Stream” media and spews bullshit.
No, Steve, read it again. It says “Sea level rise of between 13 and 69 centimeters by the 2050s is projected for NASA’s five coastal centers and facilities…” BETWEEN 13 AND 69 CM. The current rate of 4.3 mm/yr will be above 13 CM, yes?
You were criticising NASA, not the ABC. Wise up and get your quotes about NASA from NASA, where the actual quotes are.
NASA’s forecasts are meaningless propaganda. The only interesting thing from the recent study is their current measurements.
Martin Smith said November 4, 2015 at 1:05 pm
The current rate of 4.3 mm/yr will be above 13 CM, yes?
That’s right, IF the rate remains at 4.3 the rise would be 13 cm by 2044. But you ignore the fact that NASA says it could be as much as 69 cm by the 2050s. Which is ridiculous. If you did any analysis of tide gauge data you would know that the rate varies widely over time. For example Florida’s Fernandia Tide Gauge active since 1898 has a negative 30 year rate of minus -1.7 mm/yr the period ending 1932 and for the 30 year period ending in 1953 the rate was 5.3 mm/yr. The current 30 year rate is 1.9 mm/yr and the overall rate since 1898 it is 2.0 mm/yr. The Key West tide gauge goes back to 1913 and shows similar variations.
The Port Canaveral tide gauge record only goes back 20 years, so it’s difficult to understand where NASA comes up with the numbers they do based on any sort of empirical record from tide gauges. In order to get to their high estimate of 69 cm by the end of the 2050s the rate would have to average almost 16 mm/yr. When is this miraculous acceleration going to begin to happen?
Speaking of acceleration, those two tide gauges, Fernandia and Key West, have accelerations
over the last 60 years of -0.09 mm/yr² and 0.002 mm/yr² respectively.
Steve Case says: If you did any analysis of tide gauge data you would know that the rate varies widely over time.
The Dutch seems to have found it. For some unknown reason they seem to want to study and measure sea level?
And have they found what they call “the 18.6-yearly Luna Nodal cycle.”
Local Relative Sea Level
To determine the relevance of the nodal cycle at the Dutch coast, a spectral analysis was carried out on the yearly means of six main tidal gauges for the period 1890–2008. The data were corrected for atmospheric pressure variation using an inverse barometer correction. The spectral density shows a clear peak at the 18.6 -year period (Figure 1). The multiple linear regression yields a sea-level rise (b1) of 0.19 +/- 0.015 cm y-1 (95%), an amplitude (A) of 1.2 +/- 0.92 cm, and a phase (w) of -1.16 (with 1970 as 0), resulting in a peak
in February 2005 (Figure 2). No significant acceleration (inclusion of b2) was found.
CONCLUSIONS
Coastal management requires estimates of the rate of sealevel rise. The trends found locally for the Dutch coast are the same as have been found in the past 50 years (Deltacommissie, 1960; Dillingh et al., 1993). Even though including the nodal cycle made it more likely that the high-level scenarios would become apparent in the observations, no acceleration in the rate of sea-level rise was found. The higher, recent rise (van den Hurk et al., 2007) coincides with the up phase of the nodal cycle. For the period 2005 through 2011, the Dutch mean sea-level is expected to drop because the lunar cycle is in the down phase. This shows the importance of including the 18.6-year cycle in regional sea-level estimates. Not doing so on a regional or local scale for decadal length projections leads to inaccuracies.
http://www.bioone.org/doi/pdf/10.2112/JCOASTRES-D-11-00169.1
Seems that linear trend lines on sinusoidal curves are very time dependent.
“NASA’s forecasts are meaningless propaganda. The only interesting thing from the recent study is their current measurements.”
Steven, you have made yet another claim with no supporting evidence. You continue to post evidence that data has been adjusted, despite the fact that the original data, the explanations for the adjustments and the adjustments themselves are all publicly available. You equate the fact that data has been adjusted with fraud. At no time do you ever post any evidence that any adjustment to any dataset is even incorrect, let alone fraudulent. I keep asking for your evidence that an adjustment is incorrect, and all you do is post more examples of adjustments.
The “meaningless propaganda” here would appear to be your blog posts. Post something that proves a data adjustment is incorrect. At least we could discuss that.
Steve Case: “But you ignore the fact that NASA says it could be as much as 69 cm by the 2050s. Which is ridiculous. If you did any analysis of tide gauge data you would know that the rate varies widely over time.”
I don’t ignore it, Steve. It’s just that it isn’t relevant to the discussion. You posted an article by the ABC which you obviously believed. I proved that what the article claimed NASA said was wrong. NASA did not say what the ABC article (and you, because you posted it) claim NASA said. In fact, I posted what NASA actually said, and what NASA actually said is correct, when we read it using the data you yourself published.
It doesn’t matter that you think 69cm is ridiculous. It is the upper bound of a range that is wide because of the uncertainty in the measurements. But the rate itself is increasing globally, so NASA is right to be concerned about the future of its launch pads near the ocean.
“You equate the fact that data has been adjusted with fraud. At no time do you ever post any evidence that any adjustment to any dataset is even incorrect, let alone fraudulent.”
Check the amount of adjustment.
Check the claimed accuracy of adjusted data.
Justify how adjustments made in bulk, based on statistical properties of the data itself, can result in confidence levels tighter than those same adjustments. You can’t do so in a scientifically or mathematically defensible way – period.
It is fraud to claim otherwise.
NOAA and NASA make such claims.
Therefore, making the claim that these are fraudulent adjustments is fully justified.
But Steven, sea level rise is already causing problems there. We will have to take your news article as correct, I suppose, but there must be some reason why you are using newspaper articles instead of scientific papers. Can’t you find any scientific papers that predict a 1 foot sea level rise in Southern Florida by 2016? If that’s your problem, maybe it’s because no scientific research actually projected that much sea level rise in Florida in so short a time. Sea level is rising, though, and southern Florida is in trouble, as predicted.
The only problem sea level rise is causing in Florida is people lying about it.
Short-sighted, Nick.
Good one.
“Sea level is rising, though, and southern Florida is in trouble, as predicted.”
Evidence, please? Do you live in southern Florida?
Evidence: http://earthobservatory.nasa.gov/Features/NASASeaLevel/
I don’t live in southern Florida.
Florida has lost significant land area beginning with the end of the last glacial about 20K years ago. Prior to the European invasion, Florida was able to support a human population of about 100K inhabitants, who relied on mounds to survive storm flooding.
As is typical with warmists such as yourself, I see little evidence in your link. I do see a lot of model projections and speculation which are NOT evidence of anything.
Here is the tide gauge for Key West. (Others are available for southern Florida)
http://tidesandcurrents.noaa.gov/sltrends/sltrends_station.shtml?stnid=8724580
Let me know if you spot anything unusual.
Your own comrade, Steve Case, posted the current sea level rate: 4.3 mm per year. That rate has increased, and the number of flood days in Miami is increasing. If you really believe Florida isn’t in any trouble because the sea level is rising, I really think you are not seeing the forest for the trees. In any case, Miami is installing bilge pumps, in case you are wrong.
Sea level has been rising for 20,000 years, and is rising slower now than during most of that time. Only a complete moron would believe that it started rising due to a lack of taxes 20,000 years ago.
Steven, you have proved many times that I am a complete moron, so there is no need to keep calling me one. But globally, the rate of sea level rise is increasing, and southern Florida is already experiencing flooding problems because of that. You still haven’t shown that any scientist in a scientific paper predicted a foot of sea level rise for Florida by 2016. You are fond of dredging up newspaper articles, but the articles contain now references that can be checked. You do that a lot. Why? Why not confine your argumentation to actual science?
There’s only one way for sea level to stop rising. It’s isn’t carbon taxes, or wind turbines killing hundreds of thousands of birds and bats, or solar arrays costing taxpayers billions, or bio-fuel, or psychotic liberals screaming for the execution of anyone who doesn’t believe their Stalinistic bullshit, or corrupt scientists pulling data outta of their asses..
It’s another ice age.
It never ceases to amaze me that the Warmists want to yank the only thing they say will keep us out of the next ice age and stuff it underground when we are at the very tail end of the Holocene. (The Holocene interglacial is now 11,717 years old. That’s two centuries or so beyond half the present precession cycle (or 23,000/2=11,500). So the little Ice Age was about the right time for glacial inception. However we had the Modern Grand Solar Minimum – A History of Solar Activity over Millennia that yanked the earth back into the warm mode. )
Martin writes “But globally, the rate of sea level rise is increasing… but the articles contain now references that can be checked.”
Be specific. What formula expresses the current rate and increase in rate of sea level rise? If you cannot quantify it, why do you believe it? If you CAN quantify it, do so please.
Please give a bit of respect to Plate Tectonics PT!
If we keep Co2ing and melting & solar radiationing and leave out PT we are whining about the air conditioner without checking oil in the motor of our 1,000 mile an hour space craft.
10 year period from 1964 to 1974 in my academic experience saw scoffing at to total acceptance of PT.
Why?
US placed seismometers all over the world to fact check underground nuclear weapons testing treaty.
Result PT
Your support would be appreciated in compiling weather pattern changes to seismic activity.
While horrible drama especially human loss after earthquakes and tsunami.
Florida is exceptional in many ways…including unique PT relationship.
In sum we should plan on history.
Make sure our seat belts are easy to put on and easy to take off in event of roll over!
And it’s not just beachfront homes:
http://www.newmiamiblog.com/2013/01/30/optimistic-outlook-for-south-florida-construction-industry-in-2013/
http://www.miamidade.gov/portmiami/library/2035-master-plan/executive-summary.pdf
Somehow, the message of a looming sea-level rise catastrophe isn’t getting through to the city planners of Miami. There is a tremendous amount of development money in South Florida – sea-level be darned. So we have two competing forecasts for South Florida. It’s a kind of a wager on the future.
On one side of the bet are the city planners, developers, construction / architectural firms; not to mention all the various financiers, bankers and money people along with the real-estate middlemen, civil engineers… you get the picture. These folks are gambling that sea-level rise will be about the same as it has been – and if it varies it won’t be by much and mitigation plans will suffice in any case.
On the other side of the bet, are the Climate Cassandras; computer modelers, rent-seeking legal parasites, publicity whores masquerading as some sort of “Climate Scientist”, federal level politicians, along with their wholly corrupted science agencies, and the usual contingent of swivel-eyed end-of-times lunatics. Did I forget useful idiots? Yes. And useful idiots. These folks are gambling that sea-level rise will be catastrophic.