
NOAA’s climate criminals claim sea level is rising almost twice as fast as their sea level people do.

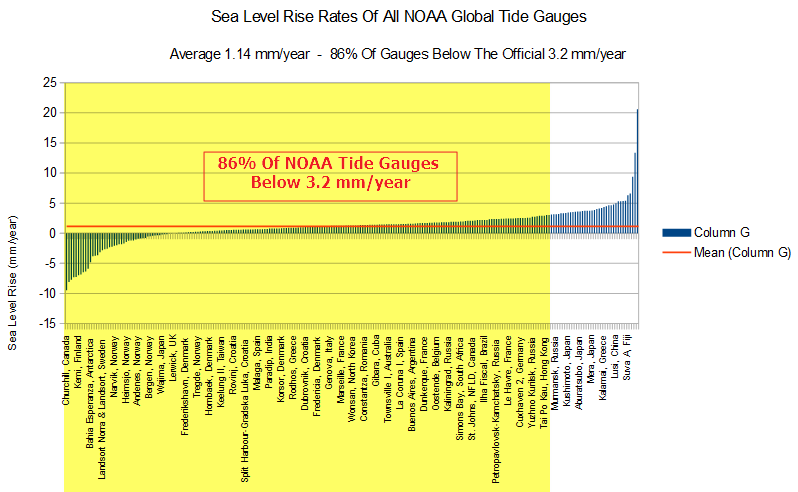
NOAA’s climate people claim that sea level is rising 3.2 mm/year. Their sea level people say it is just over half that.
the absolute global sea level rise is believed to be 1.7-1.8 millimeters/year.

As I reported earlier, NOAA made the sea level page above disappear yesterday. But it won’t do them any good, because it is on the web archive and because anyone can look at their actual sea level data.
NOAA has 240 tide gauges globally, and 86% of them show less sea level rise than the claimed average of 3.2 mm/year. The average of all of the NOAA tide gauges is 1.14 mm/year, just over one third of the NOAA climate claims.
tidesandcurrents.noaa.gov/sltrends/MSL_global_trendtable.html
Make no mistake about it, NOAA’s climate people are engaged in fraud.

Steven, I’m guessing you used a bookmark. If you go to the website and click on the Historic Data selection, you get this message:
ErrorCO-OPS is currently operating in offline (non-database) mode. Only the last 72 hours of observations for real-time stations are available at this time. No station information or historic data are available. CO-OPS will return to normal operations as soon as possible, and regrets any inconvenience this outage may cause. For more information, please contact our user services group at CO-OPS User Services.
Please see our real-time active currents stations.
You should learn to ask for help before going off on a tangent.
That has nothing to do with this topic. Their site is up, they removed the page showing 1.7 mm/year. Your endless FUD is sickening.
Dear Steven,
I have sent a query to NOAA on your behalf.
Your friend,
Martin
roflmao..
You really are a queerie !!
What did you ask them…
did you ask them why and who is paying them to fabricate a warming trend..
did you ask them for some actually proof that CO2 causes warming.?
or did you ask them if they could send you some more brain-washing kool-aide. !
Andy, I asked NOAA where I can find the data and why isn’t it where it was earlier. Then I looked around a bit and discovered the database is offline, and NOAA apparently knows about it and is working on getting it back online. Apparently neither Steven nor you thought to be proactive and ask NOAA. Now, it’s the weekend, so we probably won’t get an answer for a few days, but NOAA has acknowledged receipt of my query.
Yawn..
Funny how often they go off-line when a page with “inconvenient” data is linked to. 😉
But the data is there on the internet.. it takes a very big effort to erase it completely.
Now.. do you have something actually worthwhile to say ?
Andy, I have refuted Steven’s claim of fraud by showing that the database is offline. I don’t have to say anymore until Steven admits his error. He has also made a second, more egregious error, which you appear to have been fooled by. He is using tide gauge data that doesn’t have the vertical land movement taken out. He is using this data to compare to the global average sea level, which is computed from data where the vertical land movement has been taken out. The two datasets aren’t comparable unless and until the vertical land movement is removed.
Wow !!!!!! Martin got an auto-reply !!
Must be serious !!
roflmao !!!
“I don’t have to say anymore ”
Good.. because you are a waste of time and space. !!
Martin, the stable land sea level data shows an almost constant rate of less than 2mm/year.
NO acceleration.
NO CO2 warming signature.
Get used to it. 🙂
You’re wrong, Andy. I have explained why.
You are wrong.
The REAL tide data proves that to be the case, no matter what fabrications NOAA wants to add to it.
Again…..Why are you so scared of 3.2mm/year ??????
(especially when you know the real value is probably about half that)
Andy, the real value is 3.2 mm/year.
No, the real value is well less than 2mm/year.
The 3.2mm/year is a NOAA fabrication, just like GISS, GHCN etc etc
Andy, have a look at the this page: http://sealevel.colorado.edu/
It explains all the things you clearly don’t understand about computing global average sea level.
Colorado Uni.. now you really have me laughing. 🙂
Paid apostles of the AGW agenda. !!!
Here is some research from someone who actually know about this stuff..
http://scienceandpublicpolicy.org/blog_watch/sea_level_is_not_rising.html
Andy, you are doing the same thing Steven is doing. You can’t prove fraud by assuming fraud. You can’t dismiss this institution http://sealevel.colorado.edu/ by assuming the scientists who work there are committing fraud.
Now you are claiming that CU, AVISO, CSIRO, NASA GSFC, and NOAA are ALL committing fraud. You are claiming that ALL the scientists studying sea level rise at ALL these institutions have gotten ALL their research wrong, and they did it on purpose because they are government employees. And you are claiming that this one guy, Nils-Axel Mörner, has got it right. Can you see how silly you look saying that? What do you base your belief on?
Glad you mentioned the word fraud..
Obviously on your mind.
Andy, here is the explanation for why your understanding is wrong:
http://sealevel.colorado.edu/faq#n3134
I repeat , because you are obviously very hard of understanding…
The stable tide data shows a trend of less than 2mm/year.
It is only the erroneous fabrications of NOAA, picked up by the rest of the cultists, that shows a massively scary 3.2mm/year.
Quick.. head for the hills..
oh wait.. all the climate glitterati buy at near sea level…. funny about that. 😉
Andy, here is the explanation for why your understanding is wrong:
http://sealevel.colorado.edu/faq#n3134
This is the REAL DATA.. not from UColorado’s fabrications.
http://realclimatescience.com/wp-content/uploads/2015/08/ScreenHunter_2763-Aug.-27-12.31.gif
See that middle section.. that is the stable tide gauges and they average well less than 2mm/year
You can repeat your lies as often as you like, but NOAA’s own data and own statement say that the sea level rise is well less than 2mm/year.
End of story
Andy, this explains why you are wrong: http://sealevel.colorado.edu/faq#n3134
Martin, Please notify us when NOAA re-instate the hidden page. that says….
quote
the absolute global sea level rise is believed to be 1.7-1.8 millimeters/year
Rest assured, I will, Andy. Meanwhile, this explains why you are wrong: http://sealevel.colorado.edu/faq#n3134
Martin, you are truly a broken record of lies and warmista propaganda.
You seem to have been assigned to troll this website/blog, and sow lies in a systematic way.
But you will find your time is completely wasted, as everyone who reads here regularly knows the truth, and is working hard to spread the word.
You are on a sinking ship martin, and you may want to think about finding a survival suit and manning a lifeboat.
I suggest you contact your handlers and report your utter failure to sway a single solitary soul with your phony BS.
wait, they actually reply to your emails? I had sent the NOAA 3 emails requesting clarification of the charts that SG and other’s post, particularly how the charts were apparently changed .. I needed a response from them because I was writing an article for the local newspaper about the maunder minimum and the preponderance of the evidence seems to show cooling since appox 2000.. I got nothing, you would think they would have an entire section dedicated to responding to questions about old/new graphs, they don’t and neither do sites like skepticalscience skeptical science does not take this issue head-on. because then they would be forced to upload the NOAA.NASA, IPCC’s old charts onto their own site and they don’t wanna do that because that would turn the average person into a ‘skeptic’
It does have to do with this topic, Steven, because the data you are missing is in the database that is currently offline.
Odd about that.. as soon as SG links to it.. off-line it goes. 😉
But that “inconvenient” data is still available.
And it shows that the general sea level rise, according to NOAA tide gauges, averages somewhere LESS THAN 2mm/year.
How SCARY is that , hey !!!!
Are you PANICKING yet, Martin ?
Andy, you can’t use the data the way you are using the data. You have to take out the vertical land movement. Your remarks are incorrect.
No Martin. your remarks are incorrect.
The sea average tidal sea level rise shows a rate of LESS THAN 2mm/year.
Can you keep up with that?
Andy, you have to read the explanation of what the data is. The explanation is on this page: http://tidesandcurrents.noaa.gov/sltrends/sltrends.shtml Scroll down to Products. Read that paragraph. It explains why Steven and got this all wrong.
Their own data proves that SG is correct,
End of story.
Answer me again.. why is even the fabricated 3.2mm/year so darn SCARY to you ?
>Their own data proves that SG is correct,
Nope. Steven got it wrong because he is using data that contains vertical land movement.
>Answer me again.. why is even the fabricated 3.2mm/year so darn SCARY to you ?
It isn’t fabricated and it isn’t scary. It is measured by satellite altimeters. It is problematic because it is causing the number of flood days per year to increase for cities like Miami and Boston.
Again, I invite everybody to got to
http://tidesandcurrents.noaa.gov/sltrends/sltrends.shtml
click on Global and see that the vast majority of stable tidal gauges are well less than 3mm/year.
the average of 3.2mm/year is a FABRICATION.
Martin knows this, but is trying cover up the fact with bluster and other BS.
And, have a look at this page. It explains all the things you clearly don’tunderstand about computing global average sea level: http://sealevel.colorado.edu/
“causing the number of flood days per year to increase for cities like Miami and Boston.’
ROFLAMO..
So these places can’t manage a sea level rise of 3.2mm/year (or in reality, about half that)
That is SERIOUSLY PATHETIC !!!!
perhaps they shouldn’t take so much water from underground.. then they wouldn’t be sinking !!
Oh wait.. you didn’t know that, did you.. !
Andy, the number of flood days per year is increasing in both Boston and Miami. Have a look at this website: http://sealevel.colorado.edu/ It explains everything you clearly don’t understand about computing global average sea level.
Colorado Uni.. now you really have me laughing. 🙂
Paid apostles of the AGW agenda. !!!
Here is some research form someone who actually know about this stuff..
http://scienceandpublicpolicy.org/blog_watch/sea_level_is_not_rising.html
Andy, you are doing the same thing Steven is doing. You can’t prove fraud by assuming fraud. You can’t dismiss this institution http://sealevel.colorado.edu/ by assuming the scientists who work there are committing fraud.
Now you are claiming that CU, AVISO, CSIRO, NASA GSFC, and NOAA are ALL committing fraud. You are claiming that ALL the scientists studying sea level rise at ALL these institutions have gotten ALL their research wrong, and they did it on purpose because they are government employees. And you are claiming that this one guy, Nils-Axel Mörner, has got it right. Can you see how silly you look saying that? What do you base your belief on?
glad you mentioned fraud.
I would have used the word “collusion” or brain-washing or paid simpering.
The stable tide gauges show less than 2mm/year.
End of story.
“What do you base your belief on?”
On the tide data. not some NOAA fabrication.
the stable tide data shows less than 2mm/year.. and there is absolutely NOTHING you or anyone else can do about it, no matter how much you prance about and bluster. !
Andy, here is the explanation for why your understanding is wrong:
http://sealevel.colorado.edu/faq#n3134
Wrong Martin.
Look at the REAL DATA
http://realclimatescience.com/wp-content/uploads/2015/08/ScreenHunter_2763-Aug.-27-12.31.gif
See that middle 2/3, that is the stable tide gauges, and they average well less than 2mm/year.
No amount of Colorado fabrication can get around that fact.
Andy, this explains why you are wrong: http://sealevel.colorado.edu/faq#n3134
NOAA’s statement on their “removed” page was an over-estimate’
the absolute global sea level rise is believed to be 1.7-1.8 millimeters/year
Its actually LESS than that according to their own data.
http://realclimatescience.com/wp-content/uploads/2015/08/ScreenHunter_2763-Aug.-27-12.31.gif
You are comparing incomparable things, Andy. This explains why you are wrong: http://sealevel.colorado.edu/faq#n3134
Poor boy, you actually need to download and read this publication.
http://scienceandpublicpolicy.org/blog_watch/sea_level_is_not_rising.html
Then you might have some vague idea what you are talking about.
Until then you are stuck with the paid propaganda from UC, which is contradictory to NOAA’s own statement and data.
Your choice.. remain ignorant or learn.
I know what you will choose.. 😉
I have done, Andy. You can’t be serious that an unreviewed paper by one guy can overturn all the science of all the scientists at CU: 3.3 ± 0.4 mm/yr, AVISO: 3.3 ± 0.6 mm/yr, CSIRO: 3.3 ± 0.4 mm/yr, NASA GSFC: 3.2 ± 0.4 mm/yr, and NOAA: 3.2 ± 0.4 mm/yr. This explains why you are wrong: http://sealevel.colorado.edu/faq#n3134
They are all linked in together using the same fabricated nonsense.
the real data from long term stable tide gauges shows well less than 2mm/year.
They can adjust and fabricate all they want, but the data is the data.
End of story
You demand that I believe that ALL the scientists at ALL these institutions are on the take. You can’t be serious that an unreviewed paper by one guy can overturn all the science of all the scientists at CU: 3.3 ± 0.4 mm/yr, AVISO: 3.3 ± 0.6 mm/yr, CSIRO: 3.3 ± 0.4 mm/yr, NASA GSFC: 3.2 ± 0.4 mm/yr, and NOAA: 3.2 ± 0.4 mm/yr. This explains why you are wrong: http://sealevel.colorado.edu/faq#n3134
“It isn’t fabricated and it isn’t scary. It is measured by satellite altimeters.” So you warmists trust the satelite data regarding tides, but the satelite data that shows temps have been steady for 18+ years……….not so much.
Tony Heller obviously has some people worried.
One can only wonder why they sent Martin, ineffectual troll that he is.
Menicholas,
The Warnistra have very few scientifically trained people to dedicate to trolling. They have already tried David the Appalling and Jan Pearl before the witzless and gotten know where. Hope for Peace was really fun to play with, though it isn’t nice to bearbait the mentally impaired.
The problem they have is most amateur skeptics have good scientific and engineering training and are much better informed than the emotive liberal arts types they can get as trolls. That is why they have had to resort to banning skeptic comments and refusing to print skeptic articles.
The data shows I am right.
Adjustments and fabrications are the mainstay of the climate scammer,…. and you keep falling for it.
The data is the data.. End of story.
You demand that |I believe that ALL the scientists at ALL these institutions are on the take. You can’t be serious that an unreviewed paper by one guy can overturn all the science of all the scientists at CU: 3.3 ± 0.4 mm/yr, AVISO: 3.3 ± 0.6 mm/yr, CSIRO: 3.3 ± 0.4 mm/yr, NASA GSFC: 3.2 ± 0.4 mm/yr, and NOAA: 3.2 ± 0.4 mm/yr. This explains why you are wrong: http://sealevel.colorado.edu/faq#n3134
The data shows I am right.
Adjustments and fabrications are the mainstay of the climate scammer,…. and you keep falling for it.
LOOK AT THE REAL DATA.. Can you at least try?
What does one thing you said have to do with the post, what the tide gauges show, and the absolute SL rise reported by NASA?
David, Steven is claiming fraud by NOAA because a web page he uses isn’t accessible. The reason the web page isn’t accessible is the database system it comes from is offline. A missing web page is not evidence of fraud, especially when the database system that generates it is offline.
Not what he said. He has shown how they consistently adjust the data upwards for bogus reasons; such as the assumption that the ocean basin is increasing, and other unexplained changes like the linked blink graphics. There are several peer reviewed studies that show no increase in SL rise rate, and the tide gauges are likely more accurate for numerous reasons. Yes, the land rises and sinks, depending on where one is. Have you read Dr. Morner’s SL report? He is one of the most published L specialists in the field.
Martin, you are either a paid troll, or the most gullible fool to show up here in quite some time.
Which is it Martin…liar or fool?
You can avoid answering me forever if you wish.
Everyone reading here knows that you have not refuted ONE SINGLE FACT!
All you have is mealy-mouth nonsense and endless repetition of the same silly crap.
You do not even appear to actually have any knowledge, as every post you have made, to date, is a cut and paste link to some or another attempt at misdirection.
Dang, you are really a seriously failure…totally and completely lame as a warmista troll.
Better call for back-up.
Tell ya what Martin,
How about you keep an eye on that page and tell us all when the page that states..
“the absolute global sea level rise is believed to be 1.7-1.8 millimeters/year.”
comes back on line. 😉
Oh.. that value looks like its less than 2mm…. whatdyaknow ! 😉
Andy, here is the explanation for why your understanding is wrong:
http://sealevel.colorado.edu/faq#n3134
Martin.. Ths is the REAL DATA.. not UColorado’s fabrication.
http://realclimatescience.com/wp-content/uploads/2015/08/ScreenHunter_2763-Aug.-27-12.31.gif
See that middle section.. that is the stable tide gauges and they average well less than 2mm/year.
That is the REALITY that you are too brain-dead to see.
One can go to this page and see just how many of the tide gauges are LESS THAN 3mm/yr
http://tidesandcurrents.noaa.gov/sltrends/
Will this page now ALSO disappear.
How very inconvenient NOAA’s own data is to their story. !!! 😉
The stable long term tide gauges show ABSOLUTELY NO ACCELERATION, (maybe a hint of deceleration.)
Just like the satellite temperature data, there is ABSOLUTELY NO CO2 WARMING signature.
This is a FACT that they cannot twist or adjust their way around.
Steven, the data you are using from the 240 tide gauges doesn’t have the vertical land motion taken out. The explanation is on this page: http://tidesandcurrents.noaa.gov/sltrends/sltrends.shtml
You can’t use this data to compare to the global average sea level rise, which is computed from data where the vertical land movement has been removed.
Yes, and as SG has shown.. the vast majority are less than the 3.2mm/year that NOAA propagandises.
Even at the fabricated 3.2mm/year……
I mean.. wow.. SCARY !!!!
No, Andy, he hasn’t shown anything, because the data he is using still contain the vertical land movement. The 3.2 mm/year global average is computed from satellite data, which doesn’t have vertical land movement in it.
It is referenced to an area that has been shown to be sinking. So yes it does have an erroneous vertical land measurement built into it, as well as many false fabrications and adjustments.
The Tidal sea level data does not show any acceleration.
It cannot be adjusted because it is relied upon for shipping purposes.
End of story.
>It cannot be adjusted because it is relied upon for shipping purposes.
Correct. But when it is used to compute global average sea level, the vertical land movement is taken out. That’s the part Steven and you got wrong.
The most stable land tide gauges give a value of less than 2mm/year.
Live with that fact..
or scare yourself shitless with the erroneous 3.2mm/year.. putz !!!
Martin, you are a stupid turd. It doesn’t matter whether the vertical land movements are taken out, because the land movements are stable and not accelerating or decerating, so if the sea levels (without the land movements removed) are not accelerating, then sea level rise is not accelerating.
There is no vertical land movement in Hawaii, because it’s not part of a continent. There is land erosion over millions of years, but that’s so slow it’s negligible. In Hawaii, sea level rise is 1.5 mm/yr and not accelerating, and we can use that as a rise-ometer for the whole world because it’s in the middle of the ocean and not affected by anything. Not even the El-Nino
http://tidesandcurrents.noaa.gov/sltrends/sltrends_station.shtml?stnid=1612340
Read that, you idiot.
No, Morgan, you can’t. Here is the explanation:
http://sealevel.colorado.edu/faq#n3134
No bozo.
http://realclimatescience.com/wp-content/uploads/2015/08/ScreenHunter_2763-Aug.-27-12.31.gif
The middle 2/3 or so is where the land isn’t moving much….
and its ALL much less than 2mm/year.
As NOAA over-state on their missing page.
“the absolute global sea level rise is believed to be 1.7-1.8 millimeters/year.”
Actually the real value is more likely less than 1 – 1.5 mm/year.
Andy, here is the explanation for why your understanding is wrong:
http://sealevel.colorado.edu/faq#n3134
Hey Moron, do you understand the difference between sea level rise and acceleration of sea level rise? I really think you don’t.
Calling me names doesn’t prove your argument or Stevens. Let’s just agree that I am a moron and stop calling me names. I do understand the difference between speed and acceleration. It has nothing to do with showing Steven’s claims to be wrong. He is claiming fraud because a website is offline.
Martin.. look at the REAL DATA.. not UColorado’s fabrications.
http://realclimatescience.com/wp-content/uploads/2015/08/ScreenHunter_2763-Aug.-27-12.31.gif
See that middle section.. that is the stable tide gauges and they average well less than 2mm/year
He is claiming fraud because he has the guts to call it like it is!
NOAA is a political organization now, a collection of paid political hacks who care not a whit about science or accuracy.
MS equals Paid NOAA troll maybe after a couple of postings send him sideways, although allowing him here really helps as it shows how XXXXXX stupid they are LOL and actually helps the skeptic case hahahaha
Its bizarre that he has no understanding of real measurements and data.
But that is pretty standard for the brain-dead alarmista.. although this one at least has a little bit of sense and can admit that even the fabricated UC numbers are not the least bit scary.
down here, we have 0.65mm/year.
No acceleration.. no CO2 warming signal.
In fact not one of the longer term stable tide gauges shows ANY acceleration whatsoever.
No CO2 signature at all. None , Nada…. zip !!!
Martin Smith you are incorrect the sea level is FALLING! the only reason it is shown as rising is because it is ‘adjusted’
STUDY #1
Mid to late Holocene sea-level reconstruction of Southeast Vietnam using beachrock and beach-ridge deposits
Translation the sea level was up to 1.5 meters higher than today in a tectonically stable area ~5000 years ago to 2000 years ago.
STUDY #2
Late Quaternary highstand deposits of the southern Arabian Gulf: a record of sea-level and climate change
This study shows a sea level highstand ~1 to 2 meters above the present level about ~5500 years ago.
STUDY #3
The Quaternary Geological History of the Santa Catarina Southeastern Region (Brazil) 1999
The first part discusses drilling in several locations and analyzing samples. They mention dating prior to that was guesses. “…. A drilling campaign done in the domain permitted the sampling of material for 14C datings, and the obtained data confirmed some previously assumed ages. The sequence of events, that originated the Holocene deposits, has been also reconstructed through drilling and 14C dating of the collected peat and shell samples…”
In the body of the text is this:
This study shows a sea level highstand ~ 4 meters above the present level about ~5000 years ago. With sea level oscillating since then. Not only has the sea levels have dropped since the Holocene Optimum the evidence shows that “warmer paleotemperatures were favourable for great proliferation of mollusks in the area” Santa Catarina Brazil is at latitude 27.2500°S and is tectonically stable.
Notice the area where Roman sea ports are inland is tectonically stable according to NASA.
List of Roman Sea Ports found inland
(Has great pictures and maps.)
For the areas occupied by the Romans it was pretty close to zero or actually sinking! “..the pivot point is rather abrupt; Scotland is still rising due to the rebound effect which is correspondingly sinking England 2 millimetres into the North Sea each year.”
A NASA model of current surface elevation change due to post-glacial rebound and the reloading of sea basins with water. Canada, Northern Europe, and Antarctica are all currently rebounding at a rate of a few millimetres per year. More water in the oceans as a result of ice sheet melting is slowly depressing sea basins. Satellites are used to observe differences over time. http://basementgeographer.com/glacial-isostatic-adjustment/
https://i0.wp.com/basementgeographer.com/wp-content/uploads/2013/05/PGR_Paulson07_big.jpg
Notice the pivot point in the UK is ~ 55° N and the great lakes ~ 45° N which is one of the reasons why Southeast Vietnam ~10°N, the southern Arabian Gulf, ~ 23°N, and Santa Catarina, Brazil, 27° S are tectonically stable areas.
>>>>>>>>>>>>>>>>>>>>>>>>>>>>>
VALIDATION BY ALTERNATE STUDIES
GLACIAL ADVANCE
STUDY #4
Ice free Arctic Ocean, an Early Holocene analogue
STUDY #5
Temperature and precipitation history of the Arctic
STUDY #6
A new approach for reconstructing glacier variability based on lake sediments recording input from more than one glacier January 2012
The highest glacier growth started 600 years ago prior to that most glaicers had melted away.
THIRD METHOD OF VALIDATION
STUDY #7
Sea Level Changes Past Records and Future Expectations
Have they corrected for the 18.6-yearly Luna Nodal cycle? Linear trend lines on sinusoidal curves are very time dependent.
The Dutch who are the most concerned about actual sea level rise have found the cycle.
The Effect of the 18.6-Year Lunar Nodal Cycle on Regional Sea-Level Rise Estimates
Fedor Baart†,‡, Pieter H. A. J. M. van Gelder†, John de Ronde†,‡, Mark van Koningsveld†,§, and Bert Wouters†
(wwwDOT)bioone.org/doi/abs/10.2112/JCOASTRES-D-11-00169.1
Gail, the global mean sea level is not falling.
Ignore the data all you want , stooge.
You are looking more and more like a brain-washed moron.
Gail, your claim requires me to believe that all the science of all the scientists at CU: 3.3 ± 0.4 mm/yr, AVISO: 3.3 ± 0.6 mm/yr, CSIRO: 3.3 ± 0.4 mm/yr, NASA GSFC: 3.2 ± 0.4 mm/yr, and NOAA: 3.2 ± 0.4 mm/yr is wrongt. This explains why you are wrong: http://sealevel.colorado.edu/faq#n3134
They all use the same fabrication.
The REAL data contradicts their LIES.
You demand that |I believe that ALL the scientists at ALL these institutions are on the take. You can’t be serious that an unreviewed paper by one guy can overturn all the science of all the scientists at CU: 3.3 ± 0.4 mm/yr, AVISO: 3.3 ± 0.6 mm/yr, CSIRO: 3.3 ± 0.4 mm/yr, NASA GSFC: 3.2 ± 0.4 mm/yr, and NOAA: 3.2 ± 0.4 mm/yr. This explains why you are wrong: http://sealevel.colorado.edu/faq#n3134
What have you got against REAL DATA.?
Why must you rely solely on adjustments and fabrications..
…..its all you have, isn’t it.
I only use the real data, Andy. You demand that I believe that ALL the scientists at ALL these institutions are on the take. You can’t be serious that an unreviewed paper by one guy can overturn all the science of all the scientists at CU: 3.3 ± 0.4 mm/yr, AVISO: 3.3 ± 0.6 mm/yr, CSIRO: 3.3 ± 0.4 mm/yr, NASA GSFC: 3.2 ± 0.4 mm/yr, and NOAA: 3.2 ± 0.4 mm/yr. This explains why you are wrong: http://sealevel.colorado.edu/faq#n3134
CSIRO, NASA etc are all known climate data fabricators.. its all they are capable of now.
LOOK AT THE REAL DATA !!!!
No, Andy, they are not. You demand that I believe that ALL the scientists at ALL these institutions are on the take. You can’t be serious that an unreviewed paper by one guy can overturn all the science of all the scientists at CU: 3.3 ± 0.4 mm/yr, AVISO: 3.3 ± 0.6 mm/yr, CSIRO: 3.3 ± 0.4 mm/yr, NASA GSFC: 3.2 ± 0.4 mm/yr, and NOAA: 3.2 ± 0.4 mm/yr. This explains why you are wrong: http://sealevel.colorado.edu/faq#n3134
NIOAA’s own data and statement say that the sea level rise is less than 2mm/year,
yet you “believe” some rabid alarmist climate fabrication site..
LOOK AT THE REAL DATA.
http://realclimatescience.com/wp-content/uploads/2015/08/ScreenHunter_2763-Aug.-27-12.31.gif
Andy, you are comparing apples and oranges again. You demand that I believe that ALL the scientists at ALL these institutions are on the take. You can’t be serious that an unreviewed paper by one guy can overturn all the science of all the scientists at CU: 3.3 ± 0.4 mm/yr, AVISO: 3.3 ± 0.6 mm/yr, CSIRO: 3.3 ± 0.4 mm/yr, NASA GSFC: 3.2 ± 0.4 mm/yr, and NOAA: 3.2 ± 0.4 mm/yr. This explains why you are wrong: http://sealevel.colorado.edu/faq#n3134
There is NO ACCELERATION in any stable tide gauge.
None whatsoever.
No CO2 signature..
None whatsoever.
The real data shows a continued steady rise somewhere between 0 and 2mm per year.
that is what the REAL DATA shows.
You can accept the REAL DATA or go with the fabrications..
I know which you will choose… because you are brain-washed drone.
You are still comparing apples and oranges, Andy. You demand that I believe that ALL the scientists at ALL these institutions are on the take. You can’t be serious that an unreviewed paper by one guy can overturn all the science of all the scientists at CU: 3.3 ± 0.4 mm/yr, AVISO: 3.3 ± 0.6 mm/yr, CSIRO: 3.3 ± 0.4 mm/yr, NASA GSFC: 3.2 ± 0.4 mm/yr, and NOAA: 3.2 ± 0.4 mm/yr. This explains why you are wrong: http://sealevel.colorado.edu/faq#n3134
There is NO ACCELERATION in any stable tide gauge.
None whatsoever.
No CO2 signature..
None whatsoever.
The real data shows a continued steady rise somewhere between 0 and 2mm per year.
that is what the REAL DATA shows.
http://realclimatescience.com/wp-content/uploads/2015/08/ScreenHunter_2763-Aug.-27-12.31.gif
You can accept the REAL DATA or go with the fabrications..
I know which you will choose… because you are brain-washed drone.
You are comparing apples and oranges, Andy. You demand that I believe that ALL the scientists at ALL these institutions are on the take. You can’t be serious that an unreviewed paper by one guy can overturn all the science of all the scientists at CU: 3.3 ± 0.4 mm/yr, AVISO: 3.3 ± 0.6 mm/yr, CSIRO: 3.3 ± 0.4 mm/yr, NASA GSFC: 3.2 ± 0.4 mm/yr, and NOAA: 3.2 ± 0.4 mm/yr. This explains why you are wrong: http://sealevel.colorado.edu/faq#n3134
The real data shows a continued steady rise somewhere between 0 and 2mm per year.
that is what the REAL DATA shows.
You can accept the REAL DATA or go with the fabrications..
I know which you will choose… because you don’t have the ability act as anything but a parrot… a Norwegian blue at that.
Global sea level is rising because we came out of the LIA (little ice age) around 150 years ago. The sea level rise has not accelerated in 150 years. Tell us why, Martin.
Then tell us why the glaciers have been melting for 150 years (the glaciers that formed during the LIA).
Yes, Morgan, sea level has been rising all along, and the glaciers have been receding all along. But both at a much slower pace than they are changing now.
That’s horse manure.
The current GMSL rate is 3.2 mm/year, which is much higher than the average rate for the last century.
http://www.hyzercreek.com/glacierbaymap.gif
Yes, that one doesn’t invalidate what I wrote.
You are a schmuck. You use satellites to measure current rate and tide gauges for the rest of the century. Do you play pool with a broken cue stick?
Only the fabricated dat shows a rate of 3.2mm/year.
the tide gauges shows a steady rise with no acceleration.
The chnage from REAL DATA to fabrications specifically designed to increase the rate is what you are being conned by, because you are a mathematical and scientific illiterate..
There are no fabricated data, Andy. You demand that I believe that ALL the scientists at ALL these institutions are on the take. You can’t be serious that an unreviewed paper by one guy can overturn all the science of all the scientists at CU: 3.3 ± 0.4 mm/yr, AVISO: 3.3 ± 0.6 mm/yr, CSIRO: 3.3 ± 0.4 mm/yr, NASA GSFC: 3.2 ± 0.4 mm/yr, and NOAA: 3.2 ± 0.4 mm/yr. This explains why you are wrong: http://sealevel.colorado.edu/faq#n3134
http://www.hyzercreek.com/BrokenCueStick.jpg
I don’t know what you are trying to prove, Morgan.
Mt Baker glaciers have this pattern, as do many other northern glaciers.
https://wattsupwiththat.files.wordpress.com/2015/09/clip_image004.png
So awkward when FACTS and REAL DATA get in the way of the alarmista LIES, isn’t it. 😉
LOOK AT THE REAL DATA.. I dare you..
http://realclimatescience.com/wp-content/uploads/2015/08/ScreenHunter_2763-Aug.-27-12.31.gif
or is that beyond your ability.?
You can only parrot what some alarmista fabricator tells you..
So sad that you don’t have the ability to LOOK AT REAL DATA and think for yourself.
I have looked at the data. All the data. Not just your cherry-picked subset. You demand that I believe that ALL the scientists at ALL these institutions are on the take. You can’t be serious that an unreviewed paper by one guy can overturn all the science of all the scientists at CU: 3.3 ± 0.4 mm/yr, AVISO: 3.3 ± 0.6 mm/yr, CSIRO: 3.3 ± 0.4 mm/yr, NASA GSFC: 3.2 ± 0.4 mm/yr, and NOAA: 3.2 ± 0.4 mm/yr. This explains why you are wrong: http://sealevel.colorado.edu/faq#n3134
I am showing how tide gauges make a straight line up to 1993 when they switched to satellite altimetry, which also has a straight line, but a different slope. Hence, the broken cue stick.
I can’t verify anything about your graph. I can’t verify where the data are from, which adjustments have been made, nothing. And I certainly won’t take your word for anything, for the obvious reasons.
I spell it out pretty clearly here, with all sources:
http://www.hyzercreek.com/hoax.htm
No one requires you to believe anything Martin, except perhaps your own alarmist handlers.
See the broken cue stick. Manufactured by Mann Sporting Goods
We are just repeating ourselves now. Let’s end it. I’ll move on.
Here is Fort Denison tide chart from NOAA.
http://s19.postimg.org/o9k545yr7/image.jpg
Now, I defy you to find one single long term tide chart that shows an acceleration.
LOOK AT THE REAL DATA.. IF YOU DARE.
Of course you are repeating yourself. Its all you have.
And you are perpetually wrong.. like a brain-dead parrot.
Produce some real data.. do you have any , or are you stuck with climate fraud fabrications which have zero data to back them up.
Even NOAA’s own statement.. now removed of course, says quote..
“the absolute global sea level rise is believed to be 1.7-1.8 millimeters/year.”
Even this is an overestimation using their data.
Wow, miss a day… Martin,
1) A CYA sticker (dog ate my database) does not refute a fraud claim.
2) There are a number of studies showing ~1.8mm sea level rise since just before the pre-industrial era with no increase in rise rate since humans started pumping CO2 into the atmosphere. One study is here: http://kaares.ulapland.fi/home/hkunta/jmoore/pdfs/Jevrejevaetal2013GPChange.pdf
3) The 3.2mm/year in the NOAA report shows a mostly linear rise since 1993 as measured by satellites. That report COULD be correct, but not relevant. Comparing satellite (post 1993) with tide gauge data (pre 1993) doesn’t make sense. To detect a change in rise rate the same reference (tide gauges) must be used throughout the period in question.
4) Sea level has changed >100m over the last 15,000 years or so. 99.9% of that change occurred before humans discovered how to control fire. Taking a ~22 year snapshot of data and claiming evidence of a “CO2 signal” is madness (or fraud if you prefer). “Big Obtuse” is very good at ignoring pre-industrial climate changes.
It really is amazing just how variable the land-sea interface can be over a relatively short distance. For example the stretch of Normandy coast the allies landed on June, 6th, 1944. The landing at Sword Beach on the eastern end of the landing area was scheduled to occur nearly 40 minutes after the landing at Utah Beach on the western end just because of the difference in the tides. The distance between the western and eastern extremes of those two landing beaches is only about 85 km.
Martin Smith says: “… it is causing the number of flood days per year to increase for cities like Miami and Boston.”
BULL. Typical I have a hammer so everything looks like a nail mentality.
MIAMI
Florida has been pumping out ground water that means they have the same problem as New Orleans.
In 1835, Sheldon used 126 oxen and 250 men and in five months filled in the nasty stinking sea marsh at the edge of Boston. 180 years later we have wimps like Martin wining and whinging about a fingernails width of sea level rise a year during this modern warm period. Of course the sea level will fall again as the climate cools as it is showing signs of doing.
MARTIN,
If you don’t want your feet to get wet DON”T BUILD AT WATER LEVEL!…SHEESH
Of all the natural hazards like earthquakes, blizzards, tornadoes and hurricanes, flooding is very easy to guard against. Only the brain dead build in flood zones like river flood plains and right next to the ocean. In earlier times these idiots would be awarded the Darwin Award as they deserve. Now we get to foot the bill via raise insurance premiums.
Exactly Gail.
You have nailed it.
One can go all the way back to the Bible and find the admonishment that only a fool builds his house on sand.
Sea level rise is a non-issue for coastal dwellers, as nearly every inch of coastline will be struck by a catastrophic coastal storm before the current rate of rise ever causes a single house to be inundated. And that is IF sea level continues to rise at the same snail like pace as it has for over a century.
Storms, not sea level rise, is what will cause destruction of oceanfront property.
And the timing of the tides when each storm hits will continue to be the major factor it has always been.
If sea level was a real threat, rather than political garbage, why would we be rebuilding storm damaged real estate as fast as possible?
Why in heck did we rebuild New Orleans (and not correct the problems with the levees.)
Also the Dutch have proved for centuries that you can deal with the sea with good engineering.
Gail nailed it! Martin is a 20 something who has heard everything about AGW and nothing else! but us elders know you “don’t build near a river unless your ready for that 100 year storm” the LSM pounds AGW causes flooding! “it’s the storms stupid, Martin”
Reblogged this on Climatism.
Uh Oh, looks like they missed one… Search for “1.7-1.8” or http://tidesandcurrents.noaa.gov/est/faq.shtml
Might want to archive that page too, Steve…
Hello Gail Combs – I am impressed by your scholarship. Regarding higher sea levels in the recent millenia past, do you know anything about the raised beach lines evident on the shoreline of the Bay of Campeche, Mexico. A very good example can be seen on google maps satellite view near the town of Frontera, which is on the south side of the bay. One can see them at many locations around the bay. These appear to me to document a significant fall in ocean level, but is it Holocene? Ted
The whole coastline of NSW Australia has rock platforms that show that sea levels were 1-2m higher some time in the not too distant past.
Ted all it takes is a bit of a search. (You want to use the word highstand) Unfortunately the actual study is paywalled but it looks like what you are seeing is from the Eemain highstand but I can not really tell.
On the google page:
links:
http://www.researchgate.net/publication/24281057_Rapid_sea-level_rise_and_reef_back-stepping_at_the_close_of_the_last_interglacial_highstand
https://www.tcd.ie/Geography/RJE_site/Publications/PDF/Edwards_PIPG06.pdf
http://onlinelibrary.wiley.com/doi/10.1046/j.1365-3091.2003.00610.x/abstract
This one had an interesting find:
Thanks Gail! I had done a bit of a search but had come up dry. My background includes glacial geomorphology and I have had fun tracing elevated beach ridges on the Door peninsula and Washington Island, Lake Michigan, where the evidence of both falling lake levels early post glacial and isostatic rebound from glacial unloading is plainly evident. Interestingly, recently falling lake levels in Lake Michigan were taken as evidence of global warming but over just a few months the lake has risen 44 inches and is back to levels of 15 years ago. It is somewhat ironic that the ferry company got the navigation channel on the Washington Island side dredged deeper a couple of years ago just before the rebound in water levels. You can still see the dredge on the google earth satellite view. West side of the big bay on the south side of the island.
And here I am just a lowly chemist with a major interest in geology.
I am a chemist because I wanted to eat and not because I like chemistry. I much rather read papers in geology or biology than in chemistry. At Uni, I got kicked out of a grad level genetics class I stumbled into by mistake and then started auditing. I was looking for a place to study between classes instead of hoofing it back to the dorm. Fascinating stuff.
Trollsmith (TM) doesn’t understand that static webpages typically don’t “disappear” because a database is offline.
“… is currently operating in offline (non-database) mode.”
Translation:
We have something to hide.
I read the CU FAQ cited by Martin Smith and saw the following:
“The global mean sea level (GMSL) we estimate is an average over the oceans (limited by the satellite inclination to +/- 66 degrees latitude), and it cannot be used to predict relative sea level changes along the coasts. As an average, it indicates the general state of the sea level across the oceans and not any specific location.”
“GMSL is a good indicator of changes in the volume of water in the oceans due to mass influx (e.g., land ice melt) and density changes (e.g., thermal expansion), and is therefore of interest in detecting climate change.”
Two points:
1) Sea levels along the coast are what matters to most people and when most people hear the message “sea levels are rising” they assume sea levels along the coast are rising by the amount indicated. This is not at all true with GMSL. It does not accurately represent the sea level changes along the coasts as does the tide data cited by AndyG55. For direct impacts on humans, it is the tide data that matters.
2) In the context of detecting climate change using GMSL, the accuracy of the GMSL estimates is critical. I suspect the accuracy of the GMSL estimate for any particular time is not more than about +/- 0.5 meter and if I am right, then any trends less than this amount are in the noise range and mean nothing.
The good news: The Whitehouse Itself Undercut the AGW Scam!
AGW was an attempt to end economic inequality by limiting the size of the per capita CO2 exhaust around the globe. This noble cause failed because it is based on a falsehood: THE SUN – NOT CO2 – CONTROLS EARTH’S CLIMATE.
It was a Herculean task to return society to contact with reality, but we all tried. Earlier this week the Whitehouse finally admitted the biggest threat to the survival of civilization is NOT AGW, but a SOLAR EMP:
http://www.dailymail.co.uk/news/article-3302185/White-House-preparing-catastrophic-solar-flares-wipe-power-world-months-bringing-end-modern-civilization-know-it.html
The communications and electrical power grids of modern civilization are NOT NOW shielded from natural eruptions of our pulsar-centered Sun because politicians sought to end a worldwide economic inequality by convincing the public AGW causes climate change.
The communications and electrical power grids of modern civilization must now be shielded from eruptions of our pulsar-centered Sun.
“SOLAR ENERGY” https://www.researchgate.net/publication/280133563
Dr. Kenneth M. Towe of the Smithsonian Institution may have carried that message back to the Whitehouse after a length, and brutally honest, discussion of the lack of convincing evidence for AGW on ResearchGate:
https://www.researchgate.net/post/Is_there_convincing_evidence_of_AGW
If so, we are all indebted to Dr. Towe for informing the Whitehouse of the real danger to modern civilization – A SOLAR EMP; NOT AGW.
** News ** the original Nov 5th deleted page is back, about Sunday night Nov 8th your time.
Global Regional Trends Comparison (which mentions “the absolute global sea level rise is believed to be 1.7-1.8 millimeters/year”)
http://tidesandcurrents.noaa.gov/sltrends/globalregional.htm
Was it deleted in reaction to Steve’s post or just maintenance ? I don’t know.
– However the last NOAA page Steve linked to on Nov 7th ABOVE is now missing
“Sea Level Trends – Global Regional Trends”
http://tidesandcurrents.noaa.gov/sltrends/MSL_global_trendtable.htmlhttp://tidesandcurrents.noaa.gov/sltrends/MSL_global_trendtable.html
oops typo on that last link
http://tidesandcurrents.noaa.gov/sltrends/MSL_global_trendtable.html
Reblogged this on Climate Collections.