
NOAA has put the pedal to the metal for US climate fraud today.
This was the first of a series of completely fraudulent tweets they sent out today, claiming that 2015 was the second hottest year on record in the US.

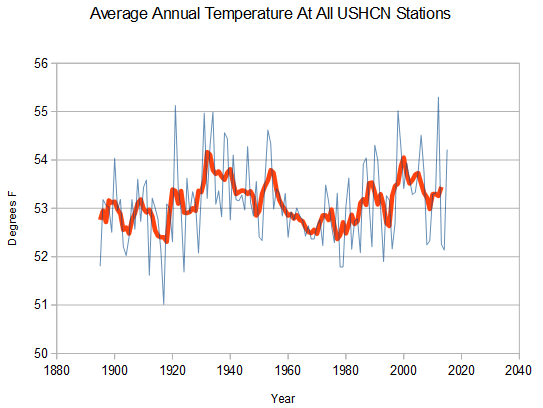
Before data tampering, 2015 was only 15th warmest, with nine of the warmer years coming before 1960. US temperatures have been cyclically cooling for 15 years.
And from there, the NOAA fraud gets much worse. The number of hot days in the US in 2015 was close to a record low, with barely 4% of readings over 95F (35C) – compared to almost 10% in 1936.

NOAA massively alters the data to create a warming trend where there is none.
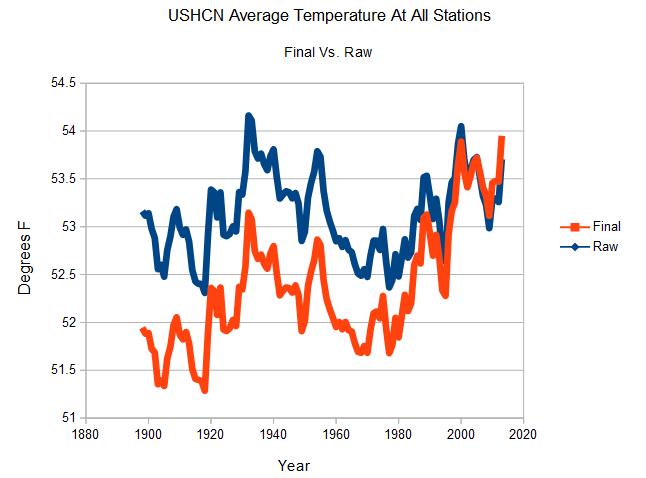
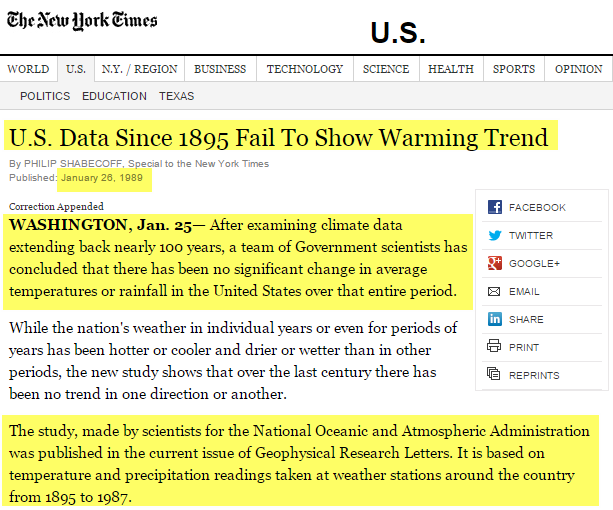
In 1989, the very same people at NOAA said there was no warming since 1895 in the US.
U.S. Data Since 1895 Fail To Show Warming Trend – NYTimes.com
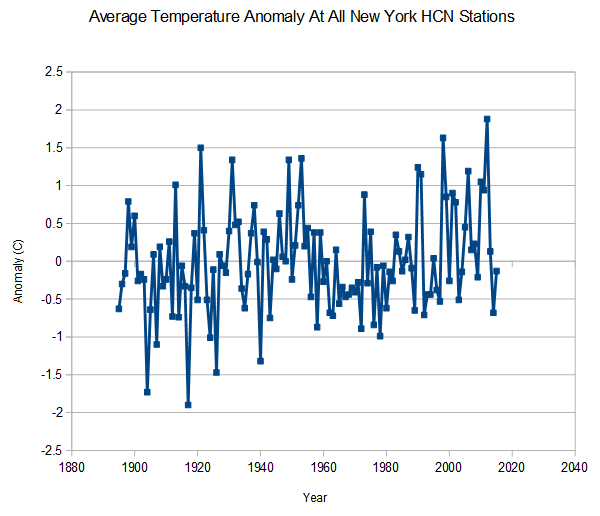
Here is another fraudulent graphic.
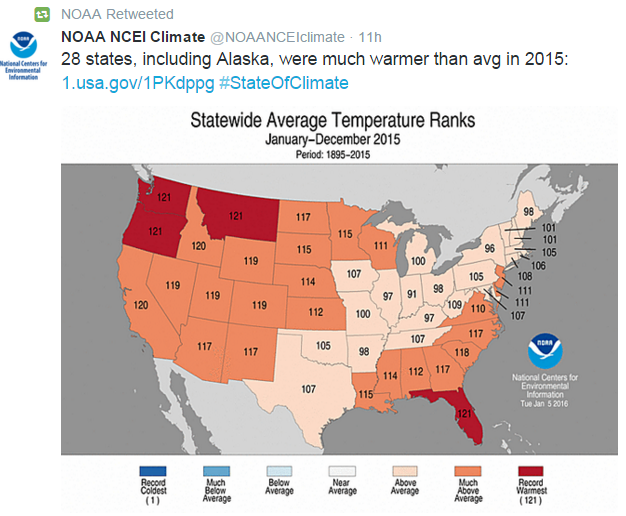
NOAA shows New York as 25th warmest year on record last year. In fact, temperatures were below the 1895-2015 average, and only 63rd warmest since 1895.
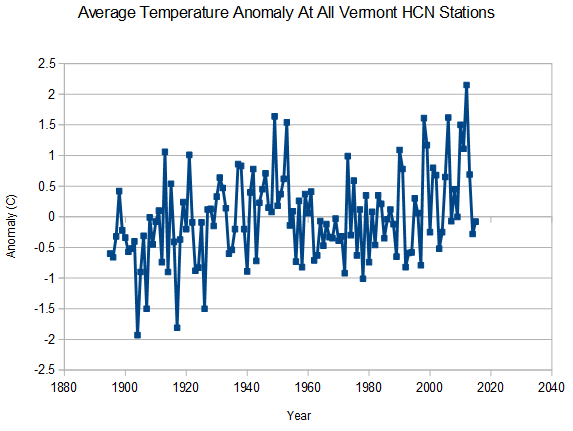
Similar story in Vermont
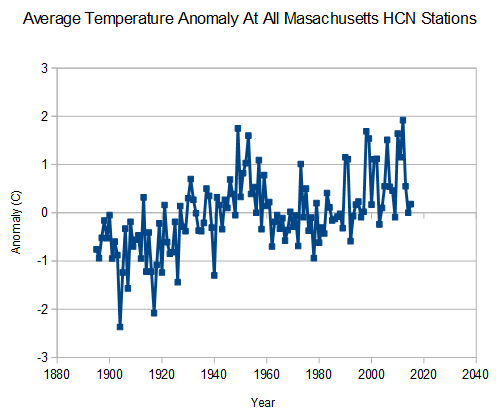
Similar story in Massachusetts
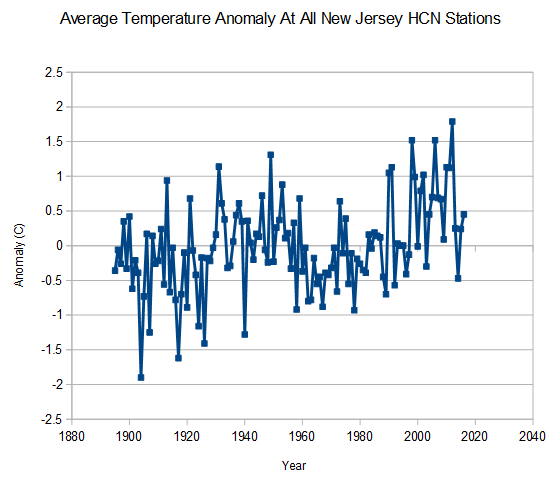
They showed New Jersey as 10th warmest, when in fact they were 37th warmest.
NOAA shows Wisconsin at 10th warmest, when in fact they are 33rd warmest.

The data does not show anything in the least alarming about US temperatures. NOAA reports directly to the White House, and has gone into full climate fraud mode, trying to create concern over a non-problem.
Under Barack Obama NOAA has become a propaganda organization, not a scientific one.

Last winter was so nice in the Seattle area last winter and spring, a little warmer than normal and dryer. I mean we needed it after the Oso mudslide in 2014, but it wasn’t that unusual, snowfall was down and our leaders and the media were screaming about a drought. I liked it. Steven you posted Boulder and Ft Collins snowfall data, check out Mt Rainier:
http://www.nps.gov/mora/planyourvisit/upload/Annual-snowfall-totals-July15-w-centlogo.pdf
Or Mt Baker: http://mtbaker.us/ski-area-info/snowfall-statistics/
Tony, you keep showing how bad they are! Thanks, and keep it up!
Shameless. They really are absolutely shameless. If anyone reading this is an employee at NOAA, now is the time to me a whistle blower and come clean. Your children will respect you for it — and you will be able to look in the mirror again.
Darn typos… “time to be”
SG, USCRN and ClimDiv are both putting 2015 in second place since 2005. December was the issue because of the way the jet stream wobbles worked.
http://www.ncdc.noaa.gov/temp-and-precip/national-temperature-index/time-series?datasets%5B%5D=uscrn&datasets%5B%5D=climdiv¶meter=anom-tavg&time_scale=p12&begyear=2005&endyear=2015&month=12
Final first three
USCRN
2012 2.531
2015 1.755
2006 1.343
ClimDiv
2012 2.460
2015 1.563
2006 1.428
Still.. the trend in USCRN is 0.03ºF/year and in ClimDiv (since 2005) its 0.007ºF/year.
ie basically ZERO trend.
Iceland, on the other hand, reported 2015 as its COLDEST year this century.
Globally 2015 was in 3rd place in both the satellite data sets.
UAH
1998 0.505
2010 0.365
2015 0.250
RSS
1998 0.550
2010 0.469
2015 0.358
This is the important one. Basically .2 degrees or more difference between 1st and 3rd. (This is why going by place is not necessarily relevant.)
That is a huge number. 1998 was easily the warmest year in the satellite era.
Meanwhile, the massively altered surface record, before being super massively altered, made 2014 hotter by .01 degrees. The satellite’s showed 1998 as being 20 times warmer.
Now their alterations are off the charts, beyond their own error bars.
They are still showing zero warming trend since 2005.
If you look, you will see that the December value was kicker.
Wait and see what January brings.
That isn’t the point
And now that UAH is in, down here in Australia, 2015 ended up in 11th place.
Give me a few minutes I’ll see what UAH says for USA48 and USA49.
UAH has 2015 in 1st place in both USA48 and USA49.
Can someone please check my calcs, my eyes are really sore and I’m struggling with the screen. I could easily be incorrect.
http://vortex.nsstc.uah.edu/data/msu/v6.0beta/tlt/uahncdc_lt_6.0beta4.txt
USA has been under the continuing effect of the El Nino, all year.
All monthly values in UAH are positive for both USA48 and USA49, whereas previous years all contained at least a couple of negative anomalies, so 2015 average stay high.
Please don’t be mad at me, I’m just doing the calcs and reporting my answer.
As I said.
Australia 2015 is in 11th place. Iceland coldest this century
If people want I can grab the 2 hemispheres, but much more than that, you will have to do your own calculations.. its good for you. 🙂
More UAH calcs
NH
1998 0.503
2010 0.403
2015 0.365
SH
1998 0.462
2010 0.279
2002 0.271
2015 0.169
Tropics
1998 0.675
2010 0.361
2015 0.344
NoPol
2010 0.803
2005 0.662
2012 0.550
2014 0.445
2003 0.411
2006 0.401
2007 0.370
2011 0.299
1995 0.284
2002 0.254
1981 0.232
2001 0.190
2015 0.179 13th place.
SoPol
Not posting the list. 2015 is in 35th place. I repeat 35th place. out of 37.
And that’s enough calcs for today 🙂
ps.. anyone thinks I’m incorrect somewhere.. let me know.
Looking at those NoPol and SoPol values…
….can someone remind what part of the world is meant to warm most under AGW ?
RSS has Continental USA 2015 in 2nd place.
2012 1.008
2015 0.831
1999 0.727
1998 0.727
RSS 60-82.5 NORTH
2010 1.175 1
2005 1.097 2
2012 0.949 3
2014 0.886 4
2003 0.842 5
2007 0.821 6
2011 0.791 7
2006 0.710 8
2015 0.622 9
RSS 60-70 SOUTH
2015 in 29th place
I would argue that the whole idea of a yearly average over a large area is arbitrary and pointless. Different regions have different conditions. Or you could start the year with a nasty cold winter, follow it up with a brutally hot summer and end up the same as a year with a warm pleasant winter followed by a cool pleasant summer. Completely different conditions, but the same final number. If a single night at 20 F destroys my citrus trees, I don’t care that it’s a “warm” year because we had a few summer days at 105 instead of 102.
“Second warmest ever,” even if not fudged, is meaningless.
USA has had a year of halves..
Half the country cold, half hot.. switching back and forth.
Its that stupid wobbly jet stream. !
It’s indeed that wobbly, meridional jet stream. They blame it, of course, on CO2.
You are exactly right. This was pointed out long ago,in a weather report for the entire year. There was a month in the northeast US that had extreme cold for two weeks, followed by two weeks of very warm conditions. The monthly average showed it as a “normal” month, which the report noted did not show just how bad conditions actually had been.
The damage to trees and the cost of the epic snow was immense, but looking at the monthly data now, you will see nothing out of the ordinary happened that month.
This is a huge problem for all kinds of things, from rainfall to snow to damage to plants, even globally the “averages” are sometimes meaningless for understanding what happened.
One could take the global rainfall data, then claim there was no drought in California, because globally there was actually more rain. The actual scientific mind can see the problem.
If NOAA is claiming 2015 was the second hottest…
….which year do they claim was the hottest
Bet they didn’t even go there…..
AndyG55 posted……..it was 2012
Well North Carolina certainly did not have hot days this summer. Not compared to 2004. We did have a warm fall/start of winter.
I think what has happened is that its just been that little bit warm all year in the majority of places. December, June, October and particularly March had high anomalies, and there were no negatives. That does not mean noticeable HOT days. Just generally warmer.
The data SG gives is an entirely different metric, so of course it may not coincide very well.
“and there were no negatives”
Whoops.. told you my eyes were struggling…
Missed it.. there is a single small value negative in USA48 and one in RSS USACont
Please stop spamming
Ok.. bye, bye..
Data seems to hurt you, also.
Bye
What I know is that this year during the summer central Indiana was cooler than normal. We did not have a single day that the temps reached 100 deg. F and very few that broke 90 deg. F. It was a relatively cool summer but a warmer than normal fall.
Just leave it. Actually he is allowing unfettered criticism on his site. LOL
Were in luck. Good ol DMI have NOT stopped the 30% graphing its at 11m2 KM
http://ocean.dmi.dk/arctic/old_icecover.uk.php
This time using OCean.dMi.dk to defeat the wordpress caching mechanism
http://OCean.dMi.dk/arctic/plots/icecover/icecover_current.png
To balance the discussion:
2015 Second Hottest Year Ever in US: Last year was the second hottest ever recorded in the continental US, and every state had above-average annual temperatures. Capped off by unprecedented warmth in December, the average national temperature was 2.4°F higher than normal, according to NOAA. Many states and cities crushed temperature records throughout the year, and 29 states had their hottest Decembers ever, with the national average temperature 6°F above average. Climate related disasters, from wildfires to floods, caused over $1 billion in damages, NOAA reports. The US warmth fits into the overall trend for 2015, which is nearly certain to shatter global temperature records and be the hottest year ever. (Washington Post $, AP, Climate Central, The Guardian, Reuters, The Hill, USA Today, Climate Home)
http://climatenexus.org/climate-change-and-el-ni%C3%B1o-fueled-2015%E2%80%99s-record-heat
http://www.ncdc.noaa.gov/sotc/summary-info/national/201512
http://www.climatecentral.org/news/december-heat-boosts-2015-to-2nd-warmest-year-for-us-19881
How much of the record warmth was created by manufacturing new temperatures?
There has been no increase in extreme weather or fires.
Why do you insist on quoting hyperbolized media?
What BS, we had zero 100°days, where we had several per year 2002-2014.
2015 was close to the bottom for hot weather since 1895.
You are committing fraud, Steven.
[SG: Last warning Dr. Smith. Your accusations are disgusting and incorrect. Next time you will be banned. There was very little hot weather in the US in 2015, as I have clearly documented]
http://realclimatescience.com/wp-content/uploads/2016/01/2016-01-08-07-12-41.png
https://i1.wp.com/realclimatescience.com/wp-content/uploads/2016/01/2016-01-07-12-45-09-1.png
Hey Martin, I am curious what your response is to the sentence where Steven says, “The number of hot days in the US in 2015 was close to a record low, with barely 4% of readings over 95F (35C) – compared to almost 10% in 1936.”
Is that true? Not true? Irrelevant? How do classify that statement? On what grounds?
More BS from the little child liar.
You are committing fraud, Steven.
Prove it.
“Capped off by unprecedented warmth in December…”
Yeah, weather happens. I found it awesome to wear shorts and not even think about a jacket until after Christmas. Hope we get this WEATHER again next year, and can’t understand why anyone thinks it’s a problem compared to killing blizzards. You must hate people and farm animals.
“Climate related disasters, from wildfires to floods, caused over $1 billion in damages, NOAA reports.”
I see it in the news a lot, but conflating monetary costs of weather related disasters with any indications of how severe the weather was is foolish. Monetary costs are very elastic for a LOT of reasons. How about this: “A small thunderstorm in Zimbabwe yesterday caused the sewers to back up and caused 578 trillion Zimbabwe dollars in damages!”
I have a ten trillion dollar zimbabwean bill.
http://static1.1.sqspcdn.com/static/f/227296/5026590/1260463658537/Zim_10trillion.jpg
It cost me less than four US dollars, including shipping.
Gator, I know that ours is only a rather ephemeral online connection — but I think you are the first TRILLIONAIRE that I have ever known. Gosh!
Luckily, the US dollar has only dropped by 96% to 98% (depending on how you calculate it — nothing like Zimbabwe’s 99.9999999999%.
Yet. 🙁
Becoming a trillionaire was one of the reasons I “invested” in Zimbabwe. The other reason was to have it framed in my gameroom as a conversation starter. We should strive to learn from the mistakes of others, and not suffer avoidable consequences.
“I see it in the news a lot, but conflating monetary costs of weather related disasters with any indications of how severe the weather was is foolish.”
Not if you are in the insurance business:
http://switchboard.nrdc.org/blogs/rmoore/assets_c/2014/05/Munich%20RE%20graph-thumb-500×377-15710.jpg
Consider two hypothetical storms — both identical in their severity. The first hits Palm Beach, Florida in 1910 and causes $100,000 in damages. The second hits Palm Beach, Florida in 2015 and causes $20,000,000 in damages. Which of the two identical storms is more severe, the $100,000 storm or the $20,000,000 storm?
The graph shows the number of storms, etc, over time. The meteorological events (green) and the climatological events (yellow) are increasing in number. It says nothing about dollar value, so your question, while interesting, is irrelevant.
Once again Marty sources far left advocates and activists for his “science”. 😆
Switchboard is the staff blog of the Natural Resources Defense Council, the nation’s most effective environmental group. For more about our work, including in-depth policy documents, action alerts and ways you can contribute, visit NRDC.org.
What a lying little moron.
” if you are in the insurance business” you are always looking for reasons to increase your bottom line and gouge the rate payers. “Climate Change’ is a real winner because you can bamboozle the ignorant ill informed politicians and public.
There fixed it for ya Marty!
The creator of the chart, Munich RE, is an insurance service that calculates the number of weather events based on “loss events”, not on severity of the weather.
Do you have anything about record cold anywhere or do you just do HOT ;>)
That was upthread to dr.martin don’t know why it is down here and not in his stupid face ;>)
WordUnimpressed has gone really wonky in the last few weeks.